
The grinding bear market in financial markets has quickly created what I am calling “A Culture of Collapse.” The collapse is on vivid display in the stocks of home builders and other related housing and construction stocks.
I cataloged the collapse in housing-related stocks that took on dramatic form two days ago. The iShares Dow Jones US Home Construction Index Fund ETF (ITB) had sliced through its 2018 low and a whole host of housing-related stocks were reaching similar and worse milestones. I already feel compelled to do an update because in just two more days a fresh collapse has unfolded. The losses are truly breathtaking and of course disheartening. While I have stepped away from accumulating any more positions, I am staying focused on the industry for the opportunity that lies ahead at some point in the future.
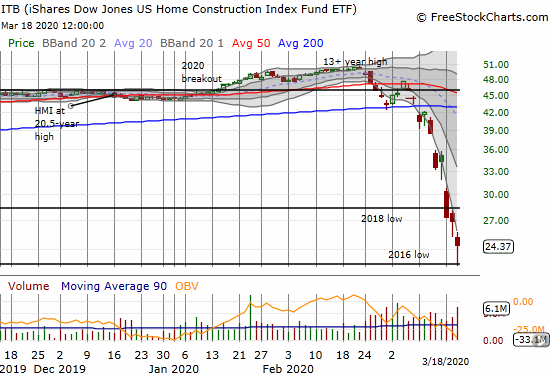
iShares Dow Jones US Home Construction Index Fund ETF (ITB)
The iShares Dow Jones US Home Construction Index Fund ETF (ITB) reached another milestone by testing support at its 2016 low. In that year, the ITB was about 75% of the way through a 4-year trading range that had a slight upward bias. Those were the perfect trading conditions for the strategy of buying into home builders on a seasonal basis. The current collapse of course blew up the trading model because the losses are too big to recover by April or May. Moreover, the accompanying abysmal economic prospects mean home builders and other housing-related companies and their stocks could struggle for at least a year. Recall that the housing market bottomed two years after the general economy bottomed in the 2008/2009 financial crisis. The industry takes a long time to heal from catastrophic events. A home is such a big purchase that the average person prefers to buy when times are good and prices are rising.
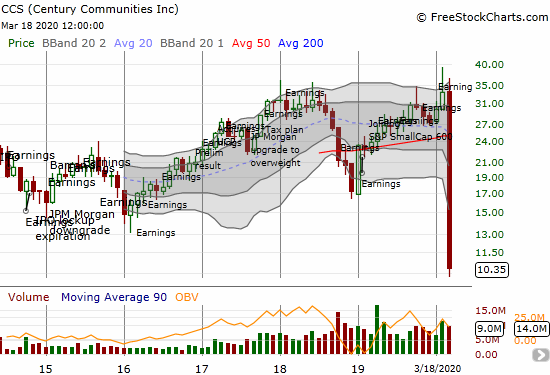
Century Communities (CCS)
The monthly chart below for Century Communities (CCS) says it all. In less than a month (the long red bar covers March), CCS wiped out all its gains as a publicly-traded company and then some. The coronavirus calamity presents a major reset for the company. I have CCS on the top of my shopping list whenever I decide to restart accumulating stocks in this sector. CCS now sports a price/book value of about 0.3 (as calculated from Yahoo Finance)!
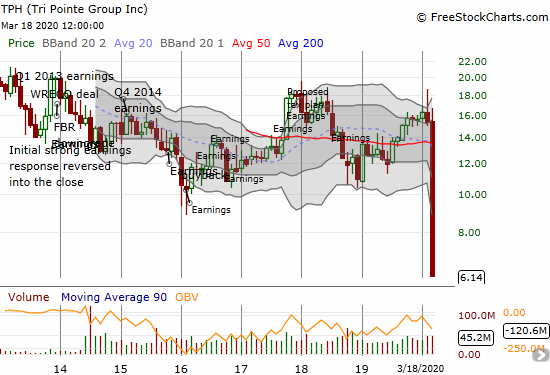
Tri Pointe Group (TPH)
Like CCS, Tri Pointe Group (TPH) covered the entire range of its life as a publicly traded company in less than a month. Unlike CCS, TPH was not recently at an all-time high. In fact, TPH topped out way back in 2013. TPH only started showing life in 2016. TPH is particularly suffering from its heavy reliance on the Californian housing market. TPH now sports a price/book value of 0.4.
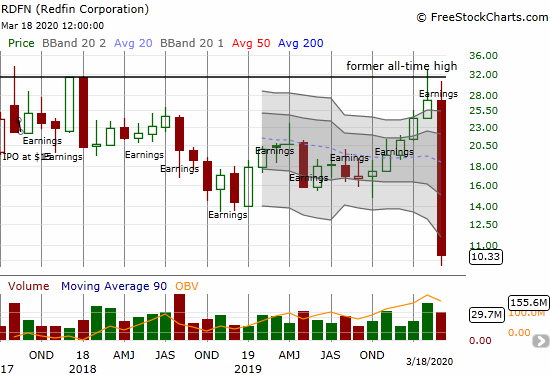
Redfin Corporation (RDFN)
It was just a month ago when Redfin Corporation (RDFN) was riding high at an all-time high and a very bullish earnings report. Like CCS and TPH, RDFN covered its entire price range as a publicly traded company. The momentum RDFN started building in 2019 is completely wiped out.
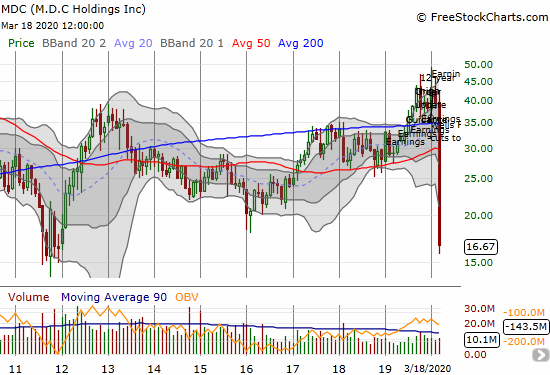
M.D.C. Holdings (MDC)
M.D.C. Holdings (MDC) did not make an all-time low but it came close to testing a major post-recession milestone from its 2011 lows. Just last month, MDC was trading at a 12-year high. MDC is sporting a 0.6 price/book ratio.
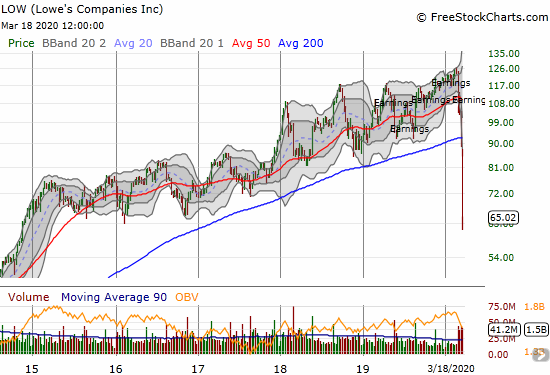
Lowe’s Companies (LOW)
Lowe’s Companies (LOW) has really surprised me. I thought of LOW as a good retailer for providing the kinds of supplies that people will want to stock for an anti-virus fight and to make home as comfortable and liveable as possible. Instead, LOW just finished wiping out five years of very steady and orderly gains. LOW looks like a bigger bargain than home builder stocks, but I am staying put for now. I do not even have a fresh buying point. Surely 2014 prices will present an irresistible bargain? I at least want to have a lot more LOW ahead of the next hurricane season when we get reminders of the importance of a Lowe’s.
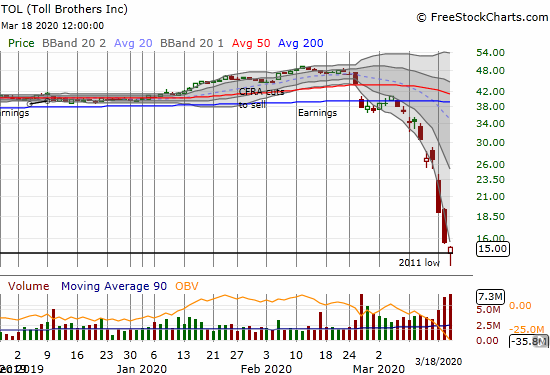
Toll Brothers (TOL)
I did not think I would post about Toll Brothers (TOL) again anytime soon, but today TOL puled off something as yet unseen during this sell-off: a bottoming hammer candlestick chart pattern. A hammer represents a potential final wash-out of sellers where a stock gaps down, sells to a low, and closes above the open. I consider the bottom confirmed once buyers are able to log a higher close. At a 0.4 price/book ratio, TOL is selling at a steep enough bargain to draw me into a final purchase off a technical pattern.
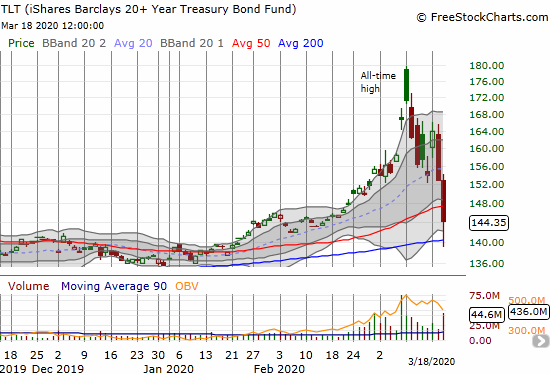
iShares Barclays 20+ Year Treasury Bond Fund (TLT)
The iShares Barclays 20+ Year Treasury Bond Fund (TLT) finished wiping out its parabolic move. Just last week, I used TLT as Exhibit A of the dangers of a parabolic run-up in a stock/equity. This week TLT resumed its sell-off and lost 11.9% in just the last two days. The crash in bond prices comes off record low yields. Those low yields were the one sliver of promise for home builders on the other side of the coronavirus crisis. Now, it looks like yields could easily keep going higher (bond prices lower) as the market anticipates the demands on debt markets to find massive fiscal stimulus for an economy that just last month was at full employment. America could finally get the inflation that has proven so elusive for so long. Ironically, that very inflation could make it even more attractive to own a home…and lock in a mortgage now.
Source for charts: FreeStockCharts
Be careful out there!
Full disclosure: long ITB shares and calls, long TOL shares and calls, long RDFN, long LOW shares and calls, long CCS
The monthly charts make for great illustrations of the quick calamity!
Yessir!
One day, we will look back and see this a generational buying opportunity. I just hope that time is in a year or two and NOT 5 or 10!