
AT40 = 58.4% of stocks are trading above their respective 40-day moving averages (DMAs)
AT200 = 48.4% of stocks are trading above their respective 200DMAs
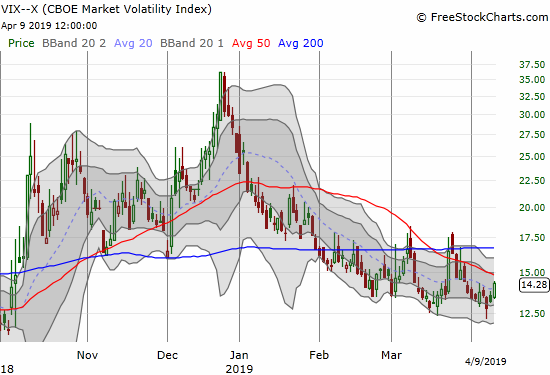
VIX = 14.3
Short-term Trading Call: bearish
Stock Market Commentary
Ever since the last overbought period ended, the stock market has experienced just two clear bearish signals. Each time, the bearishness was well-telegraphed but the pullbacks were brief and effectively painless for bulls and buyers. Today AT40, the percentage of stocks trading above their respective 40-day moving averages (DMAs) delivered the telegraph again. My favorite technical indicator maxed out at 68.0% last Friday, just under the overbought threshold of 70%, stalled on Monday, and fell all the way to a close of 58.4% on Tuesday. This trading action is what I consider a bearish rejection of “resistance” at the overbought threshold.
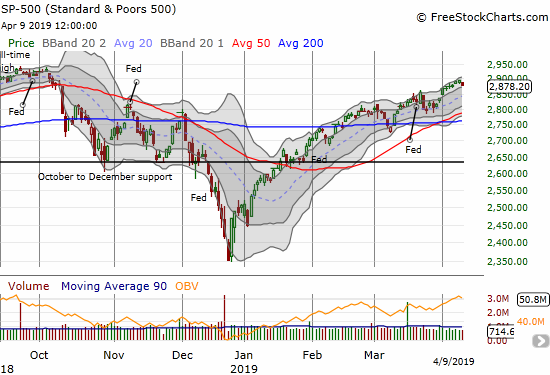
There are two elements that make this hesitation a bit more precarious han earlier episodes: 1) earnings season is about to begin, 2) the S&P 500 (SPY) is within just 1.8% of its all-time high.
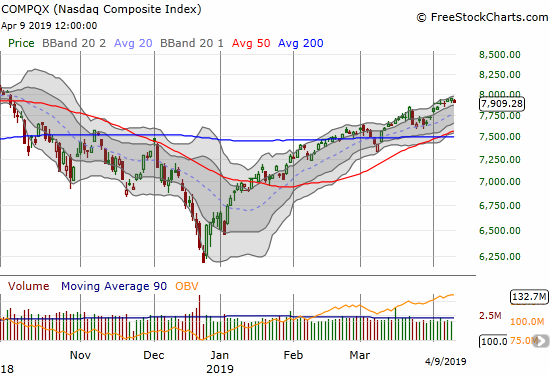
The NASDAQ (NDX) is also closing in on its all-time high set last August.
The S&P 500 (SPY) is up 3.9% ever since I flipped bearish on March 6th. Since then, I have seen precious few good bearish setups. Those setups remain rare in the universe I watch. A decent confirmation of the new bearishness would involve an S&P 500 (SPY) closing below its upper Bollinger Band (BB). Yet, strong support awaits from uptrending 20 and 50DMAs and even a flattened 200DMA. In other words, by the time the index manages to print a convincing breakdown, AT40 could be close to oversold levels (and a switch out of the short-term bearish trading call).
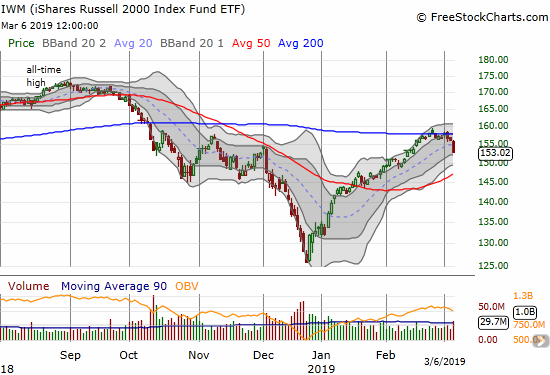
So instead of rushing out to make fresh bearish plays, I actually singled out a few long plays as hedges on long-standing short positions. In particular, I bought call options on iShares Russell 2000 ETF (IWM) even as the index of small caps confirmed 200DMA resistance with a 2.0% loss. If the market quickly rebounds from this period of hesitation, I expect IWM to at least rechallenge 200DMA resistance by the end of next week when my call options expire.
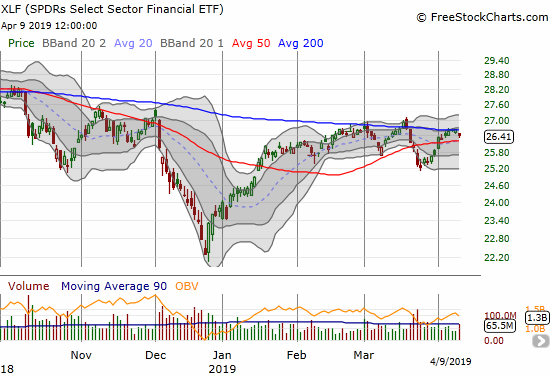
The Financial Select Sector SPDR ETF (XLF) looks ready to confirm bearishness as it struggles for a third time since March with its 200DMA resistance. I am already (re)short shares of Goldman Sachs (GS); this position seems sufficient given the bears look so tentative and GS earnings are coming up the morning of April 15th.
The volatility index, the VIX, did not look tentative with an 8.4% gain and a close near its high for the day. With the volatility faders stepping aside, the VIX should be good to finish a run for its 15.35 pivot. Today’s gain was enough to push my latest tranche of Pro Shares Ultra VIX Short-Term Futures ETF (UVXY) call options into the green. I am looking to take quick profits on this position as I do not anticipate an imminent/major bout of selling.
Stock Chart Reviews
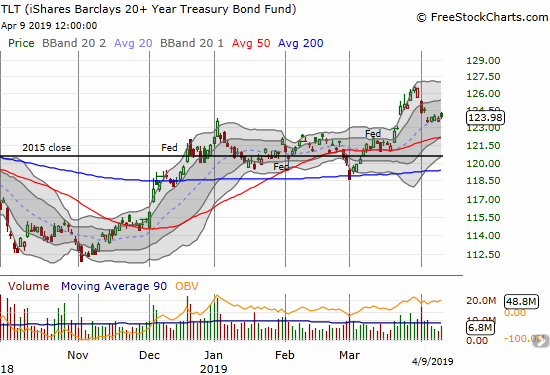
iShares 20+ Year Treasury Bond ETF (TLT)
The flight to safety ended with the iShares 20+ Year Treasury Bond ETF (TLT) dropping from a 16+ month high last week. In the last Above the 40 post, I claimed something had to give. Surprisingly, it was the bond market that gave.
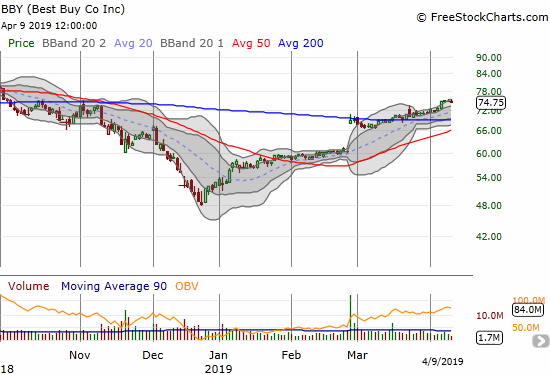
Best Buy (BBY)
Ever since a large post-earnings gap up, Best Buy (BBY) has shown little to no momentum. The stock has maintained just enough upward bias to drift across 200DMA resistance and then travel right along the edges of its upper Bollinger Band (BB) channel. The stock moved with such slow motion, the fresh breakout did not register with me as I was looking for BBY’s next “definitive move.”
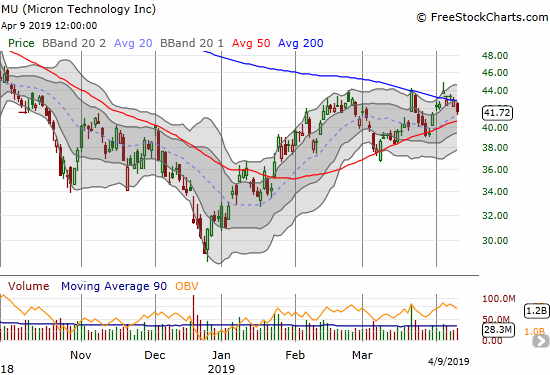
Micron (MU)
Micron (MU) is trading in a wedge or triangle pattern between 200DMA resistance and 50DMA support. I am still waiting for the big break out/down to follow.
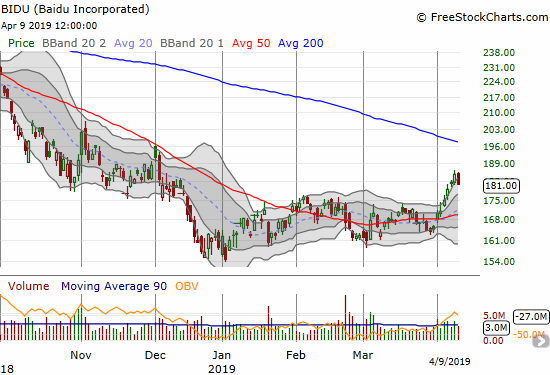
Baidu (BIDU)
Last week, Baidu (BIDU) broke out from a 3+ month long consolidation pattern. Until today, the stock barely looked back. The 2.0% loss on the day likely signals a pause for this rally. Unlike other stocks that experienced breakouts in recent weeks, I caught BIDU’s with a call spread.
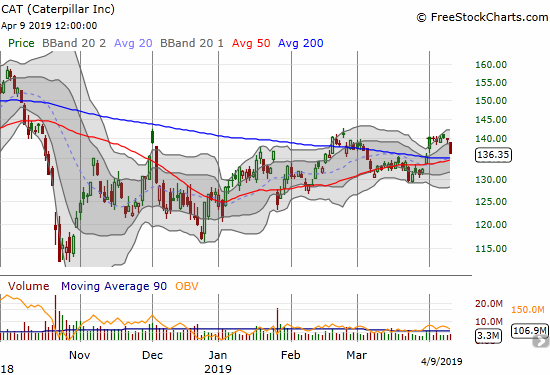
Caterpillar (CAT)
Given my short-term bearish trading call, I have been itching to get back into put options on CAT. Like so much of the market, a good bearish setup just never materialized after a brief 50DMA breakdown. When the stock stalled out at the February and 2019 high, I decided to take a shot.
Today, Caterpillar (CAT) dropped 2.5% in a move that looked like it confirmed resistance. I will likely take a small profit before the end of the week as converged 50/200DMA supports looks to hang tough.
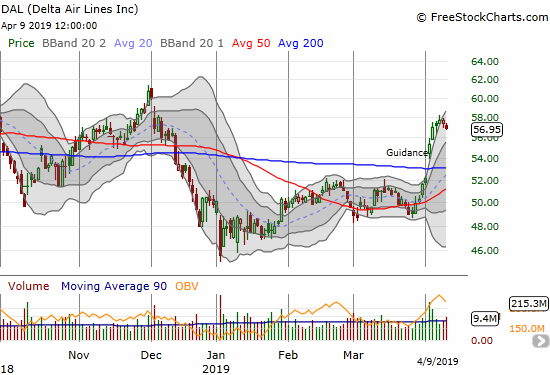
Delta Air Lines (DAL)
Delta Air Lines (DAL) punched out an impressive breakout last week on the heels of bullish earnings guidance. The stock is a buy on the dips from here.
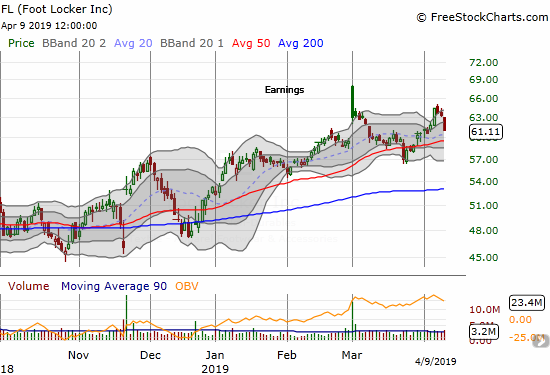
Foot Locker (FL)
In late March, I chased a 50DMA breakdown in Foot Locker (FL) with a put spread. The stock proceeded to jump higher from there. The last three days of weakness likely topped out the stock, but I am not likely to get salvage value out of my put spread. I am looking to take another swing on the next rebound.
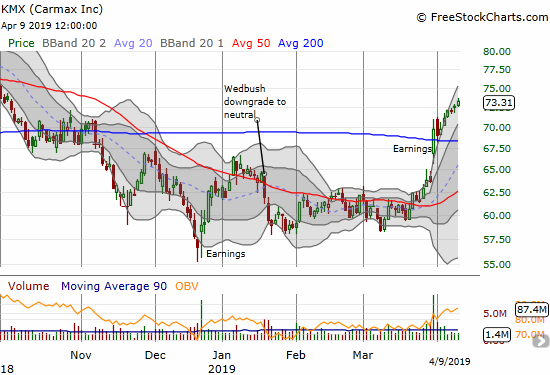
Carmax (KMX)
As KMX pivoted around its 50DMA for the first 2 1/2 months of the year, I thought the stock was headed for a breakdown below the December lows. Instead, the company managed to report earnings strong enough to send the stock soaring through 200DMA resistance. Now, KMX looks like a buy on dips.
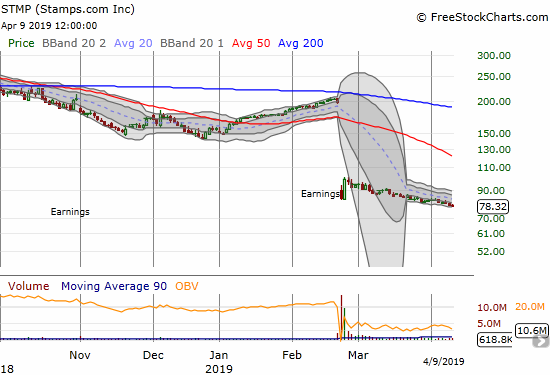
Stamps.com (STMP)
Stamps.com (STMP) set up for a short a month ago. The stock continued to dribble lower from there, but it was just enough to take me out of my put spread on Monday at my target profit.
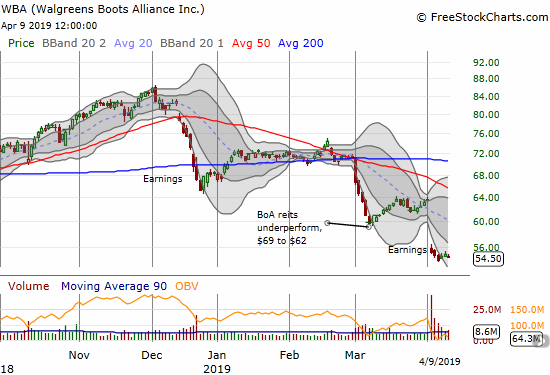
Walgreens Boots Alliance (WBA)
In a market with so few bearish setups, I find it particularly ironic that I failed to re-establish a short position in Walgreens Boots Alliance (WBA) ahead of an earnings report that sent the stock to a 5 1/2 year low. That gap down was a resounding (re)confirmation of my near year-long bearish thesis. I covered my short position near the end of the last sell-off and assumed I would get a fresh setup at or near 50DMA resistance.
I still think WBA is challenged, but the risk/reward for a short is not good here. The company is actively looking for ways to slash its cost structure and give consumers new reasons to visit their local drugstore. Wall Street tends to bet on these initiatives, especially with well-established companies. The stock would be good for a rebound play on a post-earnings closing high.
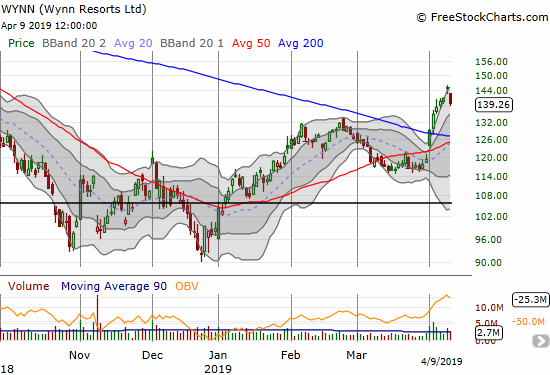
Wynn Resorts (WYNN)
I let Wynn Resorts (WYNN) slip by me after its 200DMA breakout. I am now eyeing it for a test of support.
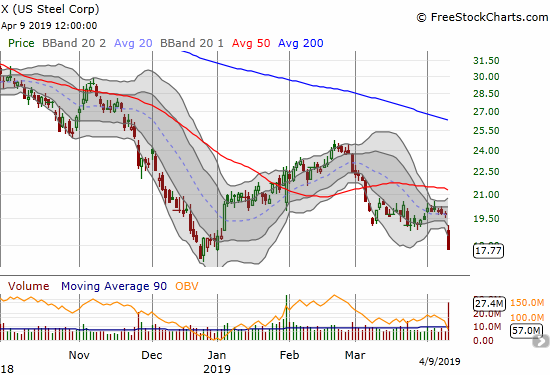
U.S. Steel (X)
A month ago I flagged U.S. Steel (X) as a short. I did wanted to wait for a bounce to 50DMA resistance before making a trade, but the stock never came close to generating the desired setup. I changed my approach to buy an April put spread. The position quickly went from a small loss to a large gain on the heels of a big downgrade to underperform and a $13 price target from Credit Suisse.
— – —
FOLLOW Dr. Duru’s commentary on financial markets via email, StockTwits, Twitter, and even Instagram!
“Above the 40” uses the percentage of stocks trading above their respective 40-day moving averages (DMAs) to assess the technical health of the stock market and to identify extremes in market sentiment that are likely to reverse. Abbreviated as AT40, Above the 40 is an alternative label for “T2108” which was created by Worden. Learn more about T2108 on my T2108 Resource Page. AT200, or T2107, measures the percentage of stocks trading above their respective 200DMAs.
Active AT40 (T2108) periods: Day #66 over 20%, Day #64 over 30%, Day #63 over 40%, Day #8 over 50% (overperiod), Day #1 under 60% (underperiod), Day #25 under 70%
Daily AT40 (T2108)
")
Black line: AT40 (T2108) (% measured on the right)
Red line: Overbought threshold (70%); Blue line: Oversold threshold (20%)
Weekly AT40 (T2108)

*All charts created using FreeStockCharts unless otherwise stated
The T2108 charts above are my LATEST updates independent of the date of this given AT40 post. For my latest AT40 post click here.
Related links:
The AT40 (T2108) Resource Page
You can follow real-time T2108 commentary on twitter using the #T2108 or #AT40 hashtags. T2108-related trades and other trades are occasionally posted on twitter using the #120trade hashtag.
Be careful out there!
Full disclosure: long UVXY calls, long TLT puts, long BIDU call spread, long CAT puts, long FL put spread, long X put spread, short GS
*Charting notes: FreeStockCharts stock prices are not adjusted for dividends. TradingView.com charts for currencies use Tokyo time as the start of the forex trading day. FreeStockCharts currency charts are based on Eastern U.S. time to define the trading day.