
AT40 = 52.3% of stocks are trading above their respective 40-day moving averages (DMAs) (2+ month low)
AT200 = 42.6% of stocks are trading above their respective 200DMAs
VIX = 13.7
Short-term Trading Call: bearish (caveats below!)
Stock Market Commentary
The previous Friday’s trading action provided delayed confirmation of my short-term bearish trading call. Last week delivered no follow-through and instead gave me the impression that the stock market has become a coiled spring.
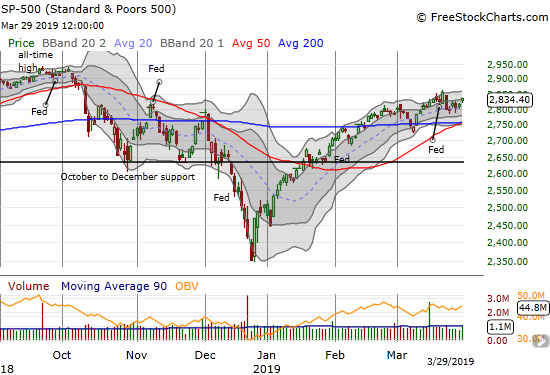
The S&P 500 (SPY) ended last week on a strong note with a 0.7% gain. The big drop that preceded the week now looks like just an oversized move within a consolidation range which itself sits comfortably within a months long post-correction recovery. In other words, the index is just as likely idling and resting ahead of the next advance as it is setting up for a test of converged 50 and 200DMA support.
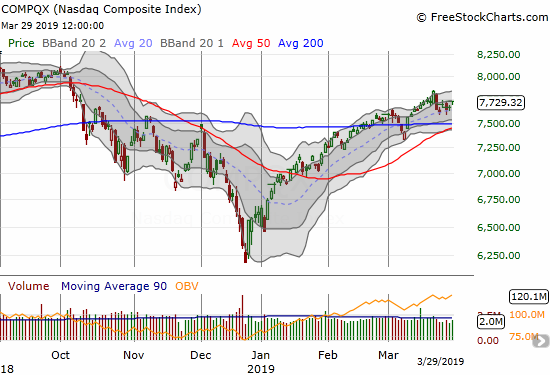
The NASDAQ (NDX) is technically a near carbon-copy of the S&P 500.
Other indices which delivered convincing confirmation of trouble also failed to follow-through for sellers.
The iShares Russell 2000 ETF (IWM) broke down below its 50-day moving average (DMA) and hit a 6-week low two Fridays ago. Sellers failed to push IWM any lower. The index closed last week above its 50DMA.
The Financial Select Sector SPDR ETF (XLF) looks worse than IWM and suffered even more severe selling. Still, sellers were only able to push XLF lower one more day last week. The index is now stretching for 50DMA resistance.
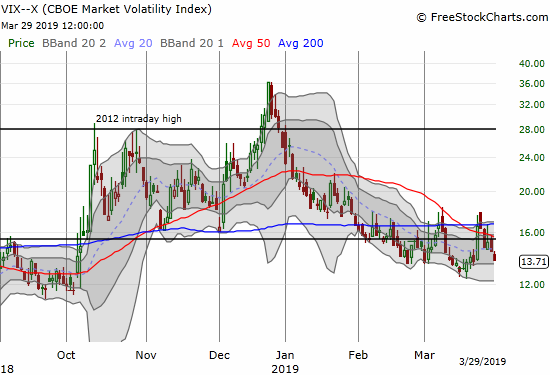
Two Fridays ago, the volatility index, the VIX, underlined the market’s stress with a 20.9% surge. The volatility faders took over from there. For 4 of 5 days last week, the VIX closed with a loss. I spent that week accumulating a fresh position in Pro Shares Ultra VIX Short-Term Futures ETF (UVXY) calls options expiring this coming Friday. I fully expected the VIX to refresh itself. Instead, a quick return to complacency looks ready to drive the VIX right back its lows of 2019.
At the end of the previous week, AT40 (T2108), the percentage of stocks trading above their respective 40-day moving averages (DMAs), confirmed the market’s bout of weakness by dropping to a 2+ month low at 45.4%. My favorite technical indicator went from a bearish divergence with the stock market to a harmonic resonance with the market. That resonance has now settled down with AT40 closing the week at 52.3%.
As I noted a week ago, AT40 fell so far so fast that bargain hunters might get motivated. I pre-empted that shopping by scooping up positions in what was working ahead of the big one-day pullback. I intended to sell the positions quickly, but, surprisingly, none of those trades worked out even as the market settled down. On the bearish side, I continue to find few interesting setups.
I looked at Monday’s product announcement from Apple (AAPL) as a convenient proxy for the new tension between bears and bulls. While AAPL faded on the news as expected, the rest of the stock market appeared unfazed even after AAPL closed below its 200DMA. The bargain hunters were too busy elsewhere. I decided to restart my weekly AAPL call buying trade after AAPL started heading toward 200DMA resistance.
In the last Above the 40 post I offered up Levi Strauss and Company (LEVI) and Lyft (LYFT) as two individual IPOs to watch. The signaling ended in a wash. LEVI managed to close the week at a post-IPO high after starting the week under selling pressure. Lyft’s IPO was over-subscribed. The stock sold at $72 above the original $62-68 range. The stock opened at an eye-popping $86.75. I tried to short shares just in case any happened to be available – no luck (the short borrow fee was 99% anyway!). The stock was under intraday selling pressure for over half the day and closed at $78.29.
While AT40’s absolute level is not helpful in the 50s, its direction from here should be helpful. I will be watching this week to see whether AT40 continues higher…or slips back into a bearish divergence. In the former case, I will be forced to move my short-term trading call from bearish to cautiously bearish.
Stock Chart Reviews
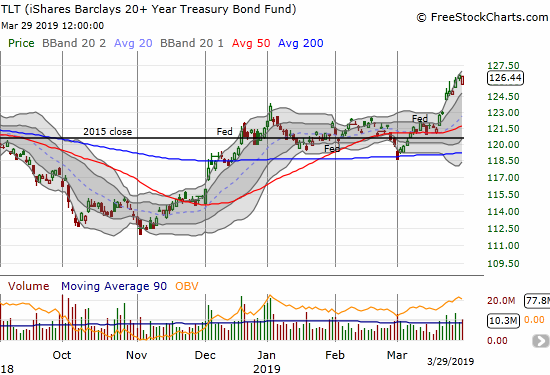
iShares 20+ Year Treasury Bond ETF (TLT)
The iShares 20+ Year Treasury Bond ETF (TLT) rallied for most of the week in a flight to safety that directly contrasted the complacent trading in stocks. Something has to give, especially with increasing concerns over an economic slowdown in the US. I am still holding put options in TLT that I thought would benefit if the stock market regained its footing as it seems to have done.
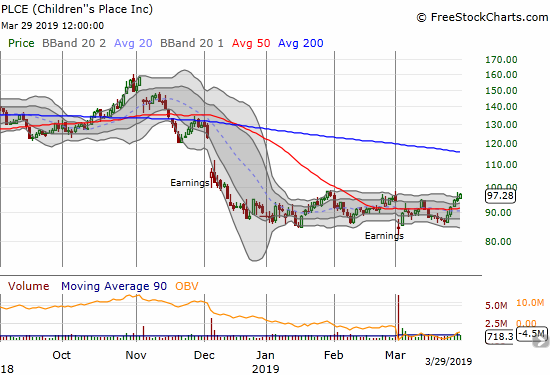
Children’s Place (PLCE)
I missed the latest bounce in Children’s Place (PLCE) as I braced for what I thought would be a breakdown to new lows. Now I am watching to see whether PLCE can break OUT from what is now a 4-month long consolidation range.
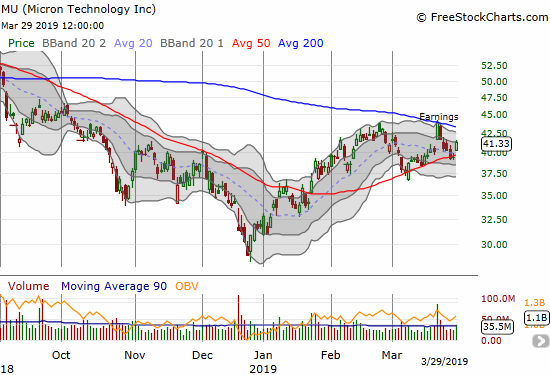
Micron (MU)
Micron (MU) traded like it tried to confirm market bearishness. The stock quickly reversed its impressive post-earnings gap. In the process the stock confirmed 200DMA resistance. The bounce from 50DMA support keeps the stock in a wedge. I am looking to trade the stock in the direction it breaks from this wedge.
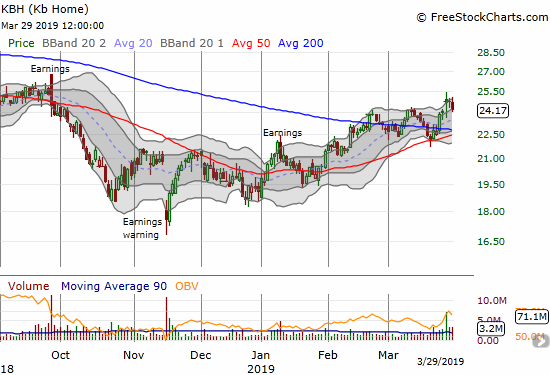
KB Home (KBH)
In the wake of KB Home (KBH) earnings, the stock swung wildly from a gap up, to a reversal to a gain on the day. The stock closed the week where it started pre-earnings. Instead of selling my KBH calls, I bought puts in anticipation of a bigger move in one direction or the other (I am leaning toward the downside).
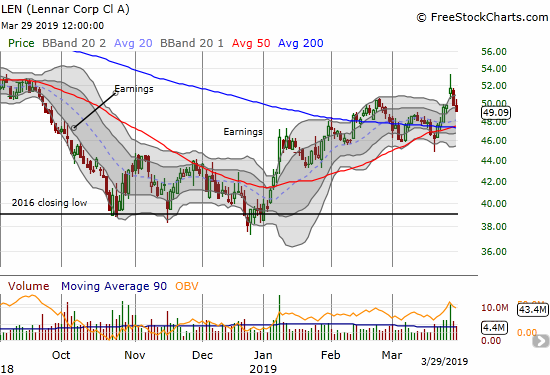
Lennar (LEN)
Lennar (LEN) looks more convincingly bearish than KBH after its post-earnings fade slid the stock right past its pre-earnings close. Moreover, the stock traded well-above its upper Bollinger Band (BB) before the sellers took over.
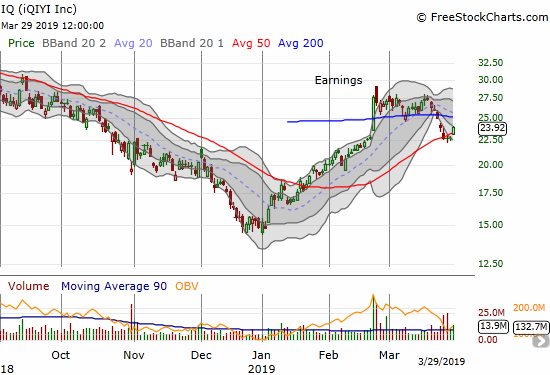
iQIYI (IQ)
My latest experience in iQIYI reminded me why to-date I have tried to trade it while remaining long-term bullish on the stock. I decided not to cash in on February’s post-earnings surge; I just sat on my position. I did not even act after the stock last closed below 200DMA support. The company proceeded to offer up more stock to the market and sellers quickly took IQ to 50DMA support.
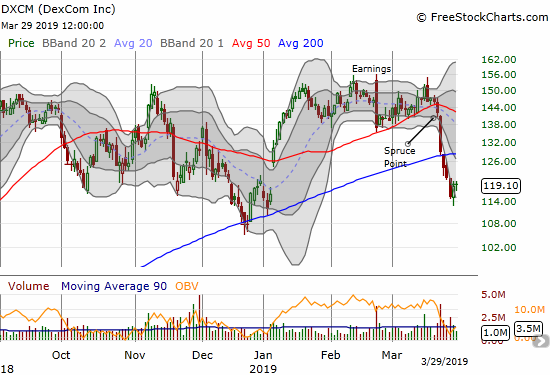
DexCom (DXCM)
The selling pressure in DXCM continues to surprise me. Bargain hunters finally stepped up the last two days, but the damage may be done with last week’s 200DMA breakdown.
— – —
FOLLOW Dr. Duru’s commentary on financial markets via email, StockTwits, Twitter, and even Instagram!
“Above the 40” uses the percentage of stocks trading above their respective 40-day moving averages (DMAs) to assess the technical health of the stock market and to identify extremes in market sentiment that are likely to reverse. Abbreviated as AT40, Above the 40 is an alternative label for “T2108” which was created by Worden. Learn more about T2108 on my T2108 Resource Page. AT200, or T2107, measures the percentage of stocks trading above their respective 200DMAs.
Active AT40 (T2108) periods: Day #59 over 20%, Day #57 over 30%, Day #56 over 40%, Day #1 over 50% (overperiod), Day #6 under 60%, Day #18 under 70%
Daily AT40 (T2108)
")
Black line: AT40 (T2108) (% measured on the right)
Red line: Overbought threshold (70%); Blue line: Oversold threshold (20%)
Weekly AT40 (T2108)

*All charts created using freestockcharts.com unless otherwise stated
The T2108 charts above are my LATEST updates independent of the date of this given AT40 post. For my latest AT40 post click here.
Related links:
The AT40 (T2108) Resource Page
You can follow real-time T2108 commentary on twitter using the #T2108 or #AT40 hashtags. T2108-related trades and other trades are occasionally posted on twitter using the #120trade hashtag.
Be careful out there!
Full disclosure: long UVXY calls, long KBH calls and puts, long AAPL calls, long IQ, long TLT puts
*Charting notes: FreeStockCharts.com stock prices are not adjusted for dividends. TradingView.com charts for currencies use Tokyo time as the start of the forex trading day. FreeStockCharts.com currency charts are based on Eastern U.S. time to define the trading day.