
AT40 = 13.2% of stocks are trading above their respective 40-day moving averages (DMAs) – a 4th oversold day (below 20%)
AT200 = 33.6% of stocks are trading above their respective 200DMAs
VIX = 21.3 (no change)
Short-term Trading Call: bullish
Commentary
All eyes are now trained on the stock market’s critical long-term moving averages as oversold conditions stretch into a fourth day. AT40 (T2108), the percentage of stocks trading above their respective 40-day moving averages (DMAs), increased to 13.2%. This level is still very low, but it set up a mild bullish divergence with the S&P 500 (SPY). AT200 (T2107), the percentage of stocks trading above their respective 200DMAs, increased to 33.6%.
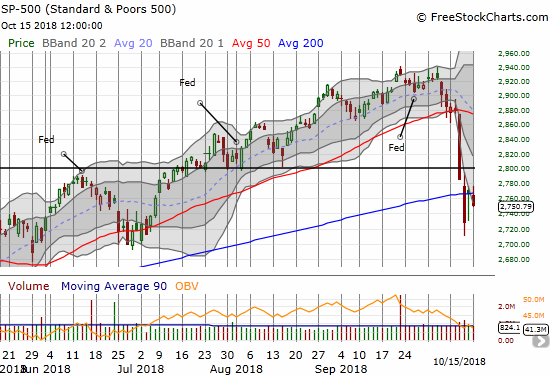
The S&P 500 (SPY) lost 0.6%. More importantly, the index closed below its lower Bollinger Band (BB) for the fourth straight day and faded from resistance at its 200-day moving average (DMA). These technical dynamics are signs of sellers staying in control even as the slight increase in AT40 suggests a rebound is imminent.
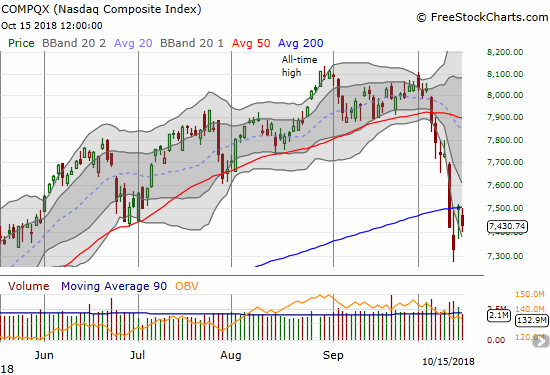
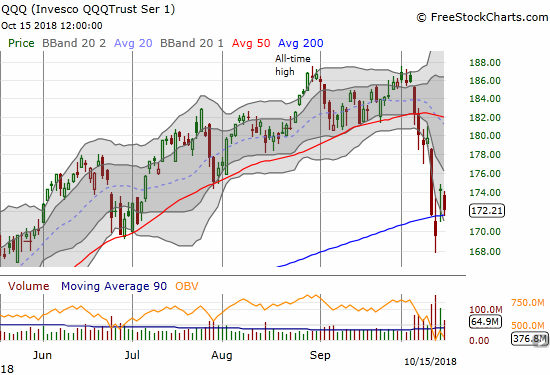
The NASDAQ also faded from 200DMA resistance but closed above its lower-BB with a 0.9% loss. The Invesco QQQ Trust (QQQ) lost 1.2% but held 200DMA *support* in picture-perfect form.
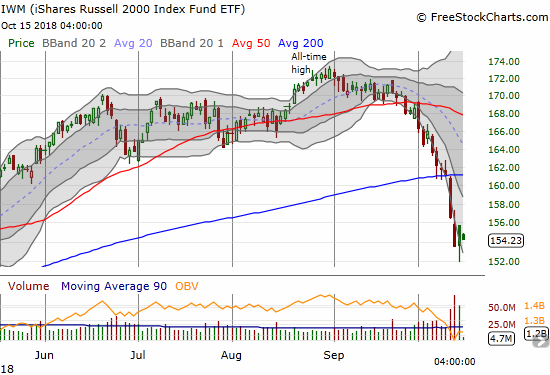
The ever-sinking small caps flipped the script with a day of relative out-performance. The iShares Russell 2000 ETF (IWM) gained ever so slightly at 0.4% as the index held recent lows.
The volatility index, the VIX, was flat on the day. At 21.3 it is still in an “elevated” position above 20.
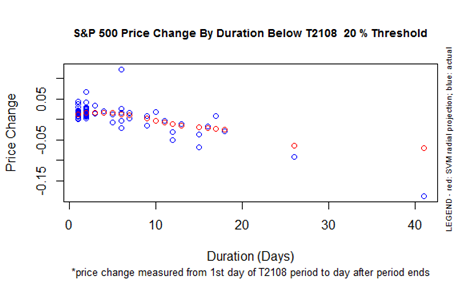
As a reminder, the average oversold period lasts about 5 days. As the oversold period stretches out, I start monitoring the performance of the S&P 500 during this period. After about the 6th or 7th oversold day, the projected performance of the S&P 500 while AT40 trades under 20% starts to decline. By the 9th day, the projected performance flips negative and steadily declines from there. Since going oversold the S&P 500 is down 1.3% (measured from the close of the first oversold day).
I set a low ball offer for SPY call options expiring next Friday that I thought would only execute a deep swoosh downward. The rush for the exits right at the close turned out to be enough. Per the oversold strategy I have laid out in earlier posts, I will accumulate more SPY call options on VIX spikes that send the market into even deeper oversold territory.
CHART REVIEWS
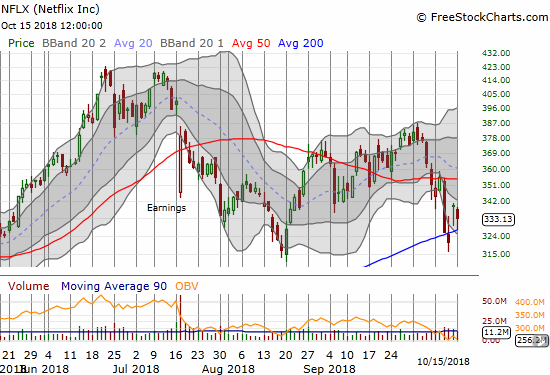
Netflix (NFLX)
All eyes will be on NFLX earnings Tuesday evening as a very visible test of the market’s new bearish sentiment. The stock is conspicuously and tantalizingly maintaining 200DMA support after a brief breakdown last week. The bounce from that breakdown also confirmed support from the post-earnings low set in mid-July. I do not dare make a pre-earnings play on NFLX, but I will be ready to move post-earnings. I am expecting NFLX to sustain its post-earnings move as either a killer 200DMA breakdown or a confirmation of 200DMA support…50DMA resistance notwithstanding.
— – —
FOLLOW Dr. Duru’s commentary on financial markets via email, StockTwits, Twitter, and even Instagram!
“Above the 40” uses the percentage of stocks trading above their respective 40-day moving averages (DMAs) to assess the technical health of the stock market and to identify extremes in market sentiment that are likely to reverse. Abbreviated as AT40, Above the 40 is an alternative label for “T2108” which was created by Worden. Learn more about T2108 on my T2108 Resource Page. AT200, or T2107, measures the percentage of stocks trading above their respective 200DMAs.
Active AT40 (T2108) periods: Day #4 under 20% (oversold), Day #4 under 30%, Day #11 under 40%, Day #16 under 50%, Day #32 under 60%, Day #85 under 70%
Daily AT40 (T2108)
")
Black line: AT40 (T2108) (% measured on the right)
Red line: Overbought threshold (70%); Blue line: Oversold threshold (20%)
Weekly AT40 (T2108)

*All charts created using freestockcharts.com unless otherwise stated
The charts above are my LATEST updates independent of the date of this given AT40 post. For my latest AT40 post click here.
Related links:
The AT40 (T2108) Resource Page
You can follow real-time T2108 commentary on twitter using the #T2108 or #AT40 hashtags. T2108-related trades and other trades are occasionally posted on twitter using the #120trade hashtag.
Be careful out there!
Full disclosure: long UVXY puts, long SPY calls
*Charting notes: FreeStockCharts.com stock prices are not adjusted for dividends. TradingView.com charts for currencies use Tokyo time as the start of the forex trading day. FreeStockCharts.com currency charts are based on Eastern U.S. time to define the trading day.