
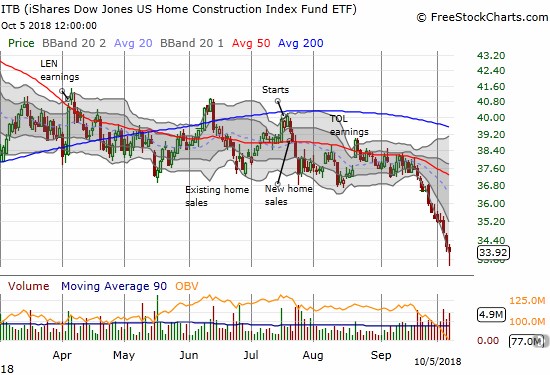
I saw a flicker of hope for home builders in the May Housing Market Review. Traders decided to snuff that flicker out very quickly afterward. When I wrote June’s housing market review and described a “struggling flicker,” the iShares US Home Construction ETF (ITB) was once again bouncing off the bottom of 2018’s trading range. Almost like a cycle, a month later the July Housing Market Review came just as ITB tested the bottom of the range once again. By the time of the September Housing Market Review, ITB was still holding to its trading range, but weakening housing data made for a precarious outlook. In September, ITB finally broke down and hit a 13-month low.
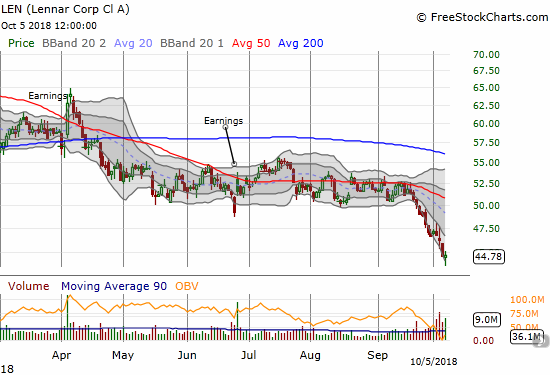
Last week, Lennar (LEN) reported earnings. As has been the pattern for home builders, traders and investors quickly faded any initially optimistic interpretation of the results. LEN traded as high as 2.1% before succumbing to the selling. Sellers followed through the next day.
Source for stock charts: FreeStockCharts.com
LEN now sits at a 29.0% year-to-date loss and a 1.1 price/book ratio, a 0.9 price/sales ratio, a forward P/E of 6.6, and a trailing P/E of 11.9. This valuation is extremely low!
New Residential Construction (Single-Family Housing Starts) – August, 2018
While housing starts surged in May and left no doubt that home builders were confident as ever, the subsequent plunge in housing starts in June appeared to temper that enthusiastic interpretation. Small increases in July and August seem to have stabilized things for now.
Single-family housing starts for July were revised slightly downward for a second month from 862,000 to 860,000. August starts increased month-over-month by 1.9% to 862,000, still barely off the lowest level of the year. On an annual basis, single-family housing starts decreased by 0.2%. Even though this decline is ever so slight, it is now the second month of the last three delivering a year-over-year decline. June’s year-over-year decline was the first for housing starts since August, 2016. I am now worrying even more that something important is indeed fundamentally changing in the housing market. These data look like a breakdown in slow motion.
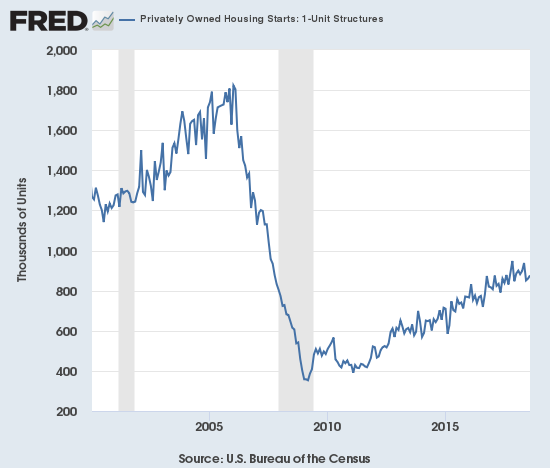
Source: US. Bureau of the Census, Privately Owned Housing Starts: 1-Unit Structures [HOUST1F], retrieved from FRED, Federal Reserve Bank of St. Louis, September 24, 2018.
Over the 8 months prior to May, regional year-over-year changes in starts exhibited wide dispersion. For May, housing starts were very strong across the board. For June, the Midwest stood out as a large loser. For July, the wide dispersion returned, and it continued in August. The Northeast, Midwest, South, and West each changed -11.8%, 0.0%, -1.7%, and +6.6% respectively. The bump up in July housing starts was less impressive than it appeared given it was mainly driven by the Midwest. For August, only a second month of gains for the West prevented housing starts from looking worse. Housing starts are almost certain to show a notable decline for September given damages from Hurricane Florence from Virginia to South Carolina.
Existing Home Sales – August, 2018
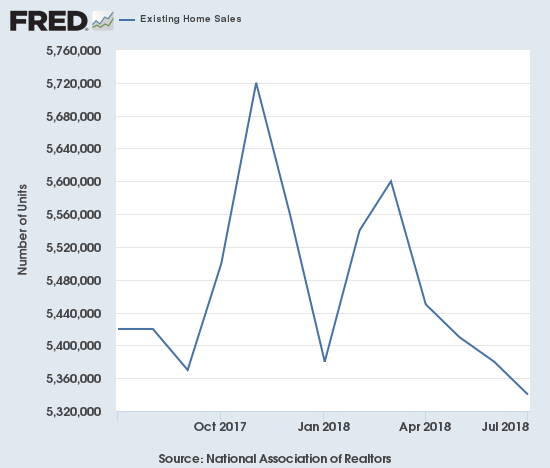
Existing home sales narrowly avoided a fifth straight month-over-month decline, but sales continued their year-over-year decline into a sixth straight month. The NAR chose to celebrate headlines about a stabilization of sales and the end of the decline, but I fail to see any confirmation of such optimism.
The February existing sales numbers ended a 2-month sales decline and softened a bit my alarm bells. In March, monthly sales continued to increase, but the year-over-year change was a decrease. For April, both monthly and year-over-year changes were declines. May recorded similar declines and put existing home sales right back in “yellow” cautionary territory. The June and July double whammies of monthly and annual declines put existing home sales in “red” territory. August’s continuation of year-over-year declines is enough to keep my mental indicator in red territory.
The seasonally adjusted annualized sales in August of 5.34M were flat month-over-month from the unrevised 5.34M in sales for July. Year-over-year sales decreased 1.5%, the same as July’s decline, and once again stayed consistent with the trend of decelerating existing home sales. Sales are down 1.2% year-over-year for the first 8 months of the year.
(As of the March, 2018 data, the NAR further reduced historical data to just 13 months. For historical data from 1999 to 2014, click here. For historical data from 2014 to 2018, click here)
Source for chart: National Association of Realtors, Existing Home Sales© [EXHOSLUSM495S], retrieved from FRED, Federal Reserve Bank of St. Louis, October 4, 2018.
The routine description for existing sales is usually sales decline because of a shortage of inventory and sales increase in spite of inventory shortages. Sales have not increased for months, so the National Association of Realtors (NAR) has bounced around various themes attempting to put the declines in context. For August’s data, the NAR chose to emphasize a stabilization in sales after a few months of “drip drip” down (from the press conference). I cannot join this optimism until I see sales turn upward again. I duly noted that the NAR did not include any discussions this time about particular markets which provide points of optimism.
The “cross-over” in June when inventory increased year-over-year for the first time since June, 2015 is no longer a one-time event. The 1.92M existing homes for sale is flat with July and is up 2.7% year-over-year. Despite the NAR’s celebration of the inventory increase as a sign buyers are ready to return to the market, the supply crisis continues to run deep at 4.3 months of supply at the current sales rate. This inventory level is the same as the 4.3 from the prior two months although up slightly from the 4.1 from a year ago.
The share of sales going to first-time buyers decreased from 32% last month to 31% this month. This share was 31% in June and May, 33% in April, 30% in March, 29% in February and November was 33%. So the share percentage continues to just bounce around. September, 2017 was the first time in two years where the share dropped below 30%.
The average share for first-time homebuyers for 2016 was 35%. The NAR’s 2017 Profile of Home Buyers and Sellers reported an average of 34% for 2017. Investors purchased 13% of homes in August, the same as the last two months. Investor sales averaged a share of 15% in 2017 and 14% in 2016.
Existing home sales decreased across three of four regions. The NAR’s focus on the month-over-month numbers did not tell the real story of continued decline – the West’s second consecutive substantial drop is particularly concerning: Northeast -2.7%, Midwest -0.8%, South 1.8%, West -7.4% year-over-year. As usual, regional sale fluctuations had no relationship to the on-going price run-ups. May’s price decline in the Northeast was a true outlier. The year-over-year price changes for August were again relatively robust: Northeast 2.6%, Midwest 3.4%, South 3.2%, West 4.8%. If not for the relatively steady first-time homebuyer numbers and recent sales declines in the West, I would have assumed that higher-end homes are increasingly dominating existing home sales.
August’s 4.6% year-over-year increase in the overall median price of an existing home delivered the 78th consecutive month with a year-over-year increase. The median price of $264,800 is lower than July’s $269,600 and the second consecutive month-over-month decline. June’s $276,900 was an all-time high, so I think the NAR’s optimism over four straight months of annual price gains below 5% is premature.
Single-family sales were flat on a monthly basis and decreased on a yearly basis by 1.0%. The median price of $267,300 was up 4.9% year-over-year (and yet one more reason not to join the NAR’s optimism about “slowing” price gains).
New Residential Sales (Single-Family) – August, 2018
In February, new home sales barely crept forward. New home sales were resurgent in March. April sales did not keep pace on a monthly basis but delivered a strong year-over-year performance. In an increasingly (and surprisingly!) stark contrast to existing home sales, new home sales from May to August have increased in each month on a year-over-year basis (after revisions, June just barely eked out an annual gain of 0.3%). The good news on new home sales failed to stem the on-going selling in home builders as interest rate fears continued to dominate the investment thesis. Moreover, new home sales are still well off a substantial peak in November, 2017. That peak was special because prior peaks in the post-recession recovery period occurred around the Spring selling season. November continues to look like an absolute and not just seasonal or cyclical peak until proven otherwise.
The Census Bureau revised July sales of new single-family homes downward from 638,000 to 608,000; four of the last five months have delivered sizable downward revisions. New home sales for August increased 3.5% month-over-month and surged 12.7% year-over-year to 629,000. Year-over-year gains regularly hit double digits since 2012; last November’s 26.6% jump was the highest since February, 2015 when new home sales soared 29.8% year-over-year. Accounting for revisions, August delivered 2018’s first double-digit annual gain. November and December’s double digit gains still stick out like a sore thumb.
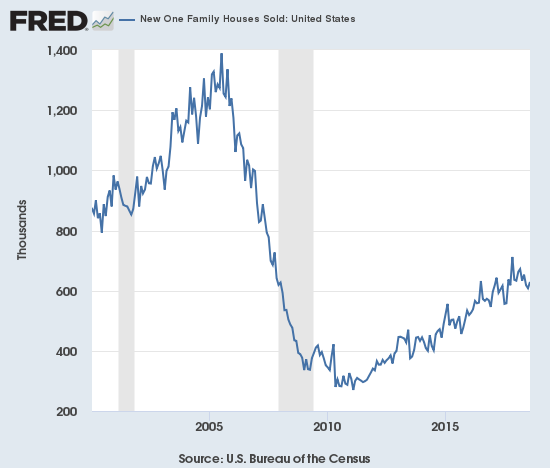
Source: US. Bureau of the Census, New One Family Houses Sold: United States [HSN1F], retrieved from FRED, Federal Reserve Bank of St. Louis, October 7, 2018.
In December, the inventory of new homes dropped to 5.2 months of supply. A market for homes is in balance at 6 months of supply. February’s inventory stood at 5.9 months. It proceeded to decline as low as 5.2 in May. For June, inventory jumped back up to 5.7 days of sales, and in July inventory effectively returned to balance at 5.9. August’s inventory stood at 6.1 months of supply. I will be interested to see whether new homes move too far to an over-supply condition as the inventory of existing homes slowly increases. An over-supply of new homes would detract from any optimism over higher supplies of existing homes.
May’s median price of $316,700 (revised) was an actual year-over-year decline. June delivered a second straight decline. July’s prices bounced back: the median price increased 1.6% (revised). August’s median price of $320,200 was a year-over-year increase of 1.9%. The average price increased 5.2%.
The Northeast was a notable laggard for the second straight month with a year-over-year sales decline of 2.9%. The other three regions all increased substantially again: Midwest 13.2%, South 11.5%, West 19.1%. The Northeast has been extremely volatile for many months now. While the Midwest and the South continued streaks of multi-month growth, the West’s gains come as a welcome bounceback from a 15.0% year-over-year drop in June (and another stark contrast to existing home sales where the West has suffered two straight months of notable annual declines).
Home Builder Confidence: The Housing Market Index – September, 2018
In the April housing market review, I explained why I would not have thought much of March’s slight decline in the Housing Market Index (HMI). At 70, the HMI was still higher than it was for most of 2017. For July, the HMI stayed at 68 for the second straight month. However, the HMI dropped another point in August and stayed at 67 for September. For the second straight month, the NAHB cleverly called 67 a “solid reading.” I remain circumspect about this reading given it is the low for 2018. The components of HMI are still languishing. Two factors exist that may allay alarm over 2018’s HMIs: 1) in 2017 the HMI was also slipping to a low around this time (September, 2017 was the nadir for last year at 64), 2) the 69.3 average HMI for 2018 is still higher than 2017’s average of 67.8.
The statement from the NAHB in May was very positive with a big caveat for rising prices. For June, the NAHB made an even bigger issue of lumber prices by shining a spotlight on trade actions that drove those prices higher. For August, the NAHB singled out the drivers of poor affordability. The latest statement was one of the stranger ones I have seen from the NAHB. The NAHB finally acknowledged the decline in lumber prices but seemed eager to increase the spotlight on other drivers of poor affordability: “…builders still need to manage construction costs to keep homes competitively priced. Wages and subcontractor payments continue to rise as the labor market for residential construction sector remains tight.” The NAHB later went on to suggest that trade problems are still driving material costs higher: “housing affordability is becoming a challenge, as builders face overly burdensome regulations and rising material costs exacerbated by an escalating trade skirmish.”
In between, the NAHB strained to be positive by noting strong housing demand from first-time home buyers including millennials. Finally, Hurricane Florence is apparently going to have a material impact on housing starts in Virginia and the Carolinas which together account for about 12% of the country’s home building.
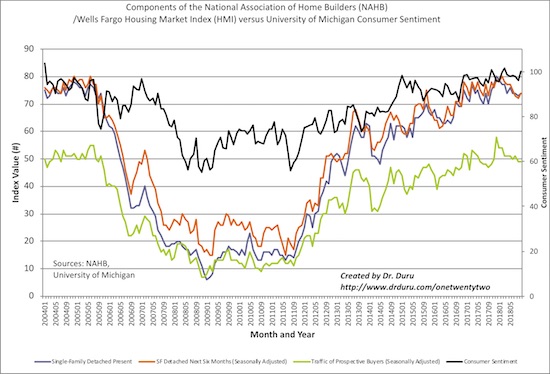
Source: NAHB
As a whole, the regional HMIs confirm the languishing nature of recent HMIs. The NAHB also made significant revisions to August’s regional readings. The Northeast soared 15 points off August’s significantly downward revised reading of 46. The revision means that the Northeast hit a 14-month low in August. The Midwest dropped for a fourth straight month. The 56 reading was the region’s lowest since a 53 in August, 2016. The South dropped back to its low of the year at 69. The West stayed flat at its low of the year of 73. The Northeast is now the only region above its low of the year.
Needless to say, home builder sentiment will be a key tell in the coming months. If the HMI does not begin a recovery in October, I will expect a poor start to the seasonally strong period for home builder stocks (November through March/April). Until then, home builder sentiment looks like a breakdown in slow motion.
Parting thoughts
With iShares US Home Construction ETF (ITB) sitting at a 13-month low, I am very tempted to bottom-fish. Home builders are incredibly cheap and priced for a recession in a macro environment with no other concrete signs of an imminent recession. I have watched various analysts on CNBC’s Fast Money try to pick bottoms to no avail. The latest attempt at a bottom may be the closest to success given the seasonally strong period for home builders begins in November.
For the second time in about a month or so, Carter Worth examined the technicals for home builders under the theme it is so bad it is good. Last time it was LEN; this time was ITB. Worth likes the full reversal of the big 2017 breakout as a key tell. He also likes how some major home builders, like Lennar, managed to eke out gains on Friday despite the market sell-off. Michael Khouw proposed an options configuration for playing Worth’s technical analysis. He decided to keep it simple going long January (2019) $34 call options.
Homebuilders just closed out their third week in the red, but @Michael_Khouw sees a building breakout. $ITB pic.twitter.com/fXqf5fO6bL
— Options Action (@OptionsAction) October 5, 2018
I like this as an initial play. However, the seasonal trade can extend as far as March and April, so I also like a calendar call spread selling November $34s and going long April $34s. As of Friday, the cost is roughly the same as Khouw’s play, but the calendar spread might allow staying in the trade for a longer duration. I particularly prefer the calendar spread because I see little short-term upside for ITB. If I am correct, the short side of the calendar spread could deteriorate fast enough to deliver profits for the calendar spread whereas the January calls would sit at a loss in a sideways scenario.
Be careful out there!
Full disclosure: long ITB calls