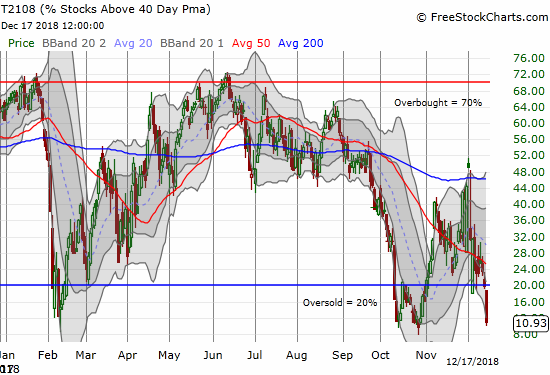
AT40 = 10.9% of stocks are trading above their respective 40-day moving averages (DMAs) (oversold day #2)
AT200 = 15.8% of stocks are trading above their respective 200DMAs (new 34-month low)
VIX = 24.5
Short-term Trading Call: bullish (caveats below!)
Commentary
The week started as I expected based on the technical setup on Friday that I discussed in the last Above the 40 post. The day itself was wilder than I expected, but I am not even sure why I continue to get surprised. The S&P 500 (SPY) sold off quickly in the first 15 minutes of trading. Gap buyers stepped in and managed to shove the index through the gap and into a fractional gain. The bear burden took over from there and unleashed nearly constant selling. A sharp bounce in the final 10 minutes of trading closed the S&P 500 with a 2.1% loss.
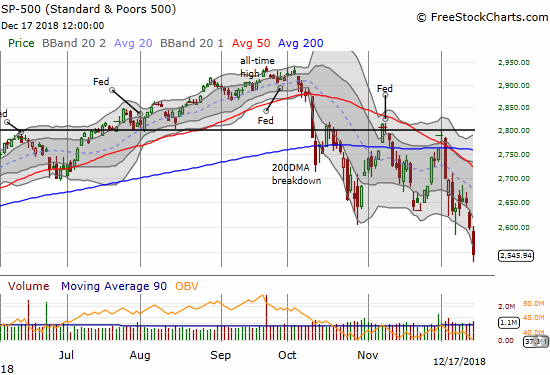
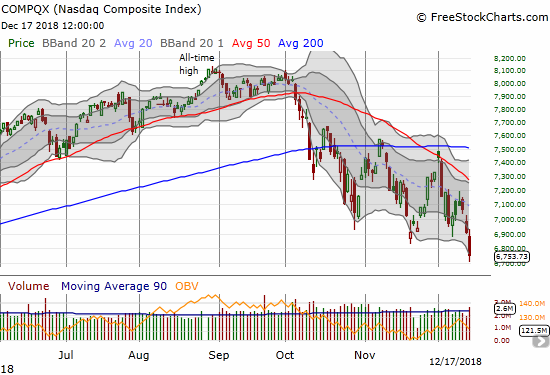
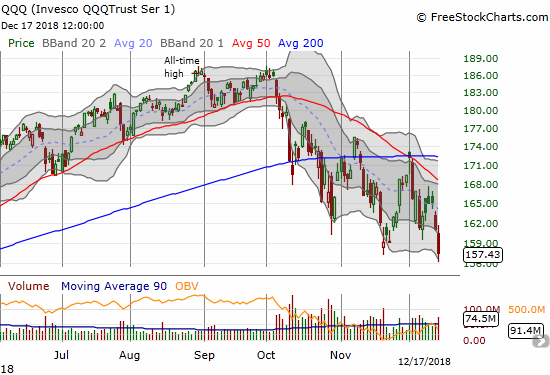
The NASDAQ and the Invesco QQQ Trust (QQQ) decisively took out their November lows. These tech-laden indices avoided the fate of the S&P 500 which set a new 2018 low.
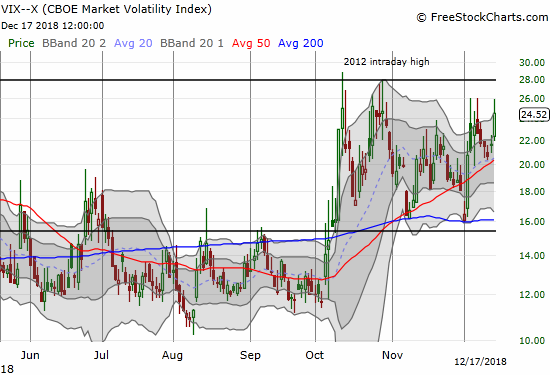
The volatility index, the VIX, finally delivered a strong gain of 13.4%. Still, the volatility faders were able to put a lid on the VIX right at 26, exactly where the fear gauge came to a halt twice during the early part of December. The robots left me unconvinced that the VIX is done going up. Maybe the Federal Reserve may save the day this week, but the VIX is “due” to at least test the highs from October’s sell-off if not blast completely through those levels.
The trading action allowed me to execute all my plans from the last Above the 40 post. The plunge in QQQ allowed me to take a healthy profit on my put spread (and of course I was left wishing I had the guts to buy all those puts outright). I was able to accumulate call options on the ProShares Ultra VIX Short-Term Futures (UVXY) before the big surge. I took profits on one call and held the other (with plans to sell on Tuesday). Netflix (NFLX) even rallied as much as 1% and gave me a cheaper entry point on a put which I sold later in the day (recall that NFLX is one of the stocks I target for fades on rallies). The spike in the VIX finally gave me the “green light” to start my oversold trading. I loaded up on shares of ProShares Ultra S&P500 (SSO) and accordingly dropped the “cautious” from my short-term bullish trading call.
The stock market is now deeply oversold. AT40 (T2108), the percentage of stocks trading above their respective 40-day moving averages (DMAs), plunged to 10.9%. The market is not quite at the single-digit low it reached at the peak of panic in October, but the near halving of AT40 sure looks violent enough to qualify for the beginning of a bottom, if not THE bottom for this latest cycle of selling.
AT200 (T2107), the percentage of stocks trading above their respective 200DMAs, dropped to a fresh 34-month low of 15.8% as the longer-term underpinnings of the market continue to deteriorate.
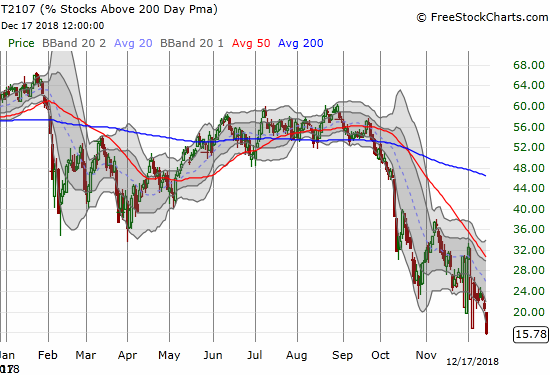
Neither AT40 nor AT200 can tell us anything new if they continue lower. What matters more now is the duration of the oversold period and the nature of the bounce OUT of oversold conditions. Most troubling about the above picture is AT200’s failure to recover nearly as well as AT40 did coming out of the last oversold period. With many 200DMAs now in decline, that kind of tepid bounce is a bearish sign for the longer-term outlook.
The Federal Reserve: Hero or Zero?
The Federal Reserve issues its next decision on monetary policy on Wednesday, December 19th. I have heard hopes that the Fed will decide to wait on hiking rates either during this meeting or after this meeting. The growing drumbeat of fear over tightening monetary policy is quite a turn of events from earlier in the year when most dismissed the impact of the Fed trickling rates higher from historically low levels. Those days were the tones from a bull market when bad news meant little except another buying opportunity. Now, the market is in bear market mode. Fear reigns and the search for hope is far-reaching. Here is an example of the argument for a halt to rate hikes from Jason Furman, the former Chair of the White House Counsel of Economic Advisers (click to watch in YouTube).
I think the calls for a pause in December are extreme. They certainly are way out of step with market expectations. The Fed Fund Futures are pricing in a 69.7% chance of a rate hike on Wednesday, almost exactly the same odds as a month ago with the stock market a little higher. So if the Fed decides to back down from a December rate hike, I think the market will come away with a negative interpretation: the Fed expects an economic slowdown. Why else would the Fed suddenly back down from a planned and well-anticipated rate hike? Granted, the current market sell-off might put enough fear in the Fed to take such an extreme measure.
So how about 2019?
I think most pundits at this point agree the Fed needs to take a pause after December and take time to reassess conditions. If the Fed hikes, most people are still expecting a capitulation in the form of very dovish Fed-speak about the go-forward plan. Incredibly, financial markets no longer expect ANY rate hike in 2019; exactly a month ago the odds favored June as the month to enjoy the first rate hike of 2019.
To read the table below recall that the current Fed funds rate is targeted at 2.0 to 2.25% (200-225 basis points). Assuming the Fed sticks to hikes of 25 basis points, then the next rate hike after December will target the 2.5 to 2.75% range. Those odds for that range NEVER go over 50% for the entirety of 2019! Calculate those odds by summing up the probabilities starting at the 250 to 275 column and going right. Technically, that sum represents the odds of the Fed at least hitting that target by the associated meeting date.
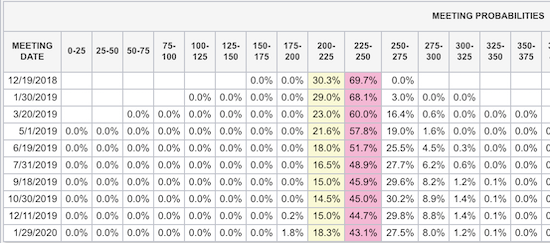
The Fed is officially trapped into going dovish in this coming meeting one way or another. If the Fed sticks by its to-date more hawkish tone, then it will face the wrath of an even more skittish market. Ironically, because the market is pricing in this dovish talk, any subsequent post-Fed rally will essentially be a sell-on-the-news moment and will usher in fears of an economic slowdown anyway. Fed Chair Jerome Powell will have to summon the verbal skills of a master orator!
CHART REVIEWS
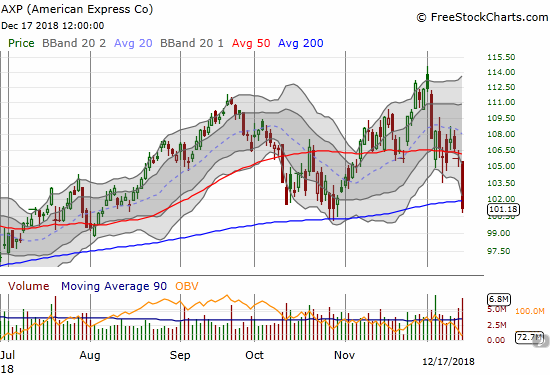
American Express (AXP)
AXP joined the growing majority of stocks trading below their respective 200DMAs. This support level held up like magic during the vicious market sell-off in October. The high-volume, high magnitude breakdown is bearish for AXP. I expect 50DMA resistance to hold on the next bounce.
Walmart (WMT)
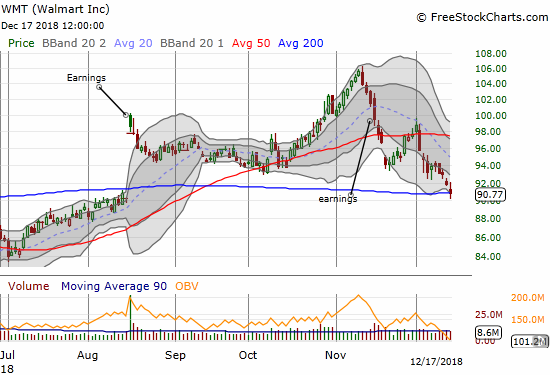
WMT is VERY tempting here. The stock finally finished reversing its gains that began with large post-earnings gap up in August. WMT was wonderfully contrarian throughout October, but it peaked in November short of its all-time high set in January. Now, WMT is clinging to the top 15.8% of stocks still trading above their respective 200DMAs.
Bitcoin (BTC/USD)
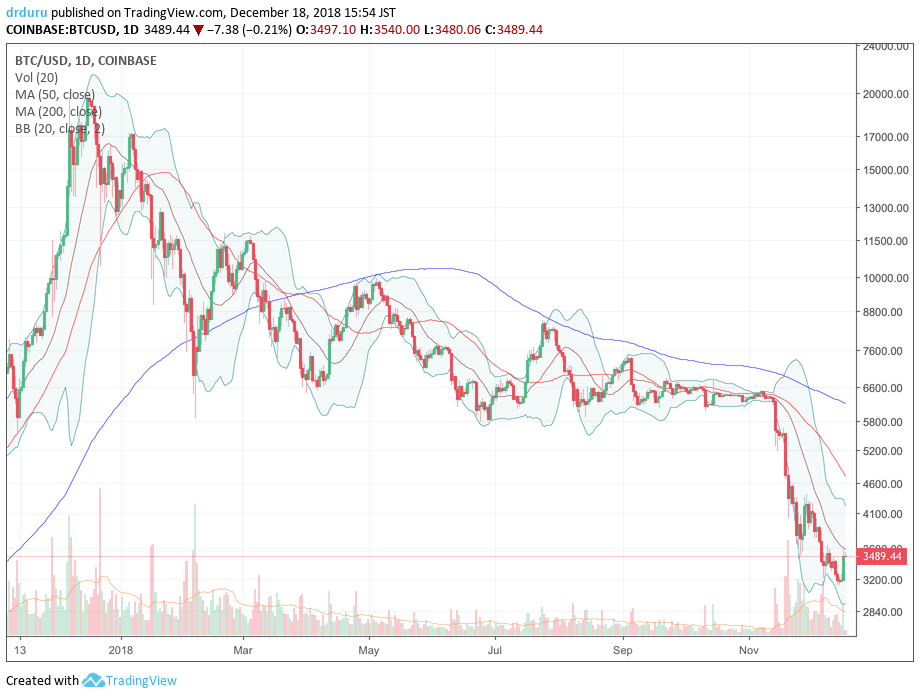
When we look back on this era, I think Bitcoin will be one of many signposts for the end of the super easy money era ushered in by the financial crisis. Cryptocurrencies were fueled by what seemed like unbounded enthusiasm and “market caps” that gained billions like the weight of participants in a pie eating contest. That unbounded enthusiasm has almost been drained out of the system, leaving mainly the die-hard advocates to keep up the fight for relevancy outside their specialized world.
For example, it seems that CNBC’s Fast Money is FINALLY winding down its unabashed love of cryptocurrencies. In Monday’s show, Fast Money rewound the tape on all the Bitcoin bulls who a year ago pulled out their rulers and extrapolated out astronomical prices for the end of 2018. In the following segment, host Melissa Lee barely disguises her deepening skepticism as a crypto permabull (Spencer Bogart from Blockchain Capital) repeats a familiar refrain during the current crash: current prices actually do not matter because the long-term is bright, a rebound is inevitable and even around the corner, and the technology is making fantastic advances. I duly noted that Spencer distanced Bitcoin from the fundamentals which bind early-stage companies to rational (traditional) pricing mechanisms; I read this to mean that Bitcoin can and will take on any price market participants chose.
It’s been a wild year for bitcoin down 82% from its highs, but @CremeDeLaCrypto is still betting on a comeback for the cryptocurrency pic.twitter.com/07Qog8xdAe
— CNBC’s Fast Money (@CNBCFastMoney) December 17, 2018
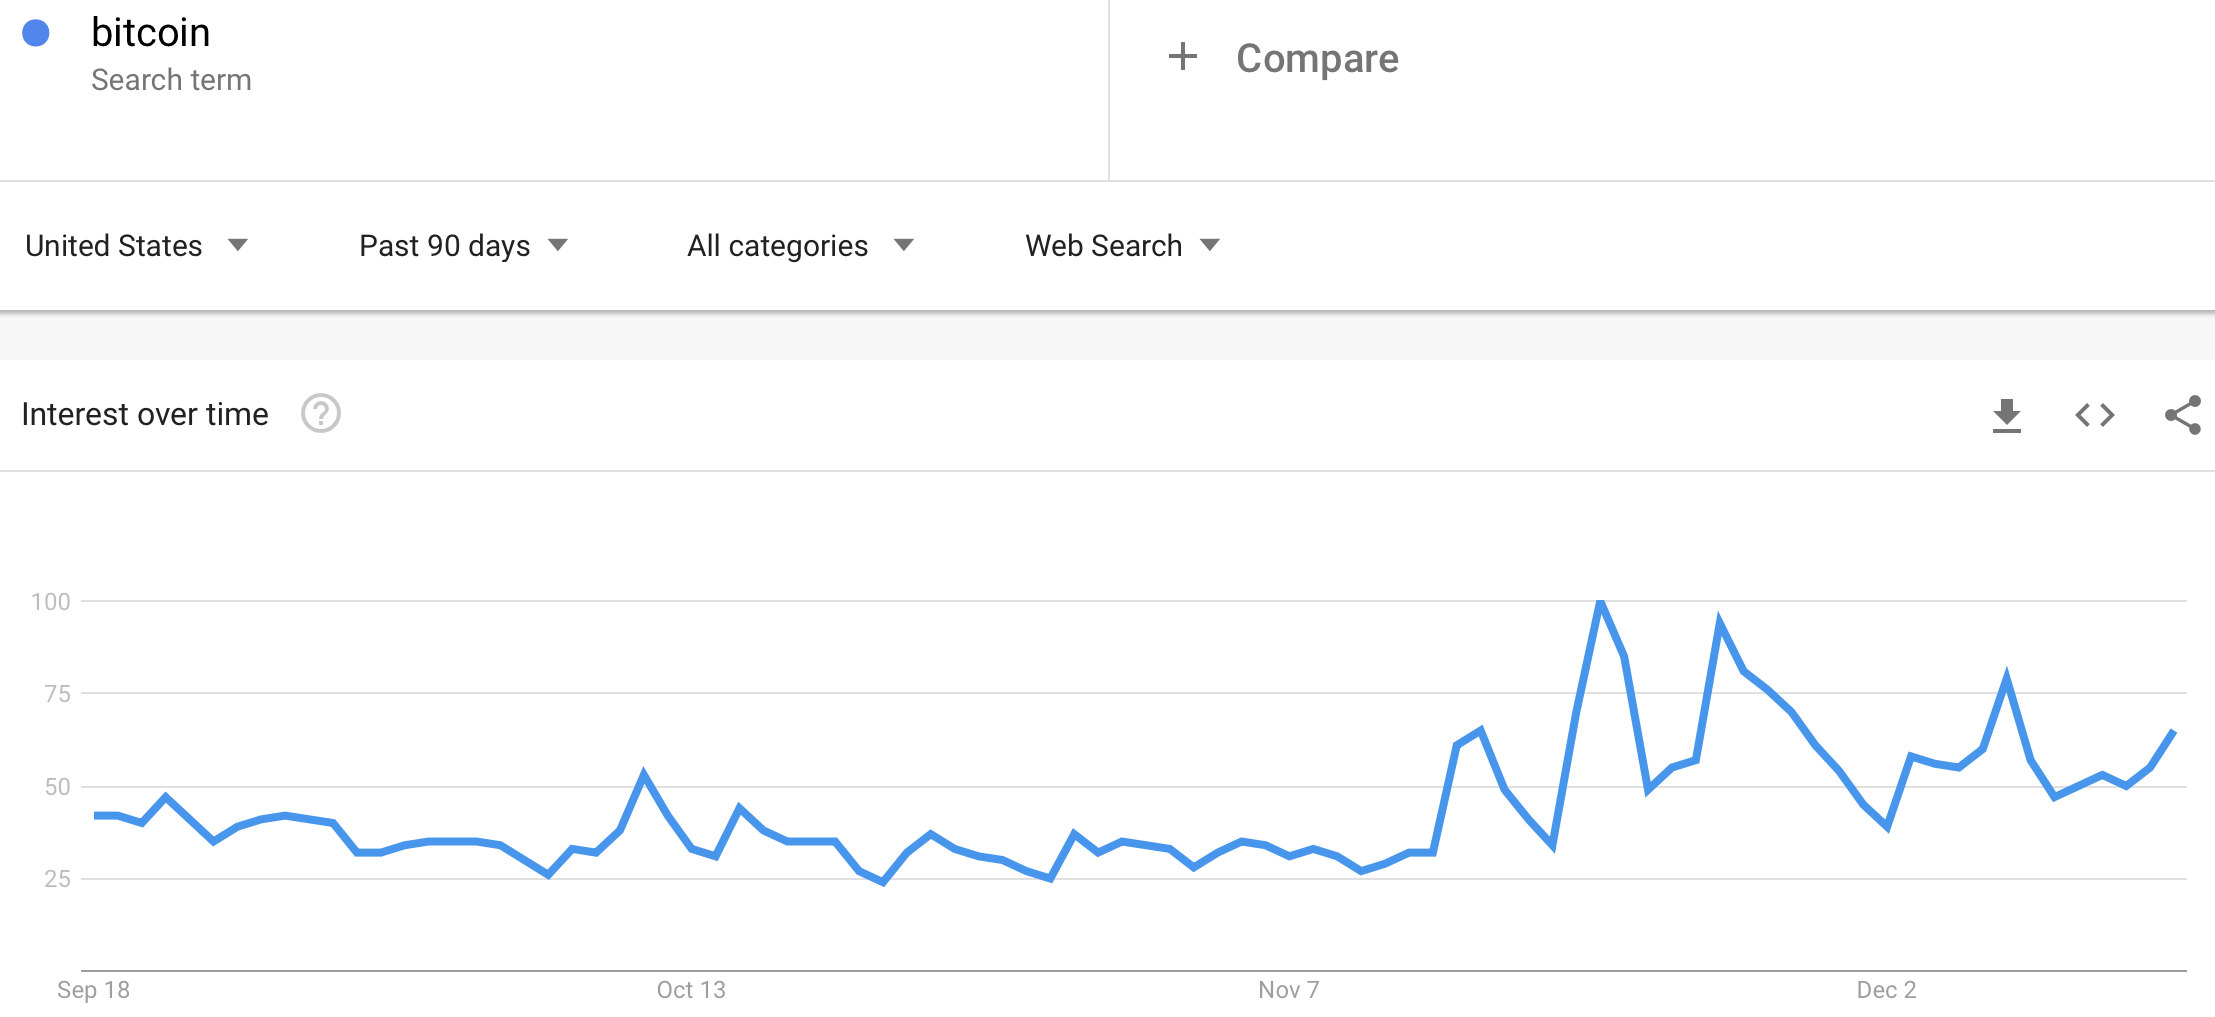
NOW I am a bit more interested in Bitcoin (and other cryptos) than I have ever been. I am still nowhere close to buying, but I am encouraged by the accumulating signs that the mania phase of crypto and blockchain looks like it is finally waning. Recent Google search trends are also notable. The recent bump in interest is still tiny compared to the massive surge at the peak, but the recent rise is still being sustained during the current price extreme. As a reminder, the running hypothesis is that a jump in Google search trends at a price extreme marks the imminent end of that price extreme…in this case, a sustainable or at least tradable bottom is taking shape if the hypothesis remains correct.
Source: TradingView
Source: Google Trends
— – —
FOLLOW Dr. Duru’s commentary on financial markets via email, StockTwits, Twitter, and even Instagram!
“Above the 40” uses the percentage of stocks trading above their respective 40-day moving averages (DMAs) to assess the technical health of the stock market and to identify extremes in market sentiment that are likely to reverse. Abbreviated as AT40, Above the 40 is an alternative label for “T2108” which was created by Worden. Learn more about T2108 on my T2108 Resource Page. AT200, or T2107, measures the percentage of stocks trading above their respective 200DMAs.
Active AT40 (T2108) periods: Day #2 under 20% (2nd oversold day), Day #7 under 30%, Day #9 under 40%, Day #59 under 50%, Day #75 under 60%, Day #130 under 70% {corrected 1/6/19}
Daily AT40 (T2108)

Black line: AT40 (T2108) (% measured on the right)
Red line: Overbought threshold (70%); Blue line: Oversold threshold (20%)
Weekly AT40 (T2108)

*All charts created using freestockcharts.com unless otherwise stated
The T2108 charts above are my LATEST updates independent of the date of this given AT40 post. For my latest AT40 post click here.
Related links:
The AT40 (T2108) Resource Page
You can follow real-time T2108 commentary on twitter using the #T2108 or #AT40 hashtags. T2108-related trades and other trades are occasionally posted on twitter using the #120trade hashtag.
Be careful out there!
Full disclosure: long SSO, long UVXY call
*Charting notes: FreeStockCharts.com stock prices are not adjusted for dividends. TradingView.com charts for currencies use Tokyo time as the start of the forex trading day. FreeStockCharts.com currency charts are based on Eastern U.S. time to define the trading day.
