
The last Housing Market Review covered data reported in July, 2017 for June, 2017. The month from there marked a significant change in tone for home builders. The change in tone starts with the iShares U.S. Home Construction ETF (ITB) and its failure to hold support at its 50-day moving average (DMA) for the first time since its last such breakdown a year ago. Indeed, part of the seasonal trade in home builders revolves around changes in the summer. Various charts on home builders have me on alert for a more significant sell-off ahead.
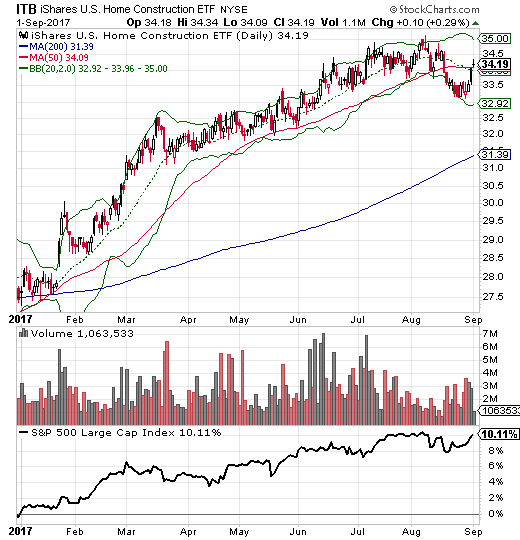
Source: StockCharts
(Note the bottom of the chart shows ITB’s performance relative to the S&P 500 (SPY) from the beginning of the chart).
One key highlight of the month for me was the poor post-earnings reaction to Toll Brothers (TOL). Last month, TOL almost became a lowlight. Shortly after the last Housing Market Review, TOL broke down below its 50DMA two more times. I finally had enough and sold on the second breakdown and ahead of earnings. That sale seemed validated by the poor response to earnings. Yet, TOL ended the week with a full post-earnings recovery and a retest of its 50DMA. Still, I will not venture back until the seasonal trade on home builders revs back up in October or November.
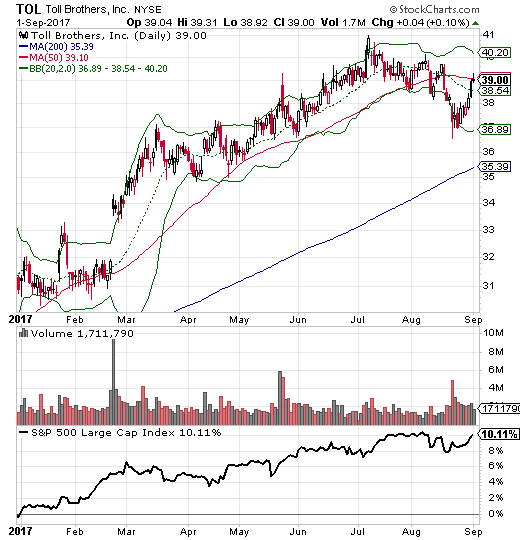
Source: StockCharts
Another highlight was the spectacular post-earnings performance of Invitation Homes (INVH). I have touted this company and its stock since its IPO. INVH is now up about 16% from its IPO this year. (Chart not shown due to disfunction in charting tools).
In the last Housing Market Review, I pointed to KBH Home (KBH) as an “imminent lowlight.” Not only did I lose money on the small number of call options I purchased, but KBH itself now looks more bearish than it has looked in a long time. Like ITB and TOL, KBH broke down below its 50DMA in August. Unlike the two, KBH confirmed its 50DMA breakdown as it spent half the month sliding down its lower-Bollinger Band (BB). KBH is still up substantially this year, but looks like it has topped out given the full reversal from its last earnings report in late June. This month’s earnings report will be a key tell; interestingly, recent data show that KBH’s key markets in the West are likely doing quite well.
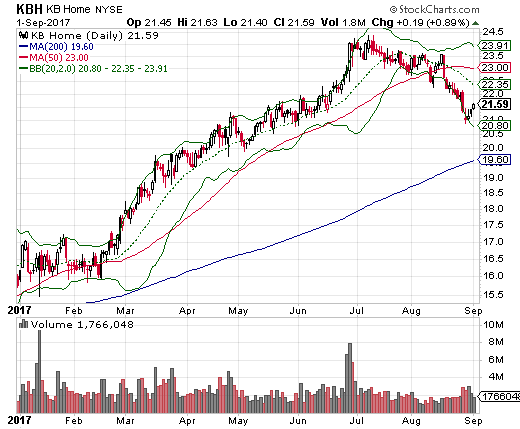
Source: StockCharts
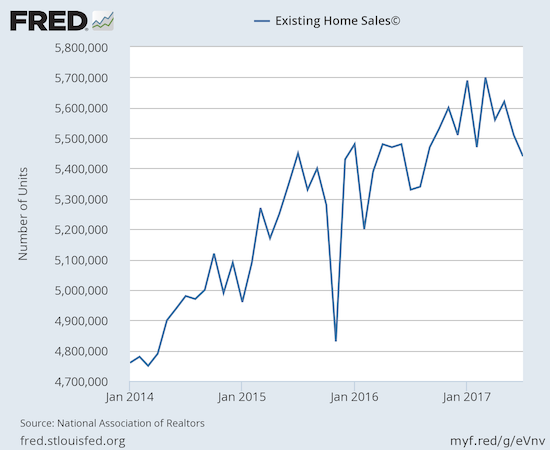
The change in tone in the trading of the stocks of home builders mirrors a slight change in tone in the housing market data. Housing starts increased again and match the resurgence of forward-looking optimism of home builders (as seen in the sentiment indicator in the Housing Market Index). Yet, the recent decline in new home sales threatens a years-long uptrend. Existing home sales have likely confirmed a top for the year even as prices continue climbing robustly and sales are up from a year ago.
New Residential Construction (Housing Starts) – July, 2017
After three months of monthly declines, housing starts finally increased in June. Housing starts declined again for July but the market’s response was very muted this time…and for good reason.
Single-family housing starts for June were revised upward from 849,000 to 860,000. July starts decreased month-over-month by 0.5% to 856,000. This small change did not make a dent with the on-going uptrend. On an annual basis, single-family housing starts increased a healthy 10.9%, similar to last month’s 10.3% year-over-year jump. The first seven months of 2017 have delivered close to and above double-digit percentage gains meaning that the uptrend remains well intact.
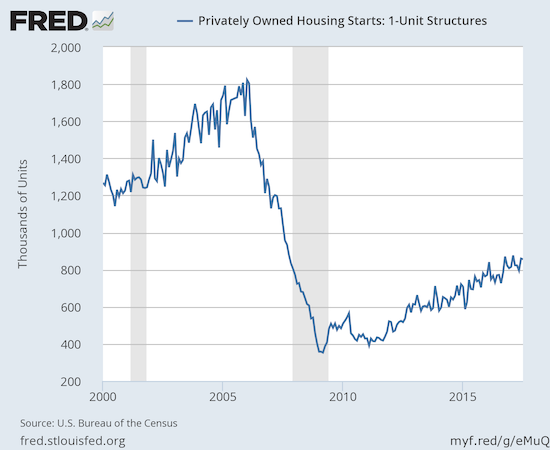
Source: US. Bureau of the Census, Privately Owned Housing Starts: 1-Unit Structures [HOUST1F], retrieved from FRED, Federal Reserve Bank of St. Louis, July 19, 2017.
After three months of wide deviations, the regional changes were more uniform for June and even more so for July. The Northeast, Midwest, South, and West each jumped 13.6%, 16.7%, 8.2%, and 12.9% respectively. The Northeast made a major recovery from June’s year-over-year 19.2% decrease. The West cooled down from a 2-month streak of 22% year-over-year gains.
Existing Home Sales – July, 2017
Again, regular readers should know the routine with the report on existing sales: sales decline because of a shortage of inventory and sales increase in spite of inventory shortages. For July, 2017, sales declined on a monthly basis but still increased on an annual basis.
For January 2017, existing home sales hit levels not seen since February, 2007. For February 2017, existing home sales dropped sharply from the previous month’s post-recession high and served up a reminder of the month-to-month volatility in this series. For March, existing home sales made a sharp rebound and set a new post-recession high (the highest in over 10 years). Sales since have gone up and down like a yo-yo, but July’s decline may have confirmed a top for now as they hit a low for the year. The NAR commentary reflected upon the frustrations of buyers who are paying more for less:
“Buyer interest in most of the country has held up strongly this summer and homes are selling fast, but the negative effect of not enough inventory to choose from and its pressure on overall affordability put the brakes on what should’ve been a higher sales pace…Home prices are still rising above incomes and way too fast in many markets…Realtors® continue to say prospective buyers are frustrated by how quickly prices are rising for the minimal selection of homes that fit buyers’ budget and wish list.”
The seasonally adjusted annualized sales of 5.44M were down 1.3% month-over-month from 5.51M in sales for June (revised down from 5.62M). Sales have declined 3 of the last 4 months. Year-over-year sales still increased 2.1% (compare to the steady stream of year-over-year increases: November 15.4%, December 0.7%, January 3.8%, February 5.4%, March 5.9%, April 1.6%, May 2.7%, June 0.7%). Despite the year-over-year increase, July’s existing home sales broke the uptrend in place since early 2014; another reason why I think sales have topped out for now.
(recall that the NAR no longer makes data available before 2013. For more historical data to 1999 click here)
Source: National Association of Realtors, Existing Home Sales© [EXHOSLUSM495S], retrieved from FRED, Federal Reserve Bank of St. Louis, September 1, 2017.
First-time buyers nudged to May’s level of 33%, up from June’s 32%. This share has essentially been stuck in the low 30s all year. The average for 2016 was 35%. I am not surprised that the NAR lamented:
The absolute level of inventory of existing homes has fallen year-over-year for a startling 26 straight months. Recall that during the June press conference, the NAR talked about a housing crisis in supply in some housing markets. The 1.92M homes for sale represented a 9.0% decrease from the previous July. The string of year-over-year declines has been remarkable: August -10.1%, September -6.8%, October -4.3%, November -9.3%, December -6.3%, January -7.1%, February -6.4%, March -6.6%, April -9.0%, May -8.4%, and June -7.1%. This translates into markets where homes do not stay on the market for long:
“July was the fourth consecutive month that the typical listing went under contract in under one month…This speaks to the significant pent-up demand for buying rather than any perceived loss of interest.”
The 27 days that homes stayed on the market in May was the lowest level since the NAR started tracking these data in May 2011. In July, homes “typically stayed on the market for 30 days.” In June, this number was 28 days, and a year ago it was 36 days.
In December, inventory hit a new absolute low measured from 1999 when the NAR began tracking. At 4.2 months of sales, relative inventory decreased from June’s 4.3 months and was down from the 4.8 months a year ago. In December, inventory was at 3.6 months of sales.
Investors purchased 13% of existing homes in July, same as in June. A year ago, investors bought 11% of existing homes for sale. As I note every month, investor appetite is far from satiated.
For July, the regional performances were exactly split between the bad and the good: Northeast -1.5% (and a whopping 14% decline from June), Midwest -1.6%, South +3.6%, West +5.0%. All regions logged year-over-year price jumps, whether sales were up or down: Northeast 4.1%, Midwest 5.9%, South 6.7%, West 7.6%. The price surges in the South and West make the strong annual sales increases in recent months in those regions even more impressive given the NAR has a habit of blaming high prices for lower sales in the national numbers.
July’s 6.2% year-over-year increase in the overall median price of an existing home represents the 65th consecutive month of year-over-year increases. The median price of $258,800 fell off a new record set in June but is still above the previous record set in May of $252,800. The NAR appeared startled by May’s price surge and issued an alarm. That alarm seemed to grow in July as the NAR used the press conference to dismiss the notion of a housing bubble. August’s press conference did not revisit these themes but bemoaned the on-going inventory problem.
Single-family sales decreased on a monthly basis (0.8%) and increased on a yearly basis by 1.7%. The median price of $260,600 ends four straight months of monthly gains. The median price was still up a very healthy 6.3% year-over-year; the past three months have delivered similar year-over-year gains.
“Single-family home sales decreased 0.8 percent to a seasonally adjusted annual rate of 4.84 million in July from 4.88 million in June, but are still 1.7 percent above the 4.76 million pace a year ago. The median existing single-family home price was $260,600 in July, up 6.3 percent from July 2016.”
New Residential Sales – July, 2017
Gains in new single-family home sales for May cooled down the near panic over the three straight months of decline in housing construction. Unfortunately, sales took a particularly large plunge in July that threatens to break the years-long uptrend.
The Census Bureau revised June sales of new single-family homes upward from 610,000 to 630,000. New home sales for July dropped 9.4% month-over-month and 8.9% year-over-year to 571,000. An unusual spike in sales last July exaggerated the plunge this July as previous July’s have experienced sizable declines. Still, this year’s July drop may help imperil the uptrend in place since the housing market trough.
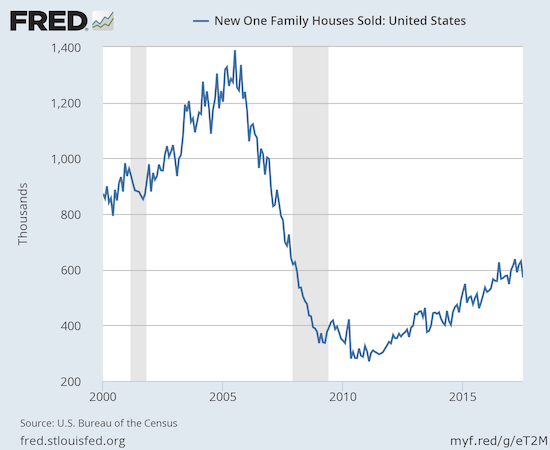
Source: US. Bureau of the Census, New One Family Houses Sold: United States [HSN1F], retrieved from FRED, Federal Reserve Bank of St. Louis, August 28, 2017.
New home inventory increased from 5.4 to 5.8 months of supply. This level continues to sit in (surprisingly) sharp contrast with the much more scarce inventory of existing homes. A market for homes is in balance at 6 months of supply.
Unlike previous months, new home sales exhibited near uniformity across the regions. The Northeast, Midwest, and the South each saw sales decline year-over-year by double-digits: -13.5, -12.7%, and -11.7% respectively. The West managed to eke out a 1.4% increase. This twist in the numbers makes my previous wary and watchful eye on sales in the West particularly ironic.
After May’s notable changes in the distribution of sales by sales price, I decided to watch more closely for trends in pricier homes. Homes priced from $200,000 to $299,999 bounced back while share in the pricier $300,000 to $399,999 and $400,000 to $499,999 ranges fell notably. It was good to see the sales in the median range bounce back as they represent the more typical home buyers and entry level families in many regions of the country. Homes sold in the $500,000 to $749,999 range jumped back to 8% share which is a tie for the highest level in at least a year. I concluded last month that, overall, these changes in share meant there was not yet some new trend toward pricier homes.
July’s sales further cooled the notion of a trend toward pricier homes. In July the $200,000 to $299,999 emptied out from a 36% to a 31% share. Cheaper homes were a large beneficiary. While homes priced under $150,000 dropped in share from 3% to 2%, the $150,000 to $199,999 range jumped from a share of 9% to 14%, a share unseen since October, 2016. The absolute number of homes sold increased about 50%. The next two price ranges above the mid-range increased share by one percentage point. The $500,000 to $749,999 range dropped from 14 to 12%. The most expensive homes, $750,000 and above, increased share from 2 to 3%. In other words, there was a general shift away from the middle. I am tempted to think of growth in share for the lower price range as a part of a rush of entry-level buyers but previous spikes toward these levels have been short-lived. I will continue to monitor the changes in the price ranges in case a trend does develop from the current changes.
Home Builder Confidence: The Housing Market Index– August, 2017
In March, builder confidence soared to a new 12-year high at 71. The HMI remains stalled just under that 12-year high. April dropped to 68, May increased just a point to 69, June dropped to 66, July dropped further to 64, and August surged ahead 4 points to 68. The National Association of Home Builders (NAHB) turned on the cheer to explain the results: “Our members are encouraged by rising demand in the new-home market…This is due to ongoing job and economic growth, attractive mortgage rates, and growing consumer confidence.”
The NAHB reiterated concerns focused on the rising costs faced by builders:
“…builders continue to face supply-side challenges, such as lot and labor shortages and rising building material costs.”
As a reminder for comparison, here are the concerns stated in the June HMI:
“As the housing market strengthens and more buyers enter the market, builders continue to express their frustration over an ongoing shortage of skilled labor and buildable lots that is impeding stronger growth in the single-family sector.”
Even with the pop in August, my earlier expectation for a new post-recession high at some point this year is still fading. Builder expectations for the next 6 months returned to its 12-year high and led the HMI higher. So forward-looking optimism will need to break out of its tight range for this year in order to get HMI to that new post-recession high.
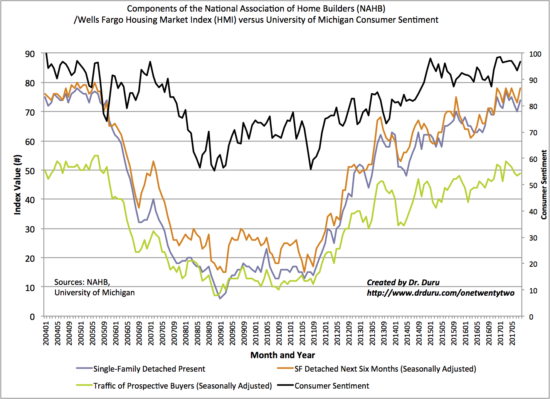
Source: NAHB
For May and June, there was an interesting disparity in the regional changes in HMI. In May, the West finally broke out from the flatline of the previous 4 months with a 80 reading. The West plunged in June back to 71 to a near 1-year low. For July, the West increased to 74 and for August it came within 1 month of of the high in May. The South made the most improvement with an over 10% pop back to within 1 point of the year’s high of 71. Maybe, just maybe, there is enough momentum to get the entire HMI to that fresh post-recession high. It will take optimism and regional strength to pave the way.
Parting thoughts
I began this review using the charts of ITB, TOL, and KBH as indicators of a change in tone in the stocks of home builders. Here are a few more:
- M.D.C. Holdings, Inc. (MDC) – which I earlier held out as a freshly bullish stock but has since broken down below 50DMA support.
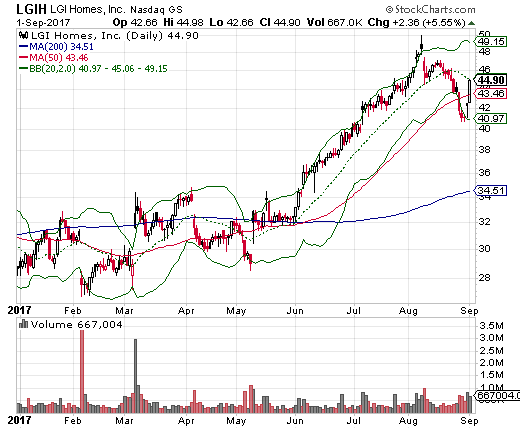
- LGI Homes, Inc. (LGIH) – which broke down dramatically in the wake of Hurricane Harvey the severe storm system that battered Texas and Louisiana. LGIH soared 10% in the last two days, presumably with investors and traders recognizing the over-reaction.
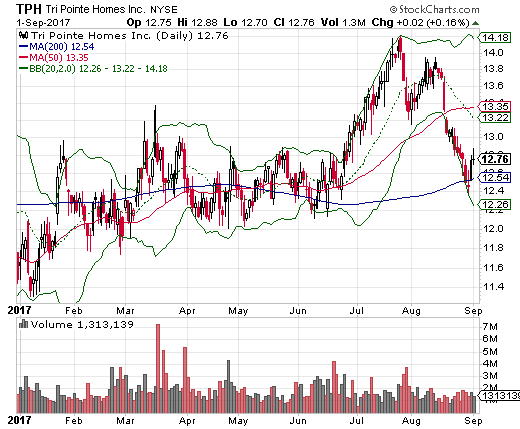
- Tri Pointe Homes (TPH) – which has yet to recover from its own 50DMA breakdown.
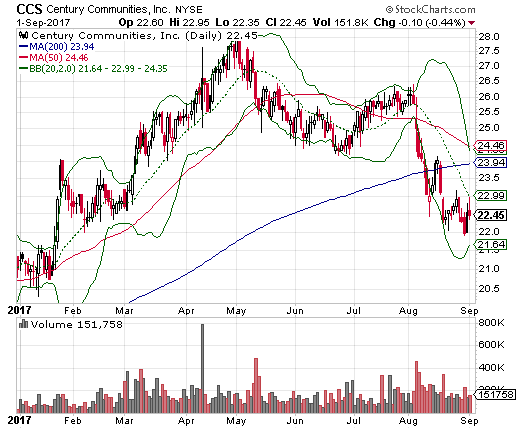
- Century Communities (CCS) – which I had to abandon in June just three months after touting its attractiveness as growth for a cheap price. CCS will still be at the top of my shopping list when the time comes to reload on home builder stocks.
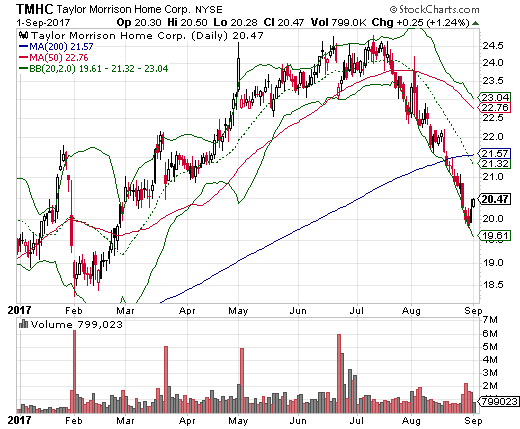
- Taylor Community Home Corp. (TMHC) – which I do not follow much but is striking given its 50 and 200DMA breakdowns.
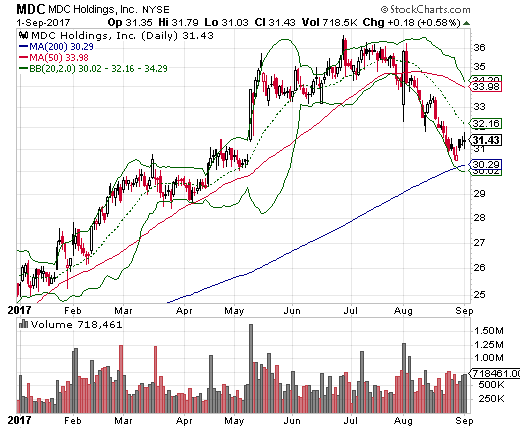
Source: StockCharts
Another housing-related stock has caught my eye once again: Zillow Group (ZG). Zillow provides housing listings and data and analysis on the housing market. ZG made an impressive breakout in April/May, but, as with so many other housing-related stocks, August proved to be a turning point. Despite hiking revenue guidance for its third quarter and the full fiscal year, ZG tumbled and broke down. The selling was vigorous enough to complete a reversal of the gains from the breakout and force a test of 200DMA support.
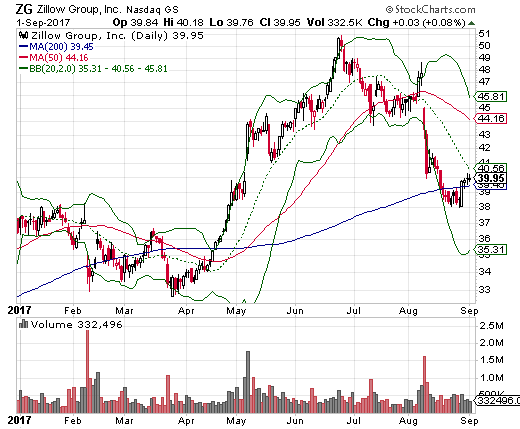
Source: StockCharts
On the positive side of August’s tone, Starwood Waypoint Homes (SFR), a stock I pointed out in the last Housing Market Review, soared to new all-time heights in August. SFR is riding the same momentum in home rentals as INVH.
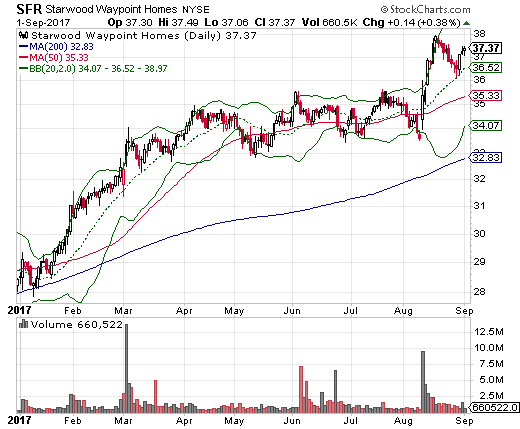
Source: StockCharts
Finally, the housing crisis in California, the San Francisco Bay Area in particular, is grabbing an increasing amount of my attention. Stories abound of working people living in cars, vans, and mini-RVs – what I call the “mobile homeless.” Here is a particularly poignant story about a mobile homeless San Jose State professor whose husband is unemployed. She reveals how the mobile homeless cope by sneaking into neighborhoods at night and keeping possessions at a minimum.
Unfortunately, housing supply, including rentals, is so tight in the Bay Area, that raising salaries is not even a sufficient solution. More money in people’s pockets just means higher demand on the same limited vacancies. In other words, more price hikes and still the same number of people left homeless.
There are several initiatives attempting to make a dent in the supply problem, especially for “affordable” housing. Recently, mayors of California’s seven largest cities went to Sacramento to lobby for a series of related measures.
- A $4B bond to build housing for the homeless, seniors, and veterans. No doubt the target population was strategically created to increase the chances of passing.
- Streamline permitting to make it harder for cities to say “no” to new housing developments. This not-in-my-backyard (NIMBY) syndrome is rampant in California where so many want to shut the doors behind them once they get their own piece of the pie.
- New fees on real estate transactions to fund housing initiatives.
While the SF Bay Area is a highly publicized example of a growing housing crisis, there are other cities scrambling to accommodate growth. I was amazed to find talk of a real estate bubble in Nashville, Tennessee of all places. Nashville seems to have plenty of land for building, the demand is just so great that builders simply cannot move fast enough. While I have yet to understand the specific drivers of economic growth here, the soaring prices of real estate in certain areas are plenty educational!
Be careful out there!
Full disclosure: long TPH, INVH