
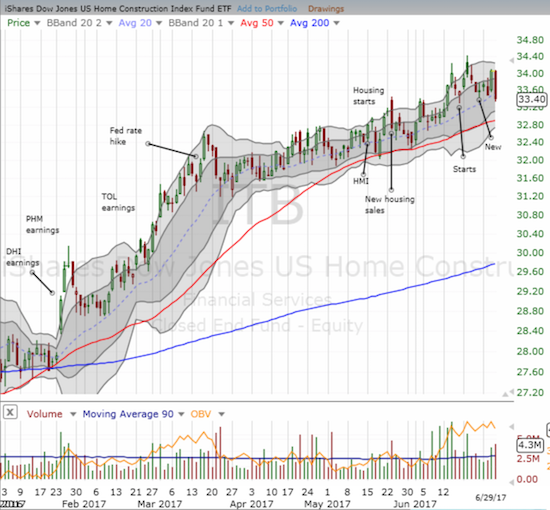
The last Housing Market Review covered data reported in May, 2017 for April, 2017. At that time, the iShares US Home Construction (ITB) was testing support at its uptrending 50-day moving average (DMA) for the third time in May. ITB bounced nicely from there, but it just suffered its second largest one-day loss of the year. Only the 2.3% one-day loss on May 17, 2017 surpassed the 1.9% loss on June 29th.
Source: FreeStockCharts.com
The good news is that ITB recovered quickly from May’s loss. The bad news is that the end of the seasonally strong period for home builder stocks means that it will likely be much harder for ITB to overcome this latest headwind.
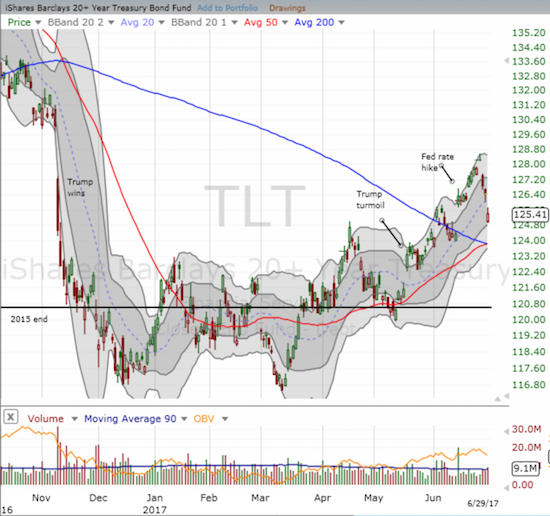
I am assuming a big driver of the sudden loss was a combination of a large sell-off in the general market – the S&P 500 (SPY) lost 0.9% and at one point was down 1.4% – and a sudden spike in long-term interest rates. For example, the iShares 20+ Year Treasury Bond (TLT) lost 0.8% after bouncing back slightly from a large gap down (TLT declines when rates increase and vice versa).
Source: FreeStockCharts.com
I have recently accumulated call options on TLT simply because of its recent uptrend despite the Fed rate hikes and the official acknowledgement that the Fed’s balance sheet will soon start shrinking. If rates actually start trending upward again, I have to assume that ITB will have an even harder time gaining ground on top of the end of the seasonal tailwind.
The housing data was overall more of the same. While housing starts spooked some housing pundits, strong new and existing home sales quickly put to rest the notion that the housing market was right on the edge of a cliff. Watching the headlines play out reminded me that when it comes to the housing market, an on-going tension exists where too many are looking for even the slightest hint that the entire market is about to collapse overnight…one more legacy of the massive housing bubble and crash from the last cycle.
New Residential Construction (Housing Starts) – May, 2017
“We need more home construction.” This was the plea from the National Association of Realtors (NAR) during its report on May existing home sales. Unfortunately, home builders went in the opposite direction for a third month in a row.
Single-family housing starts for April were revised downward from 835,000 to 826,000. Still, May starts declined month-over-month by 3.9% to 794,000. This change did not break the on-going uptrend, but it still caused a lot of consternation by pundits given it was the third monthly decline. Yet, on an annual basis, single-family housing starts increased a healthy 8.5%. This is a small decline from last month’s year-over year gain of 8.8%. The previous year-over-year increases were 11.1% in January, 13.5% in February, and 9.3% in March.
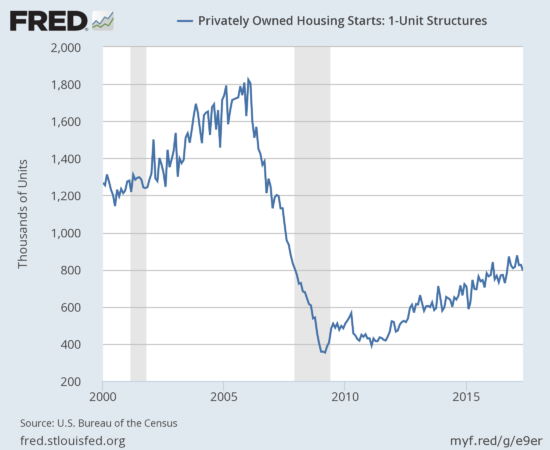
Source: US. Bureau of the Census, Privately Owned Housing Starts: 1-Unit Structures [HOUST1F], retrieved from FRED, Federal Reserve Bank of St. Louis, June 19, 2017.
Across the regions starts varied widely for a third month in a row with the Midwest and the West contributing large surges of 29.0% and 22.2% year-over-year respectively. The Northeast cooled for a second month in a row with a 3.6% decrease. The South barely budged with a 0.5% decrease.
Existing Home Sales – May, 2017
For January, existing home sales returned to gains and hit levels not seen since February, 2007. For February, existing home sales dropped sharply from the previous month’s post-recession high and served up a reminder of the month-to-month volatility in this series. For March, existing home sales made a sharp rebound and set a new post-recession high (the highest in over 10 years). For April, the yo-yo bounced down slightly, and in May it bounced up slightly. On cue, the NAR switched to explaining the uptick in sales:
“The job market in most of the country is healthy and the recent downward trend in mortgage rates continues to keep buyer interest at a robust level…Listings in the affordable price range are scarce, homes are coming off the market at an extremely fast pace and the prevalence of multiple offers in some markets are pushing prices higher.”
The seasonally adjusted annualized sales of 5.62M were up 1.1% month-over-month from a marginally downwardly revised 5.56M (from 5.57M) in sales for April. Year-over-year sales still increased 2.7% (compare to November’s 15.4% year-over-year pop, December’s 0.7% increase, January’s 3.8% rise, February’s 5.4% increase, March’s 5.9% gain, and April’s 1.6% increase). February sales dropped to levels last seen September, 2016 while March sales jumped to levels last seen February, 2007. April and May sales seem to indicate levels will stay around 10-year highs for a while although one could reasonably argue that the recent uptrend remains well in place. Such an uptrend will need confirmation in the next few months with a new high.
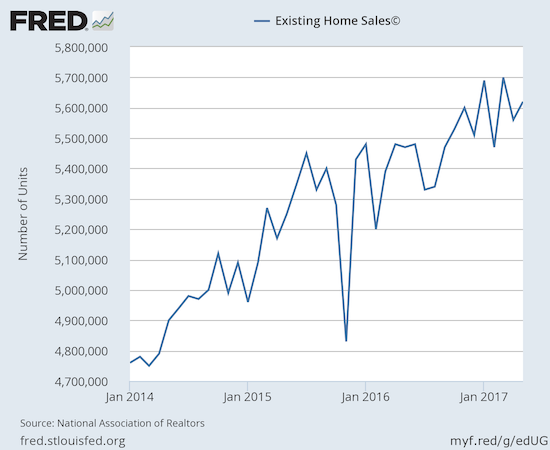
(recall that the NAR no longer makes data available before 2013. For more historical data to 1999 click here)
Source: National Association of Realtors, Existing Home Sales© [EXHOSLUSM495S], retrieved from FRED, Federal Reserve Bank of St. Louis, June 26, 2017.
First-time buyers dropped ever so slightly from April’s 34% to May’s 33% of sales. In March, first-timers were 32% of sales, same as in February, down just one percentage point from December and January, and up two percentage points from a year ago. The average for 2016 was 35%. The NAR used this opportunity to highlight a white paper titled “Hurdles to Homeownership: Understanding the Barriers.” The paper beings with a stark recession-related statistic: the U.S. added 11.8M households from 2006 to 2016 but ended up with 1M fewer homeowners. The increase in the median size of a single-family home is one of many signs that homeownership has tilted toward the more well-off. From 2006 to 2015, the median square footage increased from 2,250 to 2,467 – so much for the death of the McMansion! The paper’s authors list the following factors impeding the expansion of homeownership: tight mortgage market, student debt burdens, lower housing supply, increasing cost-of-living (which presumably hinders saving for a down payment), and “post-foreclosure stress disorder” which represents an increase in risk aversion to buying a home given the pain of the collapse of the housing bubble.
The absolute level of inventory of existing homes has fallen year-over-year for 24 straight months. During the press conference, the NAR declared there is now a housing crisis (in supply) in some housing markets. The 1.96M homes for sale represented an 8.4% decrease from the previous May. The recent year-over-year declines have been remarkable: August -10.1%, September -6.8%, October -4.3%, November -9.3%, December -6.3%, January -7.1%, February -6.4%, March -6.6%, and April -9.0%. This translates into markets where homes do not stay on the market for long:
“Properties typically stayed on the market for 27 days in May, which is down from 29 days in April and 32 days a year ago; this is the shortest timeframe since NAR began tracking in May 2011.”
In December, inventory hit a new absolute low measured from 1999 when the NAR began tracking. Now, inventory has managed to increase month-over-month for the fifth month in a row with a 2.1% increase in May. At 4.2 months of sales, relative inventory stayed flat with April and was down from 4.7 months of sales a year ago. March held inventory at 3.5 months of sales which was flat with February. In December, inventory was at 3.6 months of sales. Inventory levels apparently responded slightly for the Spring selling season – a small positive sign that the NAR failed to acknowledge.
Investors purchased 16% of existing homes in May, up from the 15% in April. A year ago, investors bought 13% of existing homes for sale. Again, investor appetite is clearly not satiated even as the month-to-month share of sales has demonstrated significant volatility.
On a regional basis, the Midwest was the only region to experience a year-over-year sales decline: Northeast 2.6%, Midwest -0.8%, South 4.5%, West 3.4%. Yet again, all regions logged year-over-year price jumps, all of them substantial: Northeast 4.7%, Midwest 7.3%, South 5.3%, West 6.9%. As usual, the price surges in the South and West make the strong annual sales increases in those regions even more impressive again given the NAR has a habit of blaming high prices for lower sales in the national numbers.
May’s 5.8% year-over-year increase in the overall median price of an existing home represents the 63nd consecutive month of year-over-year increases. The median price of $252,800 set a new record that leapt over the previous record of $247,700 set in June, 2016. This jump essentially voids my expectation for a year-over-year price drop by June, 2017. The NAR appeared just as startled as I was by this surge. The NAR raised its biggest alarm yet about these price gains (emphasis mine):
“Home prices keep chugging along at a pace that is not sustainable in the long run…Current demand levels indicate sales should be stronger, but it’s clear some would-be buyers are having to delay or postpone their home search because low supply is leading to worsening affordability conditions.”
The question now is how long is the “long run”?! During its press conference, the NAR also noted that this year-over-year gain was double the average wage growth seen over the same period.
Single-family sales increased on a monthly basis (1.0%) and increased on a yearly basis by 2.7%. The median price of $254,600 is the third monthly increase after a string of monthly declines. The median price was up 6.0% year-over-year, similar to April’s 6.1% year-over-year jump.
“Single-family home sales increased 1.0 percent to a seasonally adjusted annual rate of 4.98 million in May from 4.93 million in April, and are now 2.7 percent above the 4.85 million pace a year ago. The median existing single-family home price was $254,600 in May, up 6.0 percent from May 2016.”
New Residential Sales – May, 2017
Gains in new single-family home sales cooled down the near panic over the three straight months of decline in housing construction.
The Census Bureau revised April sales of new single-family homes significantly upward from 569,000 to to 593,000, a second straight month of a notable upward revision. This revision greatly decreased the monthly decline of sales from March to April and produced a 2.9% gain for May new home sales of 610,000. Year-over-year, new home sales increased an impressive 8.9%. New home construction should pick up quickly in the near future given the on-going strength in demand and the on-going crisis of supply for existing homes.
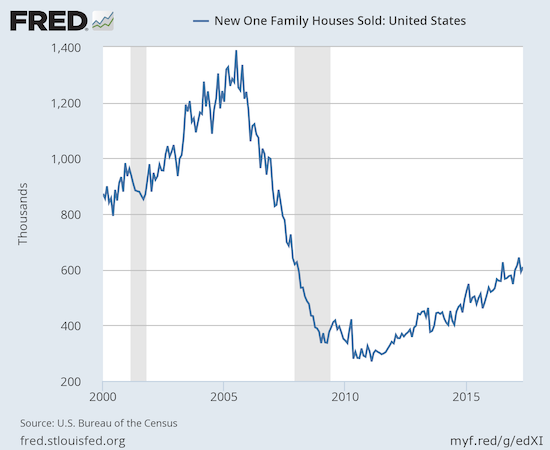
Source: US. Bureau of the Census, New One Family Houses Sold: United States [HSN1F], retrieved from FRED, Federal Reserve Bank of St. Louis, June 26, 2017.
New home inventory decreased from 5.7 to 5.3 months of supply. This level continues to sit in (surprisingly) sharp contrast with the much more scarce inventory of existing homes. A market for homes is in balance at 6 months of supply.
New home sales again exhibited a large range of year-over-year changes across regions, two positive, one negative, and one flat. The Midwest’s impressive 3-month streak came to a screeching halt with a 23.6% year-over-year decline. The Northeast was flat year-over-year. The South and the West led the way with gains of 15.0% and 14.1% respectively. Last month, I put the West on my “radar of caution” after a steep 13.7% year-over-year decline. I am glad that number bounced back quickly as I had hoped.
The distribution of sales by sales price exhibited an interesting distortion. Homes priced from $200,000 to $299,999 were relatively robust with a growing share through April, going from 14% to 22%. In May, that share dropped back to 14% with homes priced from $300,000 to $399,000 benefiting the most with an increase from 12% to 16%. I will be watching the sales distribution in the coming months to see whether any new trend in pricier homes develops.
Home Builder Confidence: The Housing Market Index– June, 2017
The Housing Market Index (HMI) was the most impressive data point of my Housing Market Review to end 2016. I thought the story for early 2017 would be a cooling of this red hot confidence. Instead, in March, builder confidence soared to a new 12-year high. The HMI now appears stalled just under that 12-year high. April dropped to 68, May increased just a point to 69 (revised this month), and June dropped to 67. I am still expecting a new post-recession high at some point this year as new home sales continue powering higher.
The National Association of Home Builders (NAHB) thinks the HMI is on solid footing but indicated that home builders think the housing market could be even better if not for current economic constraints:
“As the housing market strengthens and more buyers enter the market, builders continue to express their frustration over an ongoing shortage of skilled labor and buildable lots that is impeding stronger growth in the single-family sector.”
In other words, builder confidence could be even stronger than current readings.
All three components declined and seem to be churning in a tight range…
Click for a larger view…
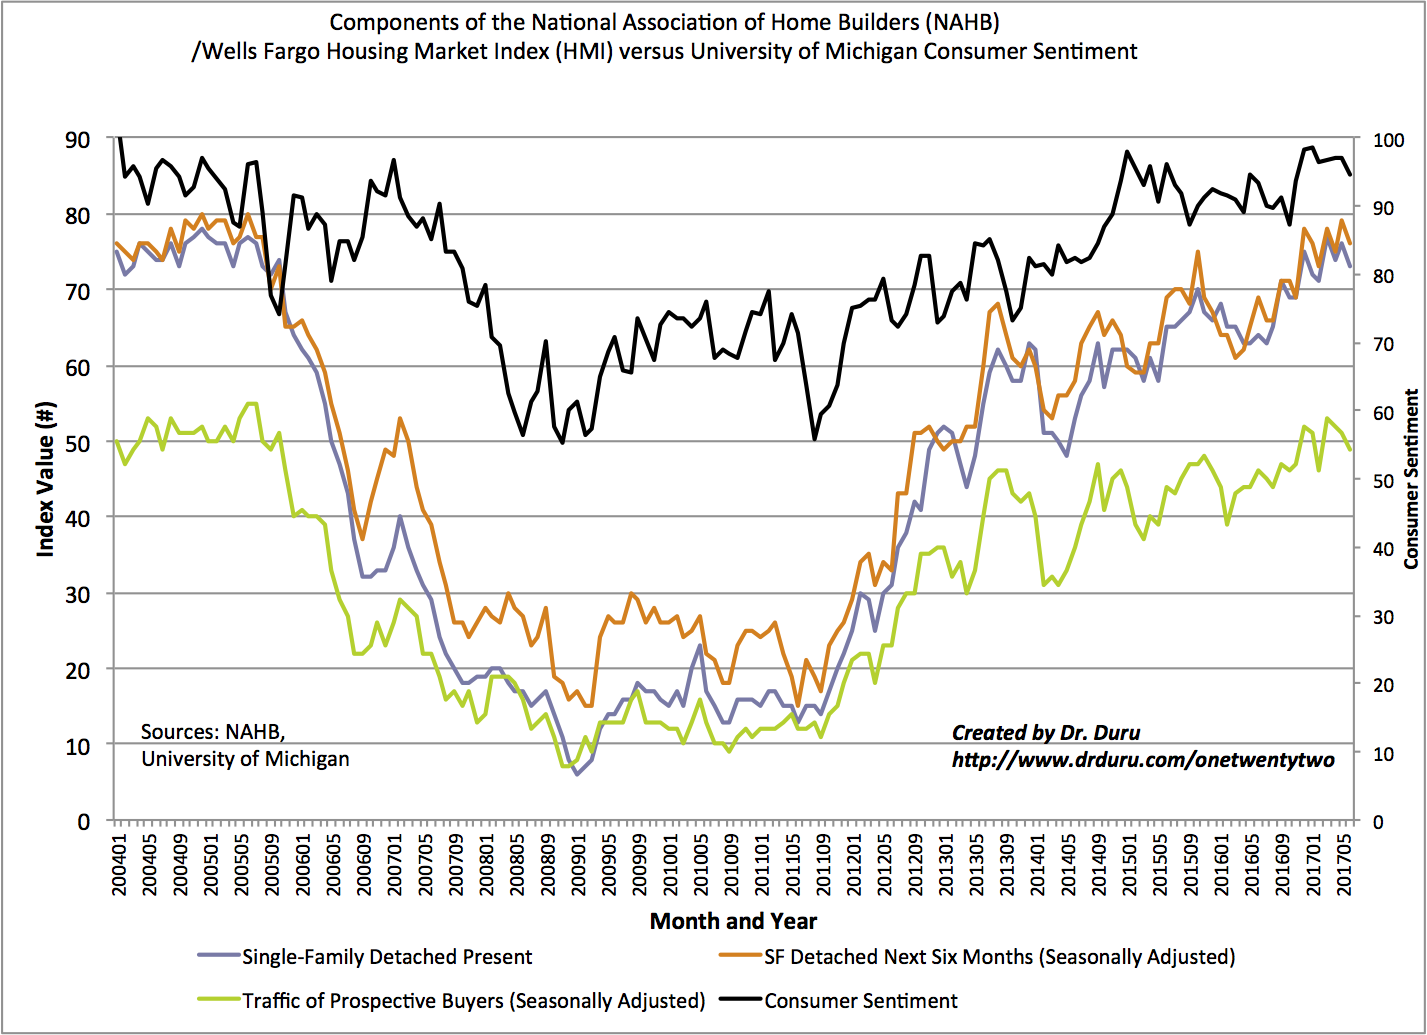
Source: NAHB
For the second month in a row, there was an interesting disparity in the regional changes in HMI. Last month, the West finally broke out from the flatline of the previous 4 months with a 80 reading. However, the West plunged this month down to 71. Confidence in the West has not been this low since August, 2016. The NAHB did not offer any explanation given its focus on 3-month moving averages. While the West is off-watch for new home sales, it is not on watch for sentiment! Sentiment in the Midwest increased from 65 to 69 – its first increase since March. The Northeast dropped by just one point while the South dropped by 3 points.
Parting thoughts
In the last Housing Market Review, I flagged Century Communities (CCS) for selling. CCS has continued to sag and seems to have confirmed a peak for now.

In the last Housing Market Review, I flagged M.D.C. Holdings, Inc. (MDC) for a buy, but the stock has yet to pull back. In fact, this week was doubly dramatic for MDC as it broke out to a new 4-year high by surpassing May’s high. Sellers quickly knocked MDC off its high with a 3.8% decline. I will be watching MDC even more closely as it is one of the leaders among the home builders.
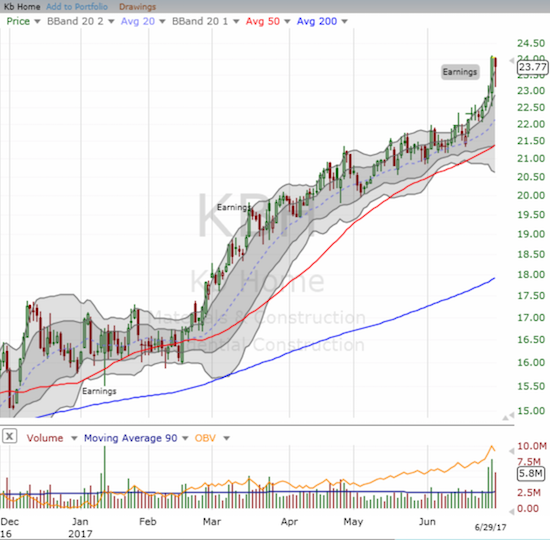
KB Home (KBH) has also emerged a strong stock. KBH is up an incredible 50.3% year-to-date. I of course regret ever selling my past holdings in KBH! The stock almost went parabolic going into and in response to its last earnings report. The last three days have featured very heavy trading volume. The two easy tells for KBH going forward will be post-earnings lows/highs and support at its uptrending 50-day moving average (DMA). Like MDC, KBH trades at a 4-year high. KBH is under two points away from a post-recession high. Such an achievement would be VERY significant given KBH’s perennial status as a laggard among builders.
Be careful out there!
Full disclosure: long TLT call options