
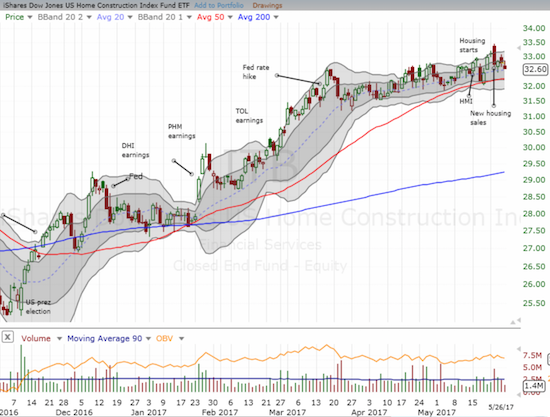
The last Housing Market Review covered data reported in April, 2017 for March, 2017. At that time, the iShares US Home Construction (ITB) was at the high end of almost two months of churn which included a new 10-year high. ITB has not hit “escape velocity” from its price where the U.S. Federal Reserve last hiked interest rates, but at least it still trades above that spot.
Source: FreeStockCharts.com
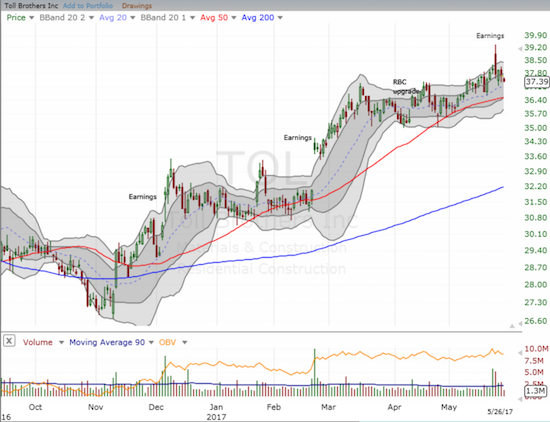
In general, the housing data yet again looked strong. I see a lot more of the same. While ITB has churned a lot in the last two months, I cannot complain given its 10-year highs. Toll Brothers (TOL), my main outstanding play on home builders for the seasonal trade, experienced a setback with a sharp post-earnings fade. The reversal coincided with new home sales that apparently disappointed the analyst class, but TOL was as bullish as ever. From the Seeking Alpha Transcript of TOL’s earnings call (emphasis mine):
“Many factors are bringing buyers off the fence right now. These include low interest rates, urgency created by the limited supply of resale and new homes and improving personal balance sheets and credit profiles. Our luxury buyers are further benefiting from a solid employment picture, strong consumer confidence, a robust stock market and increasing equity in their existing homes.
Additionally, as the Wall Street Journal recently reported, the number of new owner households was double the number of new rented households in the first calendar quarter of this year. According to Trulia, this was the first time in a decade that new home buyers have exceeded new home renters. Clearly the new home market is alive and well.”
Despite the small setback, TOL is still in an uptrend as defined by its 20 and 50-day moving averages (DMAs), so I continue to hold my shares. Given the period of seasonal strength for home builders is coming to an end, I am not adding shares here. The upside in TOL is still defined by a recovery to its 2015 high around $42 which was a 9-year high at the time. TOL’s valuation remains attractive: 17.0 trailing P/E, 10.8 forward P/E, 1.1 PEG ratio, 1.1 price/sales, 1.4 price/book (data from Yahoo Finance). These are early recovery type numbers – much like the levels of the macro housing numbers when measured from a historical perspective.
Source: FreeStockCharts.com
New Residential Construction (Housing Starts) – April, 2017
Single-family housing starts for March were revised upward from 821,000 to 832,000. April starts marginally increased month-over-month by 0.4% to 835,000. This change did not break the on-going uptrend. On an annual basis, single-family housing starts gained a healthy 8.9% which was below the year-over-year increases of 11.1% in January, 13.5% in February, and 9.3% in March.
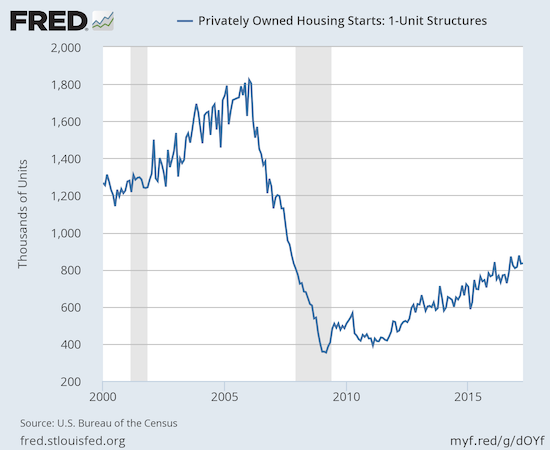
Source: US. Bureau of the Census, Privately Owned Housing Starts: 1-Unit Structures [HOUST1F], retrieved from FRED, Federal Reserve Bank of St. Louis, May 22, 2017.
Across the regions, starts varied widely for a second month in a row with the Northeast experiencing the most dramatic flip on a year-over-year basis. The Northeast went from #1 last month to last this month on a 16.4% drop. The West took the #1 spot by soaring 29.9%, continuing a streak of gains. The South jumped 7.3%. The Midwest barely budged with a 0.8% decrease.
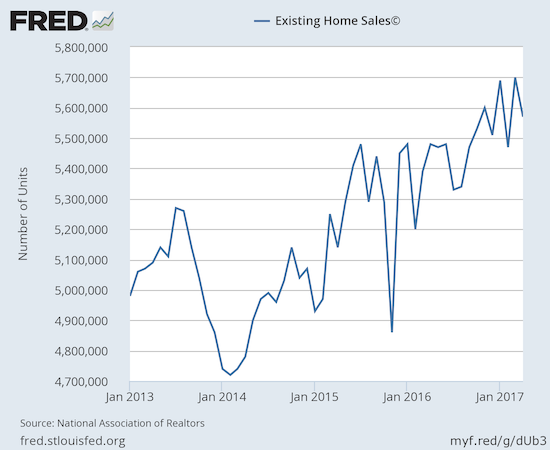
Existing Home Sales – April, 2017
The main headline for existing home sales says it all: “Stubbornly low supply levels held down existing-home sales in April and also pushed the median number of days a home was on the market to a new low of 29 days.” The National Association of Realtors (NAR) started tracking these data in 2011. Days on the market was 34 in March and 39 a year ago. So, even after 5 to 6 years of recovery, the housing market continues to experience the strains of an imbalance largely from an inelastic supply response. The National Association of Realtors (NAR) spent more time in this latest report lamenting the poor supply situation (which they are more prone to do when the sales news are sub-par).
For January, existing home sales returned to gains and hit levels not seen since February, 2007. For February, existing home sales dropped sharply from the previous month’s post-recession high and served up a reminder of the month-to-month volatility in this series. For March, existing home sales made a sharp rebound and set a new post-recession high (the highest in over 10 years). For April, the yo-yo bounced down slightly, and the NAR returned to more pessimistic reporting:
“Last month’s dip in closings was somewhat expected given that there was such a strong sales increase in March at 4.2 percent, and new and existing inventory is not keeping up with the fast pace homes are coming off the market…Demand is easily outstripping supply in most of the country and it’s stymieing many prospective buyers from finding a home to purchase.”
The seasonally adjusted annualized sales of 5.57M were down 2.3% month-over-month from a downwardly revised 5.70M (from 5.71M) in sales for February. Year-over-year sales still increased 1.6% (compare to November’s 15.4% year-over-year pop, December’s 0.7% increase, January’s 3.8% rise, February’s 5.4% increase, and March’s 5.9%). February sales dropped to levels last seen September, 2016 while March sales jumped to levels last seen February, 2007. For now, sales looked stalled around 10-year highs.
(recall that the NAR no longer makes data available before 2013. For more historical data to 1999 click here)
Source: National Association of Realtors, Existing Home Sales© [EXHOSLUSM495S], retrieved from FRED, Federal Reserve Bank of St. Louis, April 23, 2017.
Even with sales growth stalling a bit, first-time buyers pushed to a higher share of sales. In April, first-timers were 34% of sales. In March, first-timers were 32% of sales, same as in February, down just one percentage point from December and January, and up two percentage points from a year ago. The average for 2016 was 35%.
The absolute level of inventory of existing homes has fallen year-over-year for 23 straight months. The 1.93M homes for sale represented a 9.0% decrease from the previous April. The recent year-over-year declines have been remarkable: August -10.1%, September -6.8%, October -4.3%, November -9.3%, December -6.3%, January -7.1%, February -6.4%, March -6.6%. In December, inventory hit a new absolute low measured from 1999 when the NAR began tracking. Now, inventory has managed to increase month-over-month for the fourth month in a row with a 7.2% increase in April. At 4.2 months of sales, inventory greatly improved over recent levels although down from 4.6 months of sales a year ago. March held inventory at 3.5 months of sales which was flat with February. In December, inventory was at 3.6 months of sales. At least it seems inventory levels responded slightly for the Spring selling season.
Investors purchased 15% of existing homes in April, the same percentage as in March. This level was down from 17% of existing homes in February, and the same as January and December, 2016. A year ago, investors bought 13% of existing homes for sale. Clearly, investor appetite is far from satiated even as the month-to-month share of sales has demonstrated significant volatility.
The regional results were evenly split. On a year-over-year basis, the West and the South gained while the Northeast and Midwest declined: Northeast -2.7, Midwest -0.7%, South 3.6%, West 3.5%. Once again, all regions logged year-over-year price jumps, most of them substantial: Northeast 1.6%, Midwest 7.8%, South 7.9%, West 6.8%. As usual, the price surges in the South and West make the strong annual sales increases in those regions even more impressive again given the NAR has a habit of blaming high prices for lower sales in the national numbers.
April’s 6.0% year-over-year increase in the overall median price of an existing home represents the 62nd consecutive month of year-over-year increases. The median price of $244,800 is a healthy jump from March’s $236,400. Yet, the all-time record continues to fade into the distance ($247,700 set in June, 2016). Thus, it is quite possible that a year-over-year DECLINE in price may finally occur this year even with inventory at such lows. I still eagerly await the likely change in tone when this cross-over occurs.
Single-family sales decreased on a monthly basis (-2.4%) and increased on a yearly basis by 1.6%. The median price of $246,100 is the second monthly increase after a string of monthly declines. The median price was up 6.1% year-over-year.
“Single-family home sales decreased 2.4 percent to a seasonally adjusted annual rate of 4.95 million in April from 5.07 million in March, but are still 1.6 percent above the 4.87 million pace a year ago. The median existing single-family home price was $246,100 in April, up 6.1 percent from April 2016.”
New Residential Sales – April, 2017
The Census Bureau revised March sales of new single-family homes significantly upward from 621,000 to 642,000. This revision means that March, 2017 set a new post-recession record over last July’s 627,000 units (revised upward from 622,000 as part of the Bureau’s annual seasonal review of the past two years of data). This revision also exacerbated April’s month-over-month decline to 569,000 homes, an 11.4% monthly drop. Fortunately, these sales still represent a slight year-over-year gain of 0.5%.
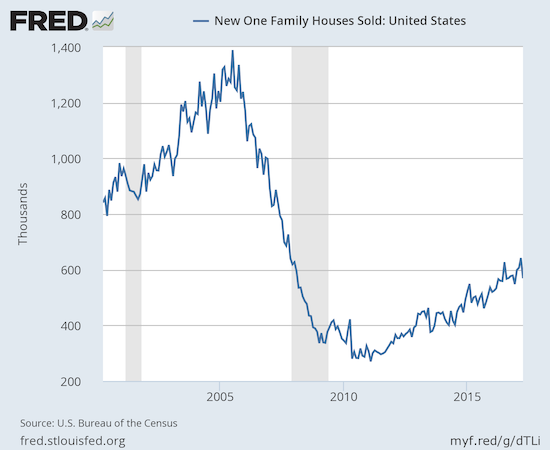
Source: US. Bureau of the Census, New One Family Houses Sold: United States [HSN1F], retrieved from FRED, Federal Reserve Bank of St. Louis, May 28, 2017.
New home inventory increased from 5.2 to 5.7 months of supply. This level continues to sit in (surprisingly) sharp contrast with the much more scarce inventory of existing homes. As a result, I do not think the relatively slow pace of home building can explain much of the strain on the inventory of existing home sales. Recall that a market for homes is in balance at 6 months of supply.
New home sales again exhibited a large range of year-over-year changes across regions, two positive, two negative. The Midwest continued an impressive streak from February’s 50.8% year-over-year gain, to March’s 23.3% gain, and now April’s 19.7% increase. The South eked out a 4.1% year-over-year increase. The Northeast dropped 5.1%, and the West declined by 13.7%. The steep decline put the West back on my “radar of caution.” I want to see that number bounce back quickly.
Home Builder Confidence: The Housing Market Index– May, 2017
The Housing Market Index (HMI) was the most impressive data point of my Housing Market Review to end 2016. I thought the story for early 2017 would be a cooling of this red hot confidence. Instead, in March, builder confidence soared to a new 12-year high. After a 3-point pullback in April, the May HMI of 70 popped right back to within a point of the post-recession high set in March at 71. At this pace, I am still looking for a new post-recession high at some point this year.
The National Association of Home Builders (NAHB) implied in November that the HMI might drop in the wake of the election. In December, the NAHB gave credit to the election for a surge in the HMI. The NAHB took the two month pullback (January and February) in stride by implying that sentiment had overheated. Ironically, sentiment set a new post-recession high the very next month. With sentiment nearly retying the post-recession high, the NAHB expressed more confidence in a sentiment reading that should also have been considered “hot”…
“This report shows that builders’ optimism in the housing market is solidifying, even as they deal with higher building material costs and shortages of lots and labor…The HMI measure of future sales conditions reached its highest level since June 2005, a sign of growing consumer confidence in the new home market…Especially as existing home inventory remains tight, we can expect increased demand for new construction moving forward.”
I cannot even remember an HMI report where the NAHB flat out predicted greater demand for housing builders. Another sign of great confidence!
All three components of the HMI are still in strong uptrends/rebounds even though the Traffic of Prospective Buyers slid by a point.
Click for a larger view…
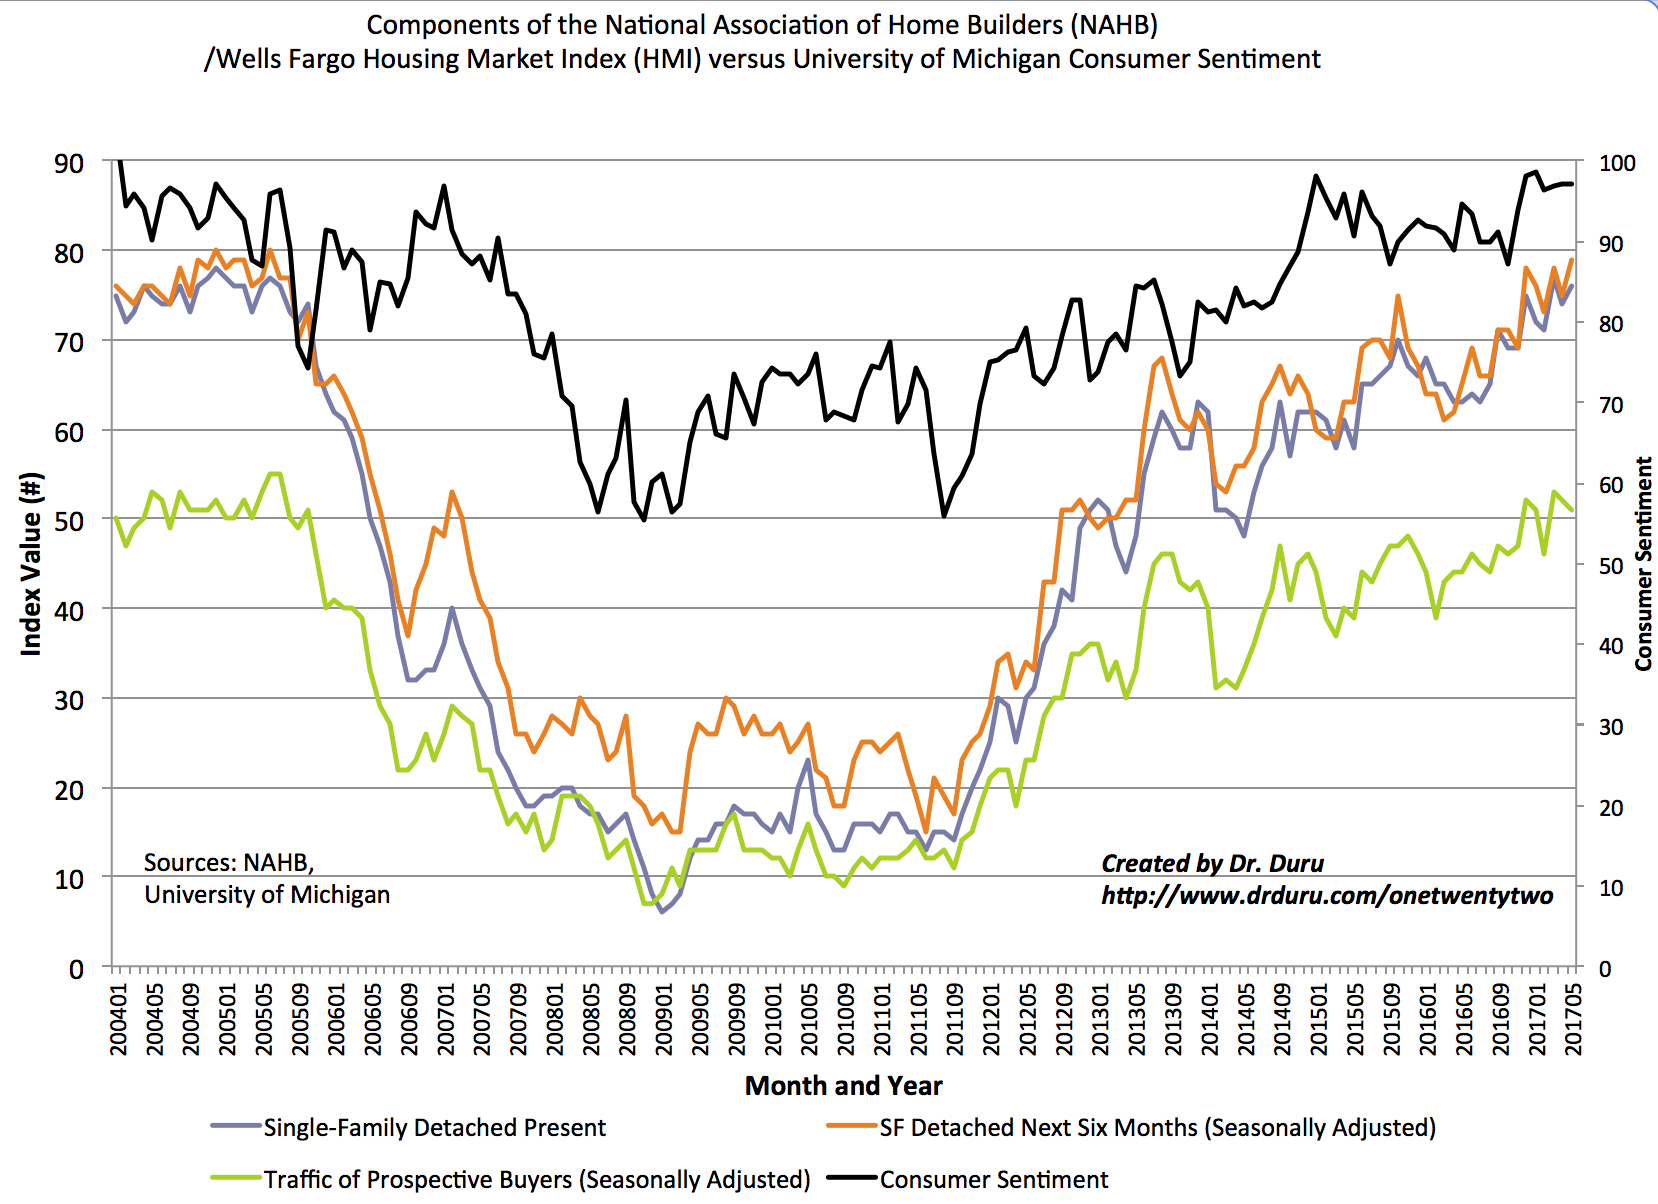
Source: NAHB
There was an interesting disparity in the regional changes in HMI. The West finally broke out from the flatline of the previous 4 months with a 80 reading. This jump of course stands in sharp contrast to the plunge in new home sales for April so perhaps a strong rebound is coming for May. From January to April, the West stayed relatively flat at 75, 76, 77, and 77 respectively. The South increased by 2 points to 72. The South squeezed out 2 points. Surprisingly, the Midwest dropped for the second month in a row. The Northeast was a big drag in April but it led the pack in May with a 5 point increase to 50.
Parting thoughts
With the Spring selling season winding down and the seasonally strong period for home builders already over, I am not expecting any dramatic moves in home builders that are not part of general market moves. Accordingly, I do not expect to do much trading in home builders, if at all, until the seasonally strong period approaches again (starting November). While I hold onto TOL, I will be selling Century Communities (CCS) this week. After a strong uptrend going into May earnings, CCS has taken on the trading pattern of a peaking stock. CCS printed a “bearish engulfing” post-earnings pattern and has now broken down below its 50-day moving average (DMA). I want to sell here to lock in my small remaining profits on my last position.
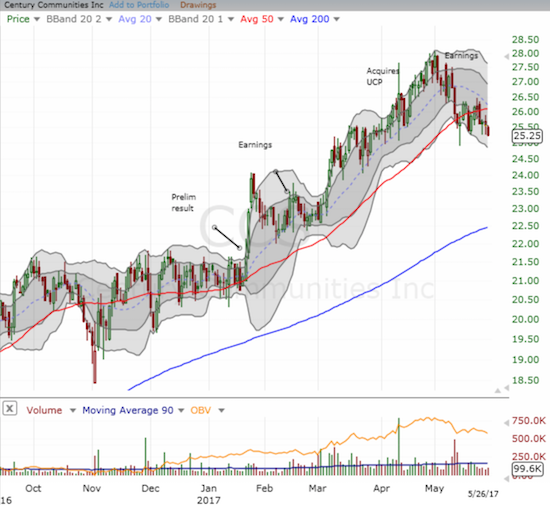
Source: FreeStockCharts.com
M.D.C. Holdings, Inc. (MDC) is moving in the opposite direction. MDC peaked quickly off the housing trough. By early 2013, the stock topped out. This year brought about a renaissance of sorts for MDC. The stock is up a market-beating 32.3% year-to-date and a 4-year high. Investors responded very well to May earnings, but in recent days MDC pulled back to the high of that first post-earnings day. It looks like a buy here, but I will just stay on watch for now. I will also take some time in the next few weeks to study MDC’s latest earnings report more closely.
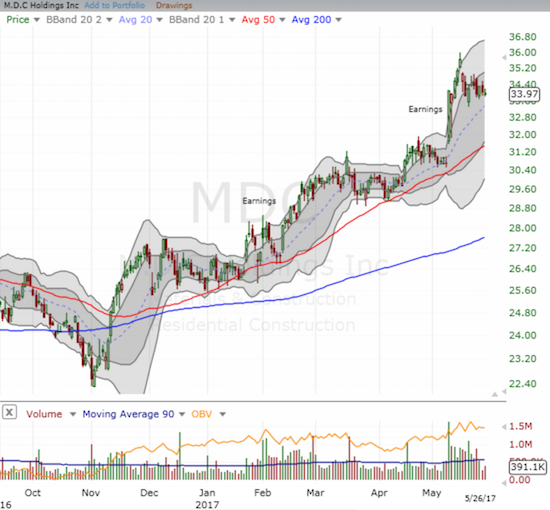
Source: FreeStockCharts.com
And then there is the June meeting for the U.S. Federal Reserve. Home builders have performed surprisingly well in the wake of this rate hiking cycle, but a June rate hike could deliver a serious test to the resolve of investors even as another tiny rate hike is not likely to impact demand. I have very low expectations since home builders are more vulnerable to sell-offs in this part of the year. A big enough sell-off could send me back to the buyers table ahead of schedule.
Be careful out there!
Full disclosure: long TOL, long CCS