
AT40 = 59.3% of stocks are trading above their respective 40-day moving averages (DMAs)
AT200 = 58.3% of stocks are trading above their respective 200DMAs
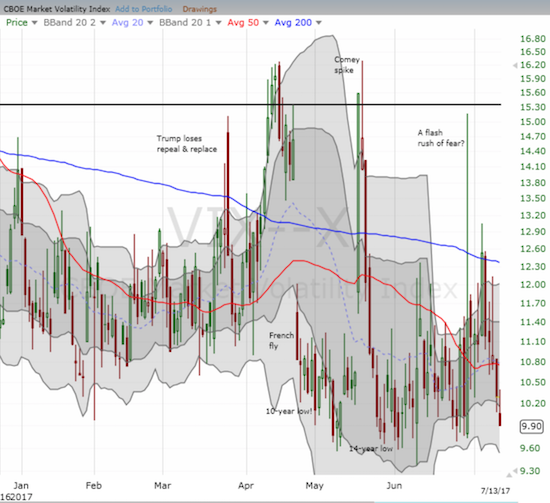
VIX = 9.9 (volatility index)
Short-term Trading Call: neutral
Commentary
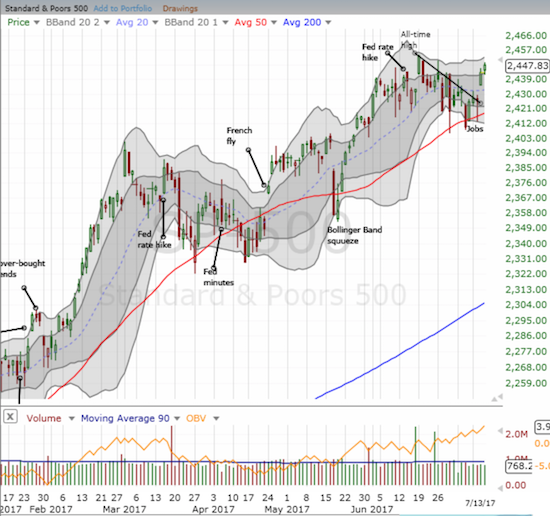
The stock market continued its healing process from its last bout of mild indigestion. Most impressive is the S&P 500 (SPY) which confirmed support at its 50-day moving average (DMA) with a gap up and break out above the previous short-term downtrend. The index gained 0.7% the previous day (Wednesday, June 12) and followed-through with a little more buying interest today.
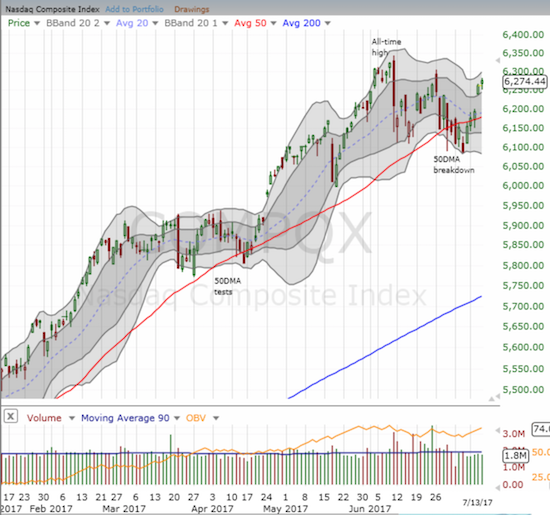
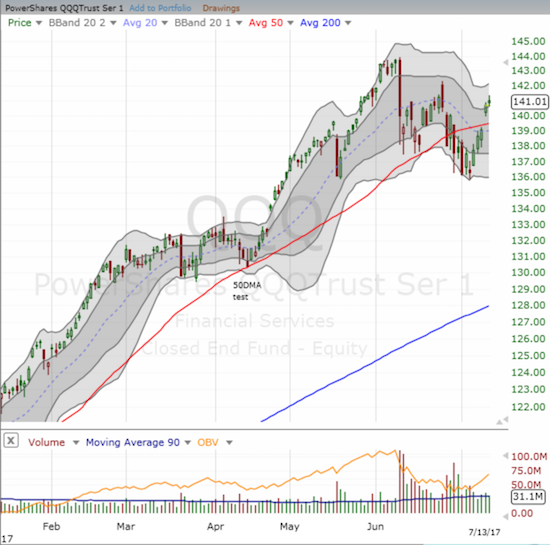
Tech also impressed by gaining without sucking air out of the rest of the market. The NASDAQ increased 1.1% on the previous day and pushed a little higher today. The PowerShares QQQ ETF (QQQ) moved along with the NASDAQ. Both tech-laden indices delivered confirmed 50DMA breakouts.
AT40 (T2108), the percentage of stocks trading above their respective 40DMAs, confirmed the return of bullish sentiment with its own gap up on Wednesday. Trading looked shakier today, but AT40 managed to eke out a marginal gain to close at 59.3%. The volatility index, the VIX, rounded out the bullish flavor with a plunge back toward 14-year lows (recall that the VIX at extreme lows is typically a BULLISH sign).
Putting these moves all together, I am suddenly looking at a short-term trading call that is slipping out of step with the market’s latest mood. Still, I am sticking with neutral until buyers prove themselves by firmly planting a new all-time high flag on the S&P 500. And even then, I am not expecting much more upside from there in the short-term as I discussed in the last Above the 40.
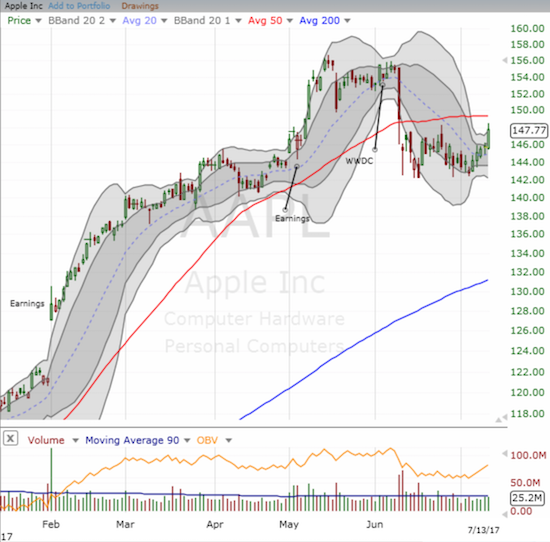
This resurge of the bull placed my trading strategy on the usual suspects a little off synch. For the first week in 4, Apple (AAPL) was better played to the upside. AAPL particularly seemed to wake up today with a 1.4% gain the makes it look like the stock is finally ready to join the rest of the usual suspects who have already recovered into bullish technicals. I tried to low ball some call options, but the market refused to deliver.
Two of the usual suspects, Facebook (FB) and Nvidia (NVDA), notched fresh all-time closing highs over the last two trading days. Netflix (NFLX) and Alphabet (GOOG) finally closed above 50DMA resistance over the past two trading days. Amazon.com (AMZN) spent the week confirming its 50DMA breakout from last Friday.
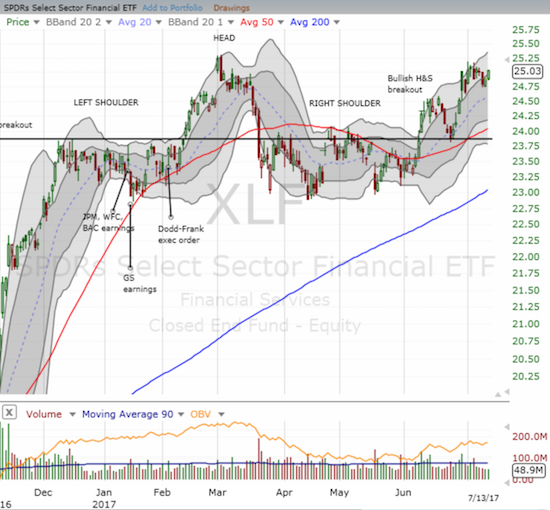
The next biggest play on my radar is in the financials. Major earnings are coming up Friday morning and beyond, and Financial Select Sector SPDR ETF (XLF) still looks tentative. So I expect some positive news to send XLF soaring. I loaded up on call options on XLF rather than attempt to pick and choose which financial(s) would deliver the blockbuster post-earnings performance. If the financials fail to deliver, I will consider my neutral short-term trading call well-justified!
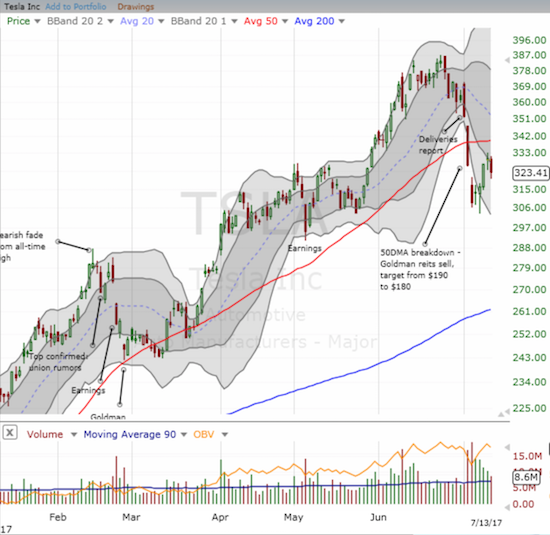
My trade in Tesla (TSLA) worked out about as well as I could expect. I locked in profits on Wednesday as the stock traded “close enough” to 50DMA resistance. I am now riding on the put spread on the house’s money although I do not expect my net profits to increase from here without, at least, another vicious swoon from TSLA. Sellers tried to make another run today (on high volume too).
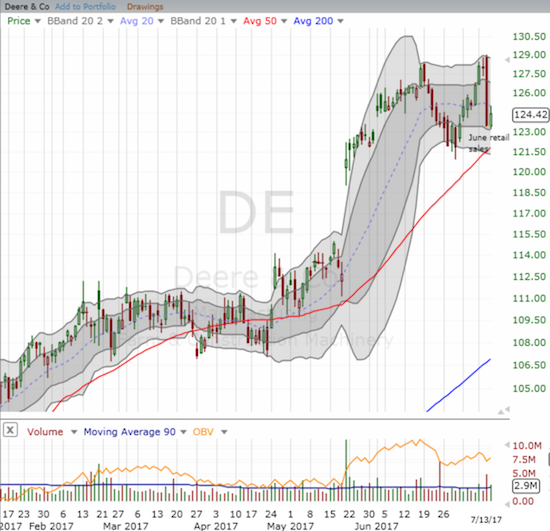
Traders hit the reset button on Deere & Company (DE). DE’s latest retail sales report left everyone with a bad feeling and sent the stock plunging into a complete reversal of the last breakout. I was late in buying back into DE and could not get a low ball offer on call options to fall my way. I will be ready again in the next few days. I have to imagine the sellers are not quite finished yet.
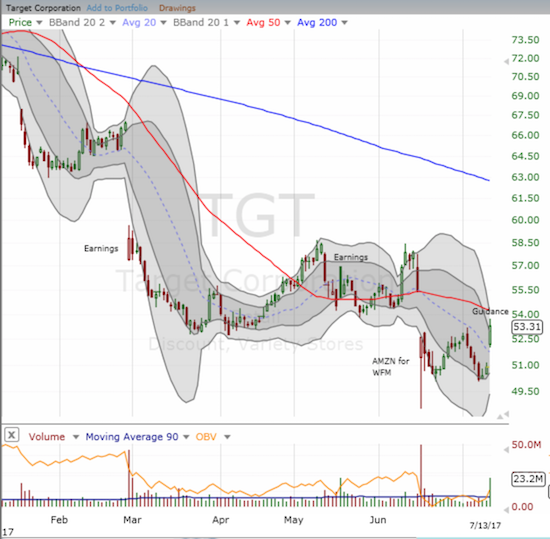
On the other hand, Target (TGT) delivered news that delighted traders and investors and gave them a reason to put “Amazon Panic” aside for the time being. TGT rallied for a 4.8% gain on trading volume that was over 3x the 90-day average. This was another one of those cases where my trading went on automatic and I secured call options as soon as possible. The story on TGT has now quickly changed from complete doom and gloom to at least a glimmer of hope. The stock is now at a new post Amazon panic closing high. Next up is downtrending 50DMA resistance and several gaps down to fill…
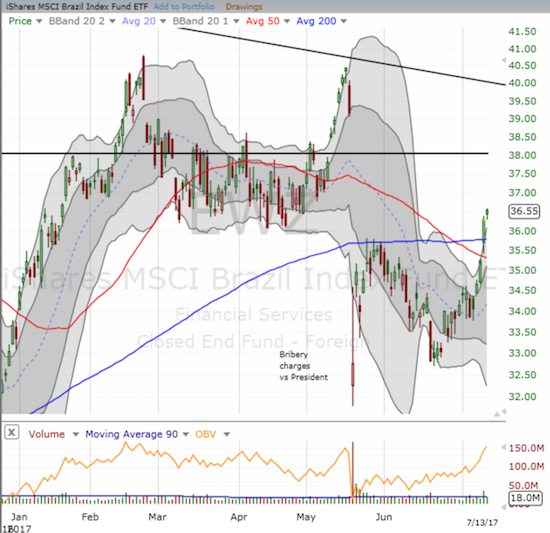
Lastly, a miss for the week: iShares MSCI Brazil Capped ETF (EWZ). I wrote about my trade in EWZ in the wake of its steep sell-off on news of bribery charges against the Brazilian President. After that, I waited patiently for a new entry point. That point came in mid-June with EWZ trading around $33. Inexplicably, I failed to pull the trigger. Ten percent later, EWZ has broken out above 50 and 200DMA resistance in a move that pretty much confirms for me that the earlier panic in EWZ was overdone.
Other trades: took reduced profits in Monro Muffler Brake, Inc. (MNRO) after it rallied today; locked in profits on Nvidia (NVDA) call spread, and locked in profits on iShares Silver Trust (SLV) calls.
— – —
FOLLOW Dr. Duru’s commentary on financial markets via email, StockTwits, Twitter, and even Instagram!
“Above the 40” uses the percentage of stocks trading above their respective 40-day moving averages (DMAs) to assess the technical health of the stock market and to identify extremes in market sentiment that are likely to reverse. Abbreviated as AT40, Above the 40 is an alternative label for “T2108” which was created by Worden. Learn more about T2108 on my T2108 Resource Page. AT200, or T2107, measures the percentage of stocks trading above their respective 200DMAs.
Active AT40 (T2108) periods: Day #353 over 20%, Day #167 over 30%, Day #34 over 40%, Day #5 over 50% (overperiod), Day #7 under 60% (underperiod), Day #113 under 70%
Daily AT40 (T2108)
")
Black line: AT40 (T2108) (% measured on the right)
Red line: Overbought threshold (70%); Blue line: Oversold threshold (20%)
Weekly AT40 (T2108)

*All charts created using freestockcharts.com unless otherwise stated
The charts above are my LATEST updates independent of the date of this given AT40 post. For my latest AT40 post click here.
Related links:
The T2108 Resource Page
You can follow real-time T2108 commentary on twitter using the #T2108 or #AT40 hashtags. T2108-related trades and other trades are occasionally posted on twitter using the #120trade hashtag.
Be careful out there!
Full disclosure: long AAPL puts, long NFLX puts, long TSLA puts, long TGT calls, long XLF calls
*Charting notes: FreeStockCharts.com uses midnight U.S. Eastern time as the close for currencies.
It is very reminiscent of 2007 and I am waiting for a blowoff top. SPX peaked with a 10% up day in Sept 2007. usd.jpy also reached a maximum level at June 2007 and euro longs peaked may 2007. We are reaching spec levels in long euro and short yen not seen since this period. Another few months and I think we will get to a peak in euro long postitions and short yen positions. I had thought the Chinese would extend stimulus a bit longer but if they don’t, an SPX top could form by year end. Certainly, I think euro longs and short yen positions are starting to ripen and look very interesting. I have now a small core holding short NZD.JPY. And will add to it when blowoff occurs. Interesting strength in aud.usd Friday. Not sure if it should be faded. Dollar weakness could continue for another few months.
As you may know, I recently wrote it is time to stop being bearish on the Australian dollar. I may have written that just in time!
I jus noticed the large spec net short interest on the Japanese yen. I was pretty shocked! Then again, the BoJ is stubbornly keeping a very dovish policy stance while the rest of the major central banks are either tightening or expected to start. So, it may make sense that traders and speculators are rushing to short yen to play risk in stock markets while the game still lasts. Your global market peak may finally come once the juice runs out in Japan…
I still think the euro has plenty of room to run. Maybe it peaks when the ECB finally admits that it needs to start tightening.
Quite, although tempting,you can’t step in front of this CB stuff and once it starts it tends to go much further than one expects. CAD, I should have kept in hindsight, having left 100 pips on the table when I sold out after the decision.
Can’t see much compelling out there currently.
Do you think cocoa ha found a bottom yet ?
I think cocoa is *bottoming*. The news simply cannot get worse for this growing season. So, I have actively taken to buying NIB around $22 for short-term swing trades. I will slow or cease the trade by September as news about next year’s crop will start to loom I think.