
Another Presidential-level scandal has engulfed Brazil.
On the morning of Thursday, May 18th, news hit the wires that Brazilian President Michel Temer was accused of bribery. The crisis deepened after Brazil’s Supreme Court gave the go-ahead for an investigation into the bribery allegations From Reuters:
“Brazil’s President Michel Temer on Thursday defiantly said he would not resign from office despite a Supreme Court decision authorizing an investigation into allegations he condoned bribery of a potential witness in a major corruption probe.
In a terse five-minute speech broadcast nationwide, Temer said he had done nothing wrong, that his presidency was helping turn around Brazil’s stalled economy and that he welcomed an investigation so that he could prove his innocence.”
The reaction to the initial news was swift. The iShares MSCI Brazil Capped ETF (EWZ) gapped down on extremely high volume. Buyers stepped into the gap immediately and for 10 minutes bid EWZ back up before sellers returned. Within another 15 minutes, EWZ made a new intraday low. Trading from there was much more orderly as EWZ printed two higher intraday highs and two high intraday lows.
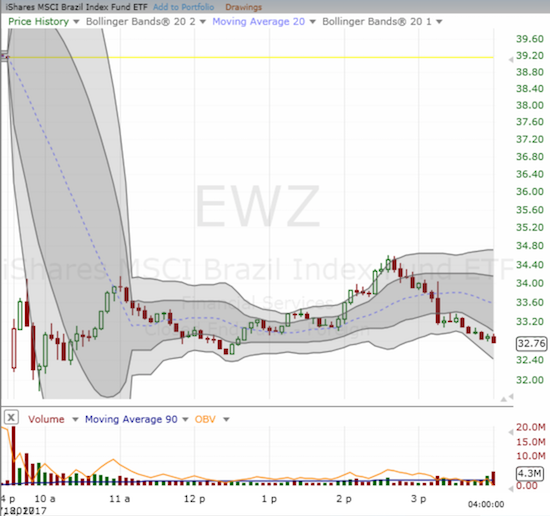
EWZ ended the day with a 16.3% loss. This kind of one-day loss for a country-wide index represents a crash in every sense of the word. All at once, investors and traders worried that the erupting Presidential scandal meant that Temer would fail in his bid to complete economic reforms that are (reportedly) raising Brazil from its economic woes. Crashes always get my attention, and my reflex inclination was to buy. The intraday higher lows and higher highs were a fortuitous combination that allowed me to flip shares twice and flip call options once before my last purchase near the close.
The daily chart below shows how EWZ broke down below 200-day moving average (DMA) support and traded well below its lower-Bollinger Band (BB). The high of the day touched the lower-BB in picture perfect form (and thus motivated one of my sales).
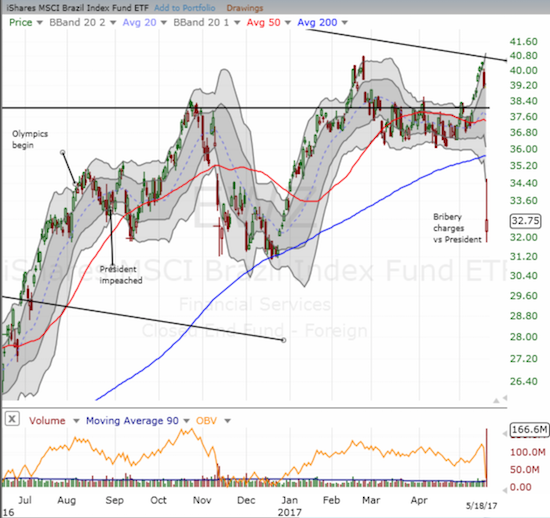
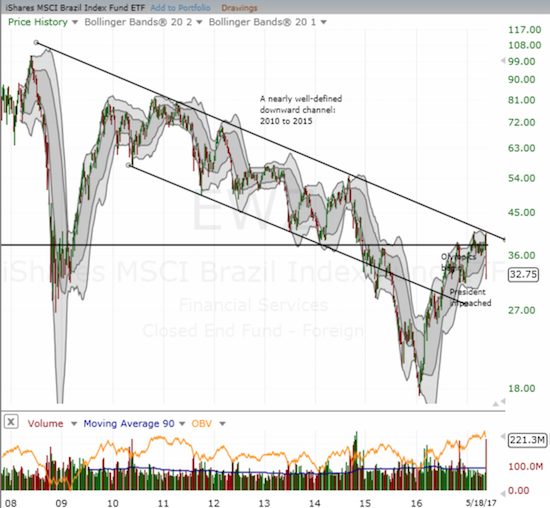
The diagonal black line in the upper-right corner is from the top of a multi-year downward channel. Note how EWZ pulled up just short of that line before Wednesday’s sell-off in sympathy with the sell-off from the growing Presidential turmoil in the United States. You just cannot make this stuff up! The weekly chart below shows the technical significance of this long-standing downtrending channel and how it still dominates the tenor of EWZ’s behavior.
Source for charts: FreeStockCharts.com
The trading in EWZ was a great reminder of how panic can distort trading into an opportunity. The 166.6M shares traded in EWZ was over 10x the 90-day average of 14.9M. This was record volume and over twice the second highest trading volume of 77.0M on October 27, 2014 (all data from Yahoo Finance). I suspect this kind of wholesale rush for the exits represents a wash-out of sellers, but my claim requires confirmation. So, in the next few days I will be looking to see what comes first – a post-scandal low or a post-scandal high. Even if today’s intraday low gives way, I will be looking for firmer support around $31 which was the solid low after EWZ’s sell-off from the October, 2016 peak. If EWZ collapses even lower, I will of course have to reassess my trading thesis.
I am also more inclined to hold on here because, at the intraday low, EWZ was off 21.4% from the last peak. EWZ thus met my buy-the-dip criteria for the ETF which has a threshold set at a 20% decline. (Click here to see a list of my past commentary on EWZ).
Be careful out there!
Full disclosure: long EWZ