
A year ago, speculators accumulated net long contracts on gold that exceeded anything seen since at least 2008. Starting in late 2015, silver speculators set several such records with the latest set just three months ago. Now, speculators in gold and silver are in full retreat. Net longs seem headed for zero for both precious metals. Current net longs in gold have not been this low since January, 2016. Current net longs in silver have not been this low since August, 2015.
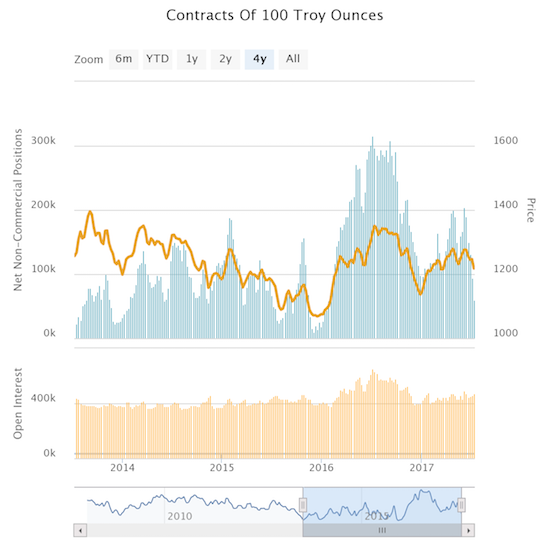
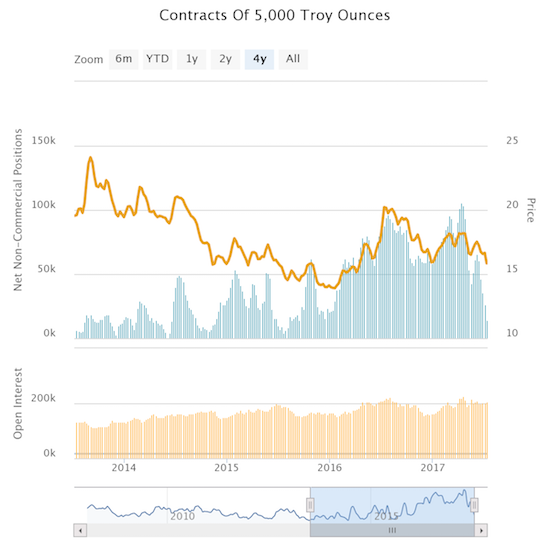
Source: Oanda’s CFTC Commitments of Traders
In parallel to these retreats, SPDR Gold Shares (GLD) and the iShares Silver Trust (SLV) last peaked in early June. Both GLD and SLV completed sharp relief rallies after selling off going into and after May’s meeting of the U.S. Federal Reserve. Whereas the March rate hike seemingly sparked a rush for GLD and SLV, June’s rate hike occurred in the middle of a fresh sell-off. It is almost as if traders in precious metals are finally taking the Fed’s tightening cycle seriously. I say “almost” because GLD has yet to crack the low that immediately preceded the March rate hike. SLV has overall behaved as expected with the now hapless ETF locked into a volatile sell-off since making a 2-year high last summer. A recent 15-month low confirmed SLV’s bearish status.
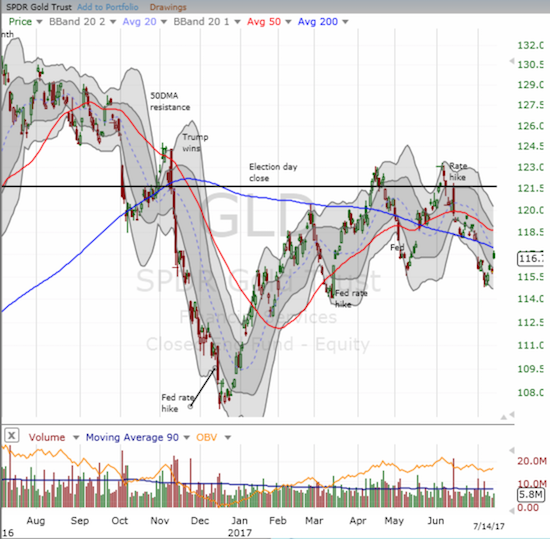
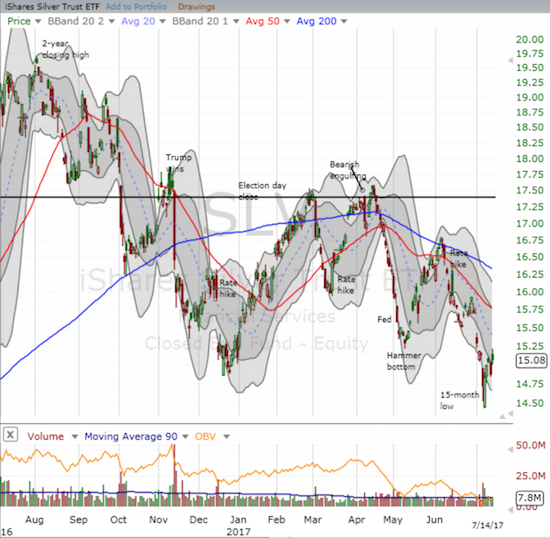
Source: FreeStockCharts.com
While the technicals look awful for GLD and SLV, they look even worse for what is typically an inverse trade: the U.S. dollar index (DXY0). The U.S. dollar index made a major peak and 14-year high last December. Since then, the index has spent most of its time confirming a new downtrend. The sell-off accelerated starting in late June. Friday’s soft economic data (retail sales and inflation) slammed the U.S. dollar into a fresh 10-month low.
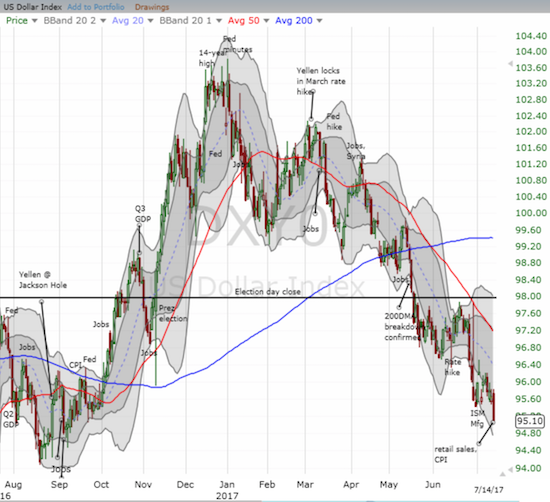
Source: FreeStockCharts.com
The fresh weakness in the U.S. dollar index completely invalidated my interest to play the relief rally I expected to leverage after relatively strong ISM manufacturing data in the previous week. I am firmly replanted on the bearish side of the ledger for the U.S. dollar.
I would love to play GLD and/or SLV as straightforward anti-dollar trades, especially since the low speculator interest means significant upside potential has opened up for whenever speculators return with buying force. I am also essentially a perma-bull on GLD and SLV which means I strongly prefer to look for entry points for bullish short-term trades to complement my core positions. Yet, the dollar-GLD/SLV inverse correlation is broken. So, for some time now I have focused on the GLD and SLV setups much more based on the technicals. I just took profits on a fortuitous trade playing a relief bounce on SLV. If previous patterns play out, SLV could still be good for a bounce all the way to its 50DMA. GLD has been a better (short-term) risk/reward play on a 50 and/or 200DMA breakout.
The dynamics for GLD and SLV have become even more interesting with speculators in full retreat on gold and silver. The global move to bottom out monetary easing and even tighten policy adds to the tension for GLD and SLV. The resolution of this tension could very well translate into trading exhaustion and an extended period of churn and consolidation. If so, I will be looking to play the bottom of that range…
Be careful out there!
Full disclosure: long GLD, long SLV