
AT40 = 53.7% of stocks are trading above their respective 40-day moving averages (DMAs)
AT200 = 56.5% of stocks are trading above their respective 200DMAs
VIX = 11.1 (volatility index) (11.7% gain)
Short-term Trading Call: cautiously bullish
Commentary
Suddenly, tech stocks are in trouble all over again.
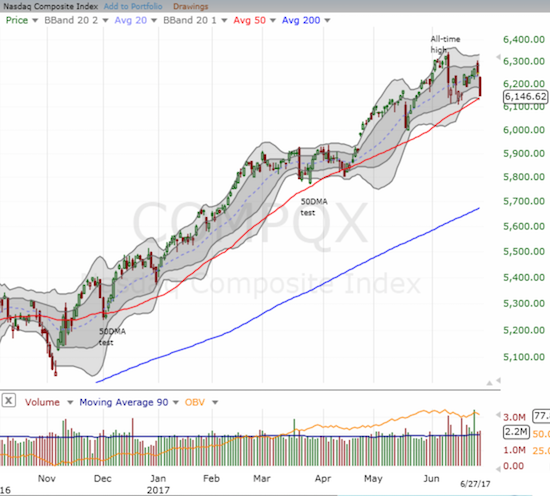
On June 9, 2017, tech stocks suddenly swooned, seemingly out of nowhere, just a day after setting another record high. On June 27th, the NASDAQ closed at its lowest level since May 22, 2017 with a 1.6% loss on the day. The tech-laden index is also effectively retesting uptrending support at its 50-day moving average (DMA) for the first time since mid-April.
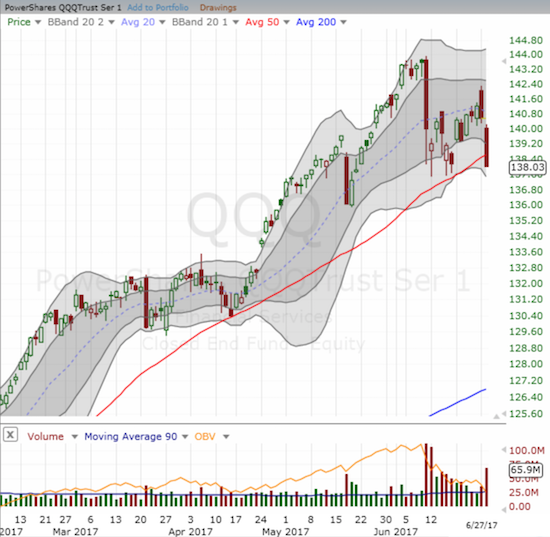
While everyone will now stare at the NASDAQ’s big retest, the PowerShares QQQ ETF (QQQ) already failed its retest with a 1.8% loss on the day. QQQ has not confirmed a topping pattern – that would require a close below the big May 17th swoon. Yet QQQ trading has surged particularly on down days. So Tuesday’s follow-through selling was sufficient to make me a lot more wary about tech stocks. I started off the week bullish on tech and ready to buy. I set up low ball offers on call options on QQQ and Facebook (FB). I thought I got good deals until Tuesday. After Tuesday’s open I added to my positions only to soon realize that “something” was not quite right. Once a more bearish interpretation of the trading action crept into my conscious, I jumped into put options on Apple (AAPL), including fading a surprising intraday rally into positive territory.
Since I noted AAPL’s relative underperformance last week among the “usual suspects,” I was taken a bit by surprise when AAPL traded in the green. AAPL ended up closing with a 1.4% loss (and I locked in my profits on the put options as a way to significantly allay losses on QQQ and FB) and fared better than its contemporaries…
- Amazon (AMZN): -1.7% – still above 50DMA.
- Facebook (FB): -2.0% – retesting 50DMA support.
- Alphabet (GOOG): -2.6% – broke 50DMA support for first time since April, 2017.
- Nvidia (NVDA): -3.7% – lowest close since June 2, 2017.
- Netflix (NFLX): -4.1% – broke 50DMA support after a brief 2-day breakout. Late in the day, I speculated on a quick bounce by buying a single call option.
Given this swing from relative under-performance to over-performance, I took a quick look at the data to determine whether AAPL has exhibited any pattern of behavior relative to these stocks. I looked at the daily change in prices for year-to-date for all these stocks. I counted out how many times AAPL printed the minimum or the maximum price change of the day. Surprisingly, AAPL was the minimum 16% of the trading days and the maximum 17% of the time. This performance is exactly what I would expect if daily positioning was random (1/6 = 17%). I hope to examine these data further to refine the positioning analysis further.
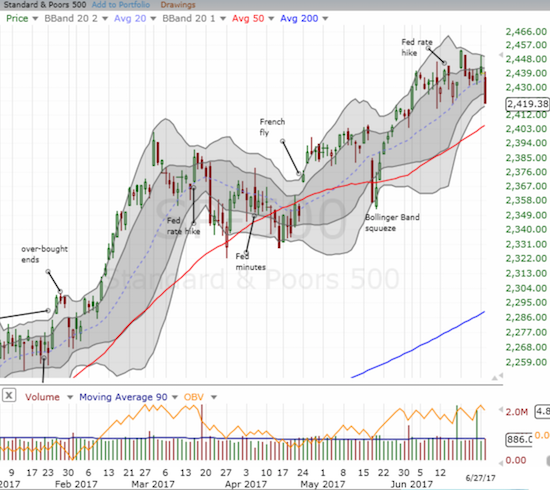
The S&P 500 (SPY) fared better than the NASDAQ (perhaps thanks to financial stocks). The index lost 0.8% but it made its lowest close since May 31st. A 50DMA retest is definitely in play.
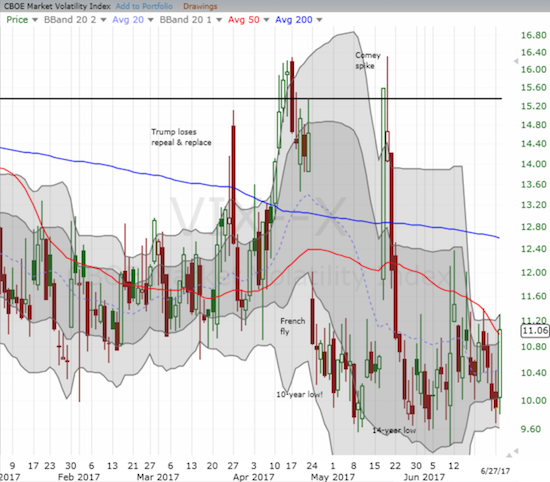
The technical damage on the indices helped to drive a wake-up call on the volatility index. The VIX shot up 11.7% to close at 11.0. Still, the VIX remains well within the recent trading range.
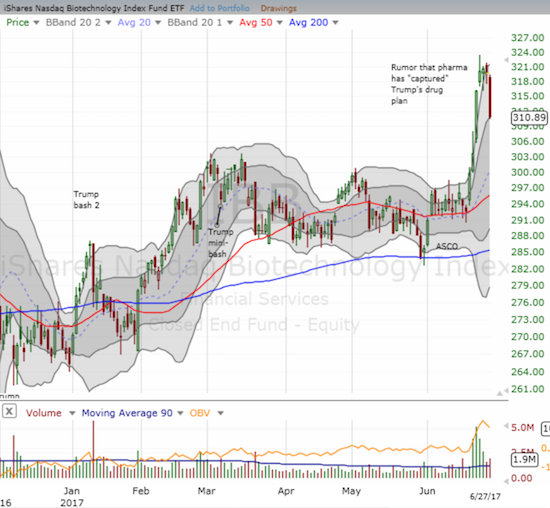
The iShares Nasdaq Biotechnology (IBB) took a major 2.7% hit that suggests the recent sharp rally has come to a screeching halt. In parallel, the U.S. Senate delayed a vote on Trumpcare until next month.
With all the technical damage on the major indices, I expected AT40 (T2108), the percentage of stocks trading above their respective 40DMAs, to suffer an outsized drop. Instead, it benefited from Monday’s impressive performance and closed about even with Friday’s close.
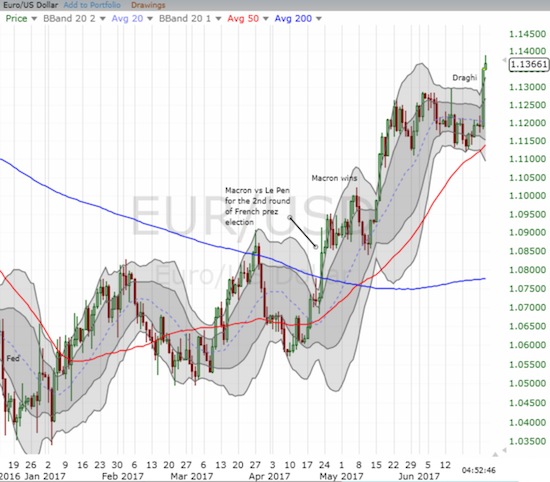
Another big story on the day was the euro (FXE). Mario Draghi gave a speech that was generally interpreted as incrementally more hawkish. I was caught without a new long position, and I had to scramble to long EUR/USD and EUR/AUD, two of the euro currency pairs that did not look over-extended. I took profits on both positions prior to and during Asian trading hours.
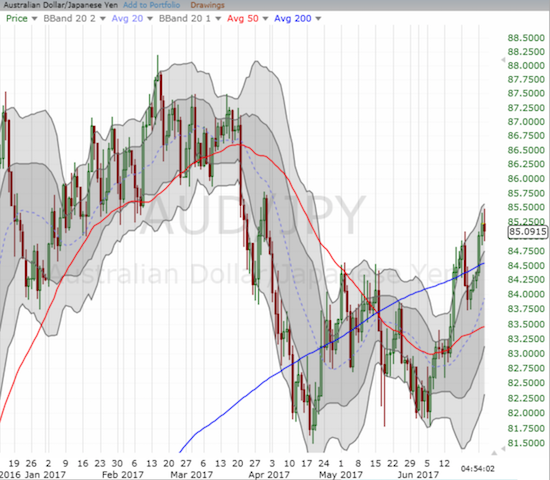
Surprisingly, the Japanese yen (FXY) greatly weakened in parallel. The yen’s weakness sent AUD/JPY to a new 3-month high.
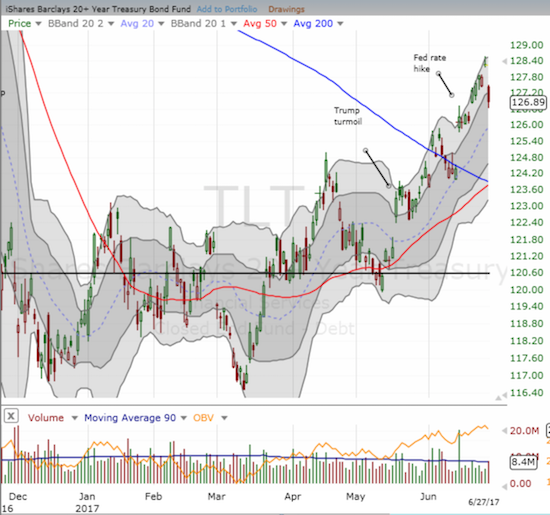
I thought the pounding on the yen would have generally bullish implications for the stock market but a rebound never materialized. Perhaps it was the parallel increase in long-term interest rates…which surprisingly did not help the U.S. dollar against other major currencies.
So overall the redux for tech troubles puts my bullish trading call in its greatest peril since I made the switch on May 25th. In the fact, the S&P 500 (SPY) is now almost flat over that time. I will go back to neutral if the index closes below its 50DMA.
Be careful out there!
— – —
FOLLOW Dr. Duru’s commentary on financial markets via email, StockTwits, Twitter, and even Instagram!
“Above the 40” uses the percentage of stocks trading above their respective 40-day moving averages (DMAs) to assess the technical health of the stock market and to identify extremes in market sentiment that are likely to reverse. Abbreviated as AT40, Above the 40 is an alternative label for “T2108” which was created by Worden. Learn more about T2108 on my T2108 Resource Page. AT200, or T2107, measures the percentage of stocks trading above their respective 200DMAs.
Active AT40 (T2108) periods: Day #343 over 20%, Day #157 over 30%, Day #24 over 40%, Day #3 over 50% (overperiod), Day #6 under 60% (underperiod), Day #103 under 70%
Daily AT40 (T2108)
")
Black line: AT40 (T2108) (% measured on the right)
Red line: Overbought threshold (70%); Blue line: Oversold threshold (20%)
Weekly AT40 (T2108)

*All charts created using freestockcharts.com unless otherwise stated
The charts above are my LATEST updates independent of the date of this given AT40 post. For my latest AT40 post click here.
Related links:
The T2108 Resource Page
You can follow real-time T2108 commentary on twitter using the #T2108 or #AT40 hashtags. T2108-related trades and other trades are occasionally posted on twitter using the #120trade hashtag.
Be careful out there!
Full disclosure: long call options for QQQ, FB, and TLT, short AUD/JPY
*Charting notes: FreeStockCharts.com uses midnight U.S. Eastern time as the close for currencies.