
AT40 = 60.4% of stocks are trading above their respective 40-day moving averages (DMAs)
AT200 = 58.8% of stocks are trading above their respective 200DMAs
VIX = 10.0 (volatility index)
Short-term Trading Call: cautiously bullish
Commentary
Just yesterday, (big cap) tech stocks looked like they were in trouble all over again. Just as suddenly as they tumbled, they came roaring back today. Traders made a statement by sending the NASDAQ up 1.4% and reversing most of yesterday’s loss. The PowerShares QQQ ETF (QQQ) gained the same percentage on soaring volume that was not as high as yesterday’s selling, but it was still a little over double the 90-day average.
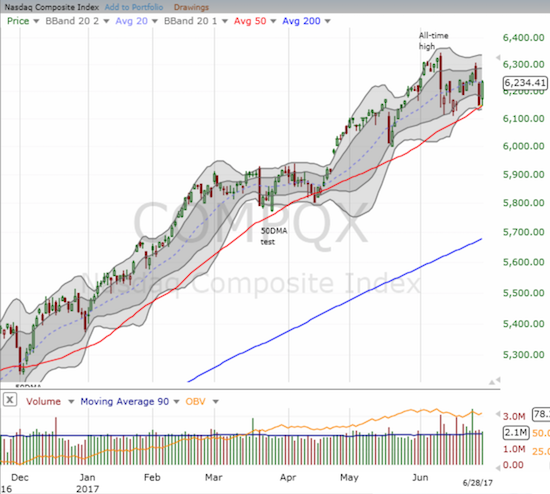
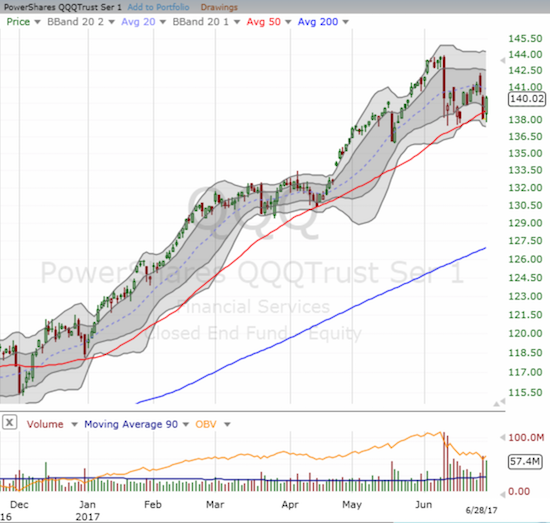
The rebound in the NASDAQ was a picture-perfect test of support at the 50-day moving average (DMA). QQQ pulled off a perfect fake breakdown: the low of the day dropped below yesterday’s low just ahead of QQQ rocketing higher to a 50DMA breakout. Amazon.com (AMZN) had one of the more dramatic turn-arounds with its low reaching within 4 points of its uptrending 50DMA support before turning higher. AMZN gained 1.4% on the day and closed at its high of the day (just below a now downtrending 20DMA). With tech back on top of its 50DMA, I will rest incrementally easier with my short-term trading call of cautiously bullish.
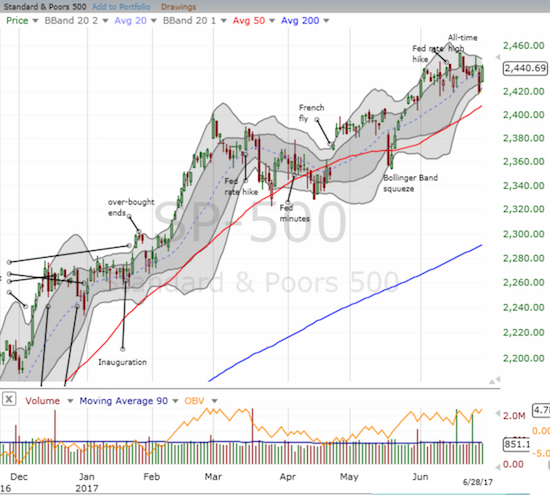
The S&P 500 (SPY) gained 0.9%. While the index under-performed the NASDAQ, it completely reversed yesterday’s loss.
AT40 (T2108), the percentage of stocks trading above their respective 40DMAs, launched back above 60%. With overbought conditions once again in sight, I feel even better about the bullish short-term trading call.
The strong rebound had the expected impact on the volatility index. The VIX closed at 10.0 and completely reversed its loss on Monday.
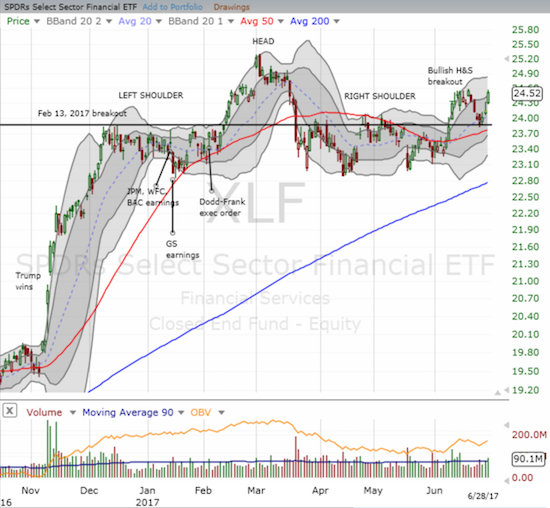
The financials were a source of optimism for the market. The U.S. Federal Reserve cleared the capital plans of the nation’s biggest banks. The spigots are now open for banks to return cash to shareholders. In response, the Financial Select Sector SPDR ETF (XLF) gained 1.6%. I sold my call options into the rally (although the chart is hinting to me that another bullish breakout is around the corner).
In forex, there were two big moves: the euro and the pound. The euro temporarily swooned after the European Central Bank (ECB) clarified that yesterday ECB President Mario Draghi did not intend to sound as hawkish as the market thought (based on the euro’s sharp rally). The ECB essentially tried to cool off the euro (FXE) before it really takes off. Traders listened long enough to send the euro reeling for all of 5 or 10 minutes. The British pound (FXB) rocketed higher after Governor Mark Carney acknowledged a reduction in stimulus in the near-future might be in the cards.
Combine these two big headlines and related currency moves along with a Canadian dollar where buyers could not get enough for a second straight day, and the U.S. dollar index (DXY0) experienced another bad day. The U.S. dollar index closed at a new 8-month low.
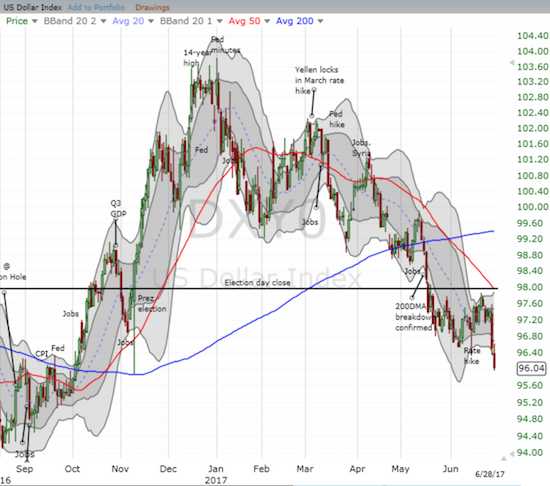
This fresh sell-off further confirms my on-going assertion that the dollar is in an extended weakening trend. Since the next catalyst from the Fed remains many months away, the U.S. dollar’s weakness likely has a lot further to run from this point.
Collectively, I saw many “statement buys” in financial markets today. The bullishness was a near 180 turn from the growing bearishness I observed over the past two days. Yet, once again, sellers conceded their ground, melted away, and cleared the path for buyers to step right back into the dominant position.
Be careful out there!
— – —
FOLLOW Dr. Duru’s commentary on financial markets via email, StockTwits, Twitter, and even Instagram!
“Above the 40” uses the percentage of stocks trading above their respective 40-day moving averages (DMAs) to assess the technical health of the stock market and to identify extremes in market sentiment that are likely to reverse. Abbreviated as AT40, Above the 40 is an alternative label for “T2108” which was created by Worden. Learn more about T2108 on my T2108 Resource Page. AT200, or T2107, measures the percentage of stocks trading above their respective 200DMAs.
Active AT40 (T2108) periods: Day #343 over 20%, Day #157 over 30%, Day #24 over 40%, Day #3 over 50% (overperiod), Day #6 under 60% (underperiod), Day #103 under 70%
Daily AT40 (T2108)
")
Black line: AT40 (T2108) (% measured on the right)
Red line: Overbought threshold (70%); Blue line: Oversold threshold (20%)
Weekly AT40 (T2108)

*All charts created using freestockcharts.com unless otherwise stated
The charts above are my LATEST updates independent of the date of this given AT40 post. For my latest AT40 post click here.
Related links:
The T2108 Resource Page
You can follow real-time T2108 commentary on twitter using the #T2108 or #AT40 hashtags. T2108-related trades and other trades are occasionally posted on twitter using the #120trade hashtag.
Be careful out there!
Full disclosure: long call options for QQQ, net short pound and net long the euro, short AUD/JPY
*Charting notes: FreeStockCharts.com uses midnight U.S. Eastern time as the close for currencies.