
AT40 = 54.2% of stocks are trading above their respective 40-day moving averages (DMAs)
AT200 = 56.6% of stocks are trading above their respective 200DMAs
VIX = 10.0 (volatility index)
Short-term Trading Call: cautiously bullish
Commentary
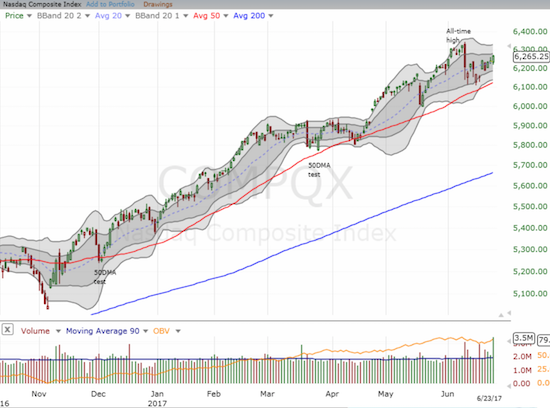
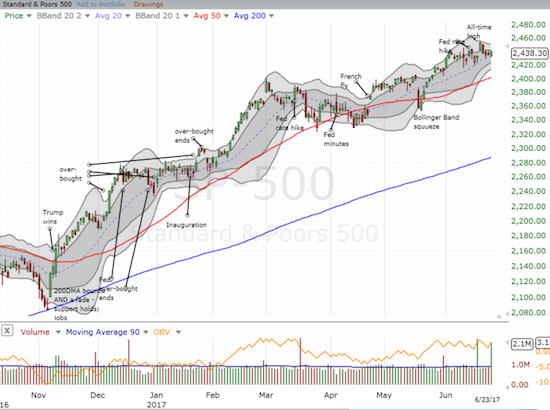
Last week, the NASDAQ snatched the baton from the S&P 500 (SPY) and now looks poised to resume its run of all-time highs.
As a result of the latest recovery, I am looking to continue trading call options on PowerShares QQQ ETF (QQQ). My efforts to try to pick the short-term winners among the big cap tech stocks last week felt like herding cats. It was telling that all my profits came from QQQ call options. Apple (AAPL) was a glaring exception to my long bias. For the first time in a long time I swung at put options. While the trade was not successful, I remain wary as AAPL continues to struggle underneath its 50-day moving average.
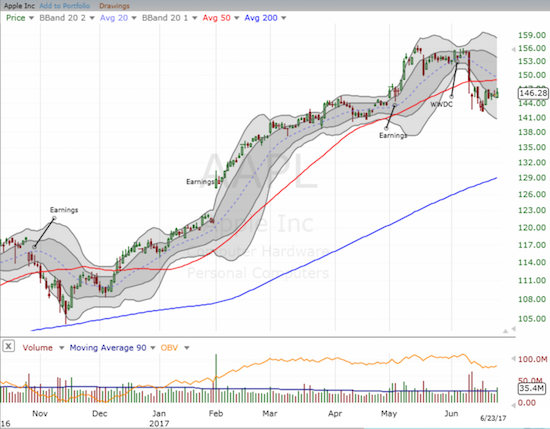
AAPL is the worst relative performer of the “usual suspects.” Here is a quick review:
- Facebook (FB): Never closed below its 50DMA and on Friday made a new (marginal) all-time high.
- Amazon.com (AMZN): Never closed below its 50DMA and at one point traded above its all-time closing high.
- Netflix (NFLX): Closed above its 50DMA on Friday as it rallied for a 2.0% gain.
- Alphabet (GOOG): Never even touched its 50DMA and on Friday closed above its 20DMA.
- Nvidia (NVDA): Never closed below its closing low from June 9th and bounced off 20DMA support.
@debbiecarey – sure. This is just a charting exercise. $FB bounced off 50DMA so that may be the low. If it breaks, $140 to $145 (buy dips)
— Duru A (@DrDuru) Jun. 10 at 01:17 PM
AT40 (T2108), the percentage of stocks trading above their respective 40DMAs, ended the week on a strong note. My favorite technical indicator jumped 4 percentage points to close at 54.2%. AT40 ended the previous week at 56.7%. The volatility index, the VIX, dropped to 10.0 and sits right at the edge of a new 14-year low.
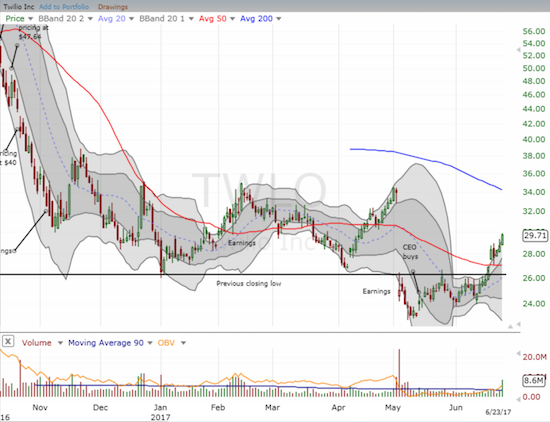
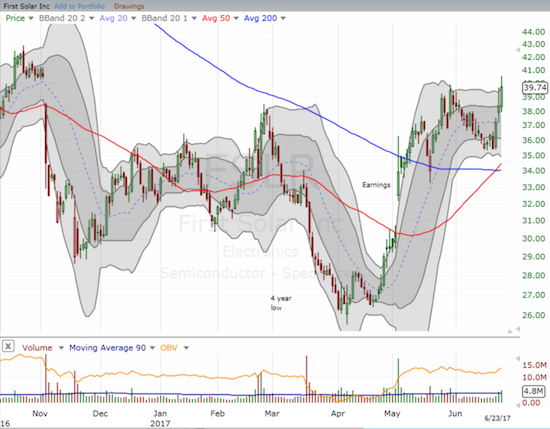
I closed out two important trades on Friday: Twilo (TWLO) and First Solar (FSLR).
On May 16th, I noted my change of heart on TWLO thanks to the CEO’s purchase of shares. My call option form that trade became deep in the money and more than doubled. At that point, I risked a lot of capital, not to mention profit, continuing to sit on my October expiration. So I locked in the profits, and I am looking to flip those profits right back into new call options and then ride on the “house’s money.”
FSLR was a much more complicated and extended trade. In late August I warned that FSLR looked like a value trap. A month later, I sold a long-term put option (expiring January, 2018) on FSLR based on buying that met my rules for bottom-fishing. The roller coaster that is FSLR continued from there. I felt like a genius for a little over a month. After that, FSLR plunged below the price where I sold the put option, it rallied back three separate times before succumbing to a 4-year low at the end of March, 2017. A rally from there was capped by last week’s Trump-driven rally: the market suddenly got inspired by the prospect of Trump draping solar panels over a Mexican border wall in order to generate income to pay for the project. That moment of giddiness seemed like a perfect time to close out my trade. While FSLR barely traded above the point at which I sold the put option, enough time premium had eroded to reduce the value of the put by 50%. It was a fresh reminder on the value of selling long-term puts on strong companies facing significant selling pressure.
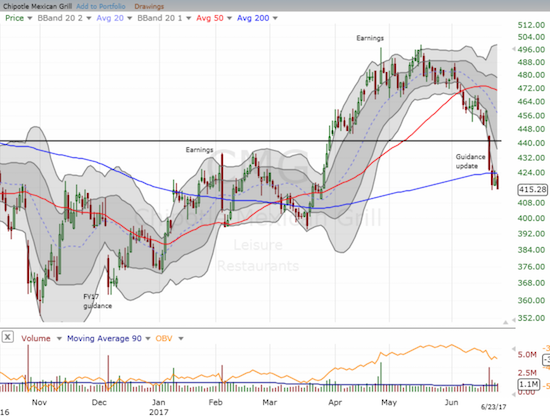
On the bearish side, I threw up the white flag on Chipotle Mexican Grill (CMG). On June 20th, I speculated on a call option to play (hopeful) support at the 200DMA. The next day CMG cleaved right through that support and destroyed my call option. When CMG rallied the next day back to 200DMA resistance, I speculated on a put option. Sure enough, CMG promptly sold off again on Friday and generated enough profit on my put option to pay for most of my call option. CMG confirmed its 200DMA breakdown and now looks at risk for trading well below $400 again.
Also on Friday, I dove into the rapidly expanding blast radius that I will now call “the Amazon Panic.”
Fresh $AMZN panic. I think $SYY way overdone. Now Jan18 55 call options are flying. I am a buyer. #122trade pic.twitter.com/nMgCwbm3Ah
— Dr. Duru (@DrDuru) June 23, 2017
Sysco (SYY) is a very solid food service company. Yet, JP Morgan (JPM) dropped SYY from its focus list as an analyst there wrote of fears that AMZN could soon disrupt the entire food distribution business. I think such a fear is very premature and fails to take into account any competitive responses from the likes of SYY. I started my position by selling a long-term put option and buying a small amount of shares. I will continue accumulating on further weakness.
Finally, I completed a tranche of call options on the Financial Select Sector SPDR ETF (XLF). I was hoping for a pullback from XLF’s bullish breakout, and I got it last week. Now I need the 50DMA to hold as support…
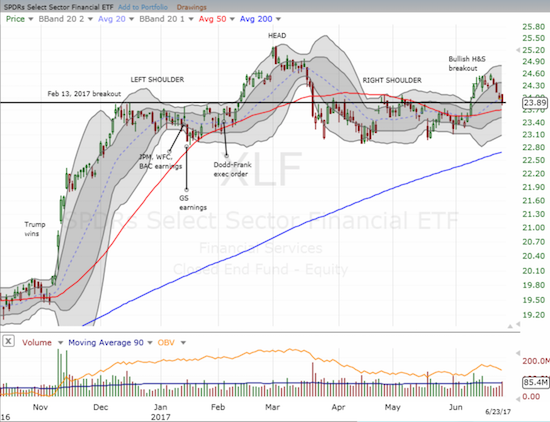 The Financial Select Sector SPDR ETF (XLF) completed a reversal of its bullish breakout. Can 50DMA support help launch fresh momentum?[/caption]
Be careful out there!
— – —
FOLLOW Dr. Duru’s commentary on financial markets via email, StockTwits, Twitter, and even Instagram!
“Above the 40” uses the percentage of stocks trading above their respective 40-day moving averages (DMAs) to assess the technical health of the stock market and to identify extremes in market sentiment that are likely to reverse. Abbreviated as AT40, Above the 40 is an alternative label for “T2108” which was created by Worden. Learn more about T2108 on my T2108 Resource Page. AT200, or T2107, measures the percentage of stocks trading above their respective 200DMAs.
Active AT40 (T2108) periods: Day #341 over 20%, Day #155 over 30%, Day #22 over 40%, Day #1 over 50% (overperiod), Day #4 under 60% (underperiod), Day #101 under 70%
Daily AT40 (T2108)
")
Black line: AT40 (T2108) (% measured on the right)
Red line: Overbought threshold (70%); Blue line: Oversold threshold (20%)
Weekly AT40 (T2108)

*All charts created using freestockcharts.com unless otherwise stated
The charts above are my LATEST updates independent of the date of this given AT40 post. For my latest AT40 post click here.
Related links:
The T2108 Resource Page
You can follow real-time T2108 commentary on twitter using the #T2108 or #AT40 hashtags. T2108-related trades and other trades are occasionally posted on twitter using the #120trade hashtag.
Be careful out there!
Full disclosure: long XLF call options, short SYY put option, long NVDA call spread and put options
*Charting notes: FreeStockCharts.com uses midnight U.S. Eastern time as the close for currencies.
It’s tough out there except for those selling volatility and going long SPX. I think I could even join the club soon. Nah, I think I will just scalp oil and wait for a buy around $40, although it is looking unhealthy lately and I’m not sure that will hold.
I finally sold out of the long cad position, having run out of patience. There is no way the BOC or RBA will hike rates soon. I suspect they will talk but not pull the trigger this year. Not with signs of a China slowdown looming again and oil where it is.
Thanks for the article on cocoa. Very interesting and I am watching to see if the bottom holds. With the recent behaviour, I think it is going to go below the previous low. It could head to the 2004 low of 1300 where I would be an buyer. The only thing I see linking the Ag weakness is China. If AGS are so weak, I wonder when this will carry through to dairy. I initiated a small short NZD position today.
You are right on the euro, spec positioning doesn’t mean much at these levels. What will affect eur and JPY is if capital outflows become less or reverse.
Keep scalping!
The action on CAD has come to a screeching halt but keep it on the radar. It will make a fresh big move at some point in the near future. I also don’t think the RBA or BoC will be in ANY hurry to raise rates. They are enjoying watching the Fed hike rates from the sideline. RBA in particular is STILL waiting for major weakness from Fed rate hikes.
I think speculators are providing incremental pressure on ags, so not sure whether dairy will get hit. I saw today that China finally started accepted beef imports from the US again after a 14-year block. This must have been what helped COW elevated recently. I missed today’s pop, but I hope it is not too late to buy!