
AT40 = 47.1% of stocks are trading above their respective 40-day moving averages (DMAs)
AT200 = 54.7% of stocks are trading above their respective 200DMAs
VIX = 10.8 (volatility index)
Short-term Trading Call: cautiously bullish
Commentary
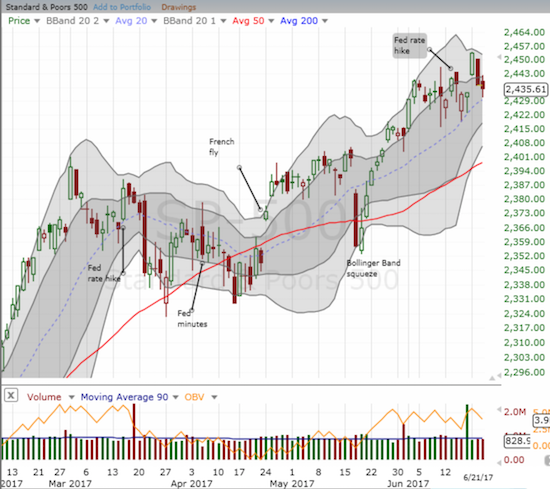
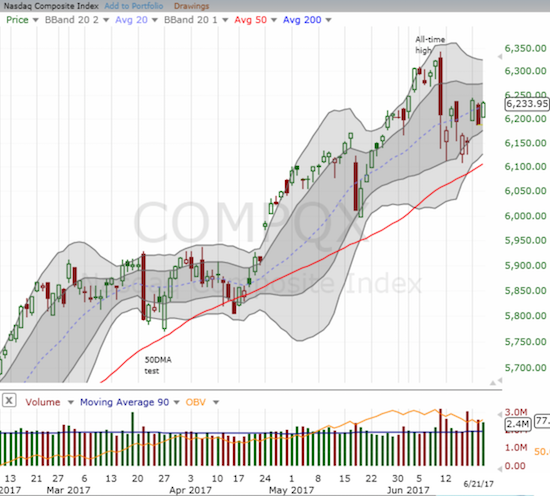
Like two ships passing in the night, the NASDAQ, including the PowerShares QQQ ETF (QQQ), took back its advantage in the game of relative performance over the S&P 500 (SPY). The S&P 500 lost just over a point on the day and at one point finished filling Monday’s impressive gap up. The NASDAQ started strong and stayed strong enough to return to the week’s high (a 0.8% gain).
Having forgone the opportunity on Monday to lock in profits on my QQQ call options, I jumped at that same chance today. The options expire Friday so I could not afford the risk of another setback. Unfortunately my likely loss on the call options on ProShares Ultra VIX Short-Term Futures (UVXY) will exceed those profits. The volatility index, the VIX, lost 1.0% on the day while UVXY lost 2.1%.
While none of these moves – SPY, QQQ, or UVXY – are particularly notable by themselves, they stand in contrast to AT40 (T2108), the percentage of stocks trading above their respective 40DMAs. AT40 dropped from 52.8% to 47.1%, back to a 2-week low.
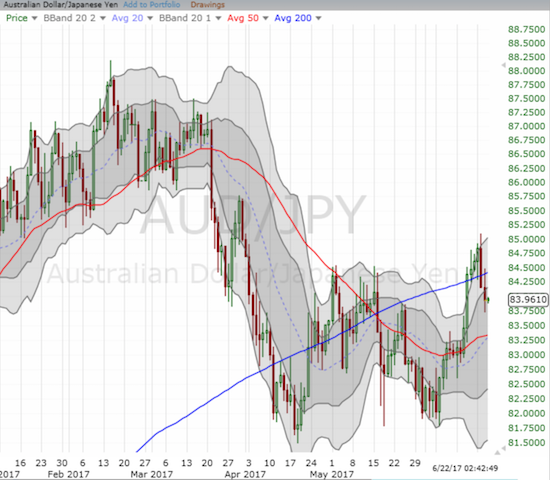
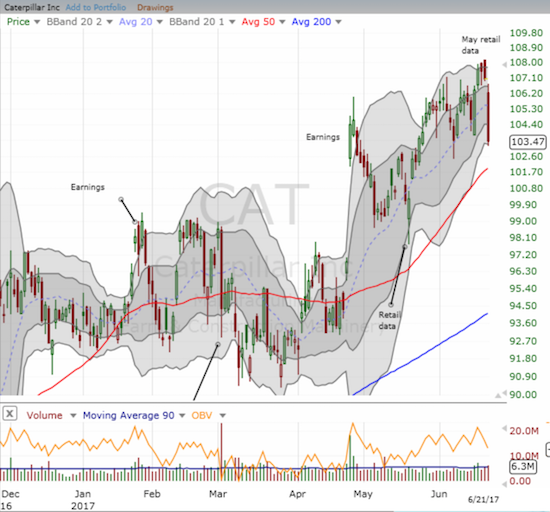
Adding to the warning signs were two other favorite indicators: the Australian dollar (FXA) versus the Japanese yen (JPY) or AUD/JPY and Caterpillar (CAT). I just finished applauding AUD/JPY as a confirmation of the bullish tone of the market. My favorite forex indicator cracked 200DMA support on Tuesday and the selling continued on Wednesday.
I did not see any news to explain Wednesday’s sudden high-volume 3.3% loss. Perhaps it was a much delayed reaction to May’s retail data reported on Tuesday? Until proven innocent, I am interpreting CAT’s selling as bearish. I already have one put option in place, but I probably need a lot more soon.
Some of the usual suspects were at work contributing to the weakness in AT40 – retail, energy, and mid-caps. Some auto-related stocks and shoe retailers cowered in the center of retail ugliness today.
Carmax, Inc. (KMX) reported strong headline earnings. In response, the stock gapped up and gained over 7% at its high. After that, the stock completely imploded. In an earlier Above the 40 post I noted I was going to look for a post-earnings excuse to get short KMX again. However, based on the open, I thought KMX could rally to a 10% gain or higher. So I failed to pull the trigger until KMX bounced off its low of the day toward 200DMA resistance. Even then, I took half a position and bought a call option as a hedge.
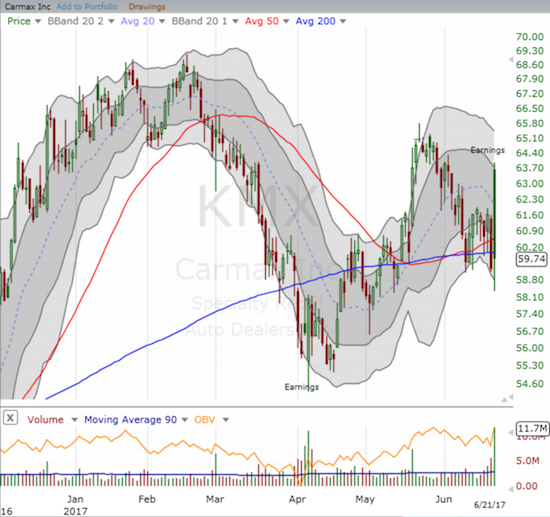
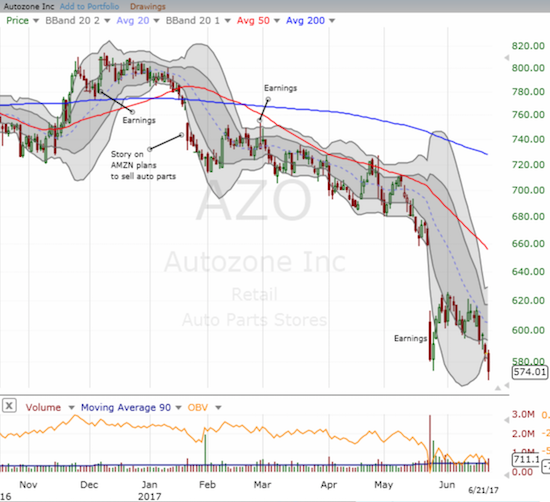
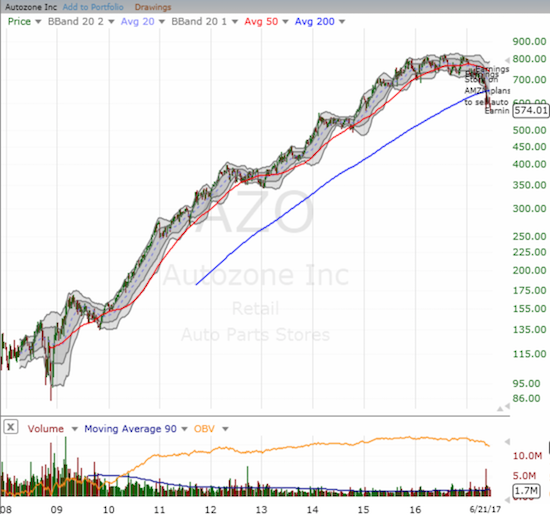
KMX managed to close in the green, but auto parts stocks were not so lucky. For example, Autozone (AZO) lost 1.9% and closed at a near 2 1/2 year low. The daily chart shows how pesky Amazon.com (AMZN) rumors presaged the current troubles (AMZN is like a phantom looming menacingly in retail’s shadows!); AZO is down 22% since then.
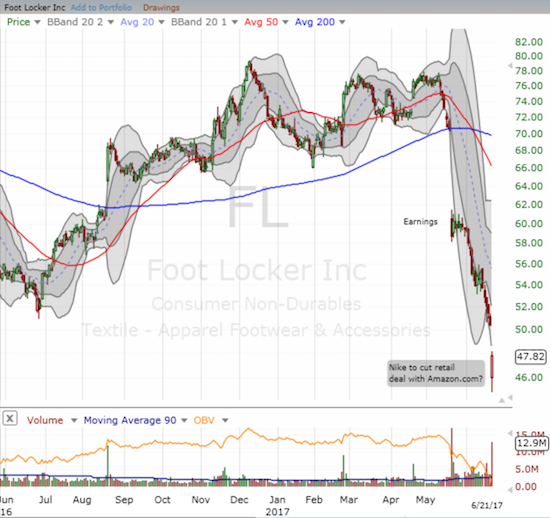
Footlocker (FL) led the way down for shoe retailers as Goldamn Sachs (GS) released a report claiming that Nike (NKE) is close to signing a direct distribution deal with Amazon.com (AMZN). FL was down around 10% at its lows before buyers stepped up. Given FL’s existing troubles, I expect the selling to resume in due course. Note that while FL has lost 39% since mid-May, the stock is still on an incredible post-recession run after trading in the low single digits at one point!
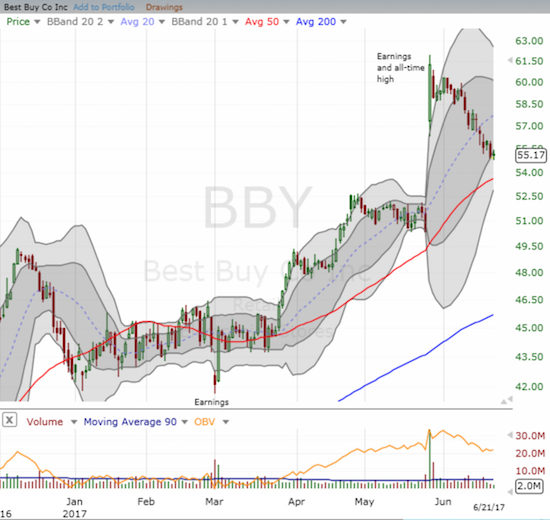
Last month, Best Buy (BBY) was providing some anti-Amazon hope for retail. After earnings, BBY rocketed up to an all-time high, and I noted the irony given how often BBY was supposed to be doomed by competition from AMZN. Yet, BBY failed to maintain the momentum. The post-earnings rule to fade BBY at the open is now up 3.9%. I think a test of uptrending 50DMA support is coming if not an outright gap fill. Note carefully how volume fell off a cliff over the past three days: a 50DMA test could be a major buying opportunity.
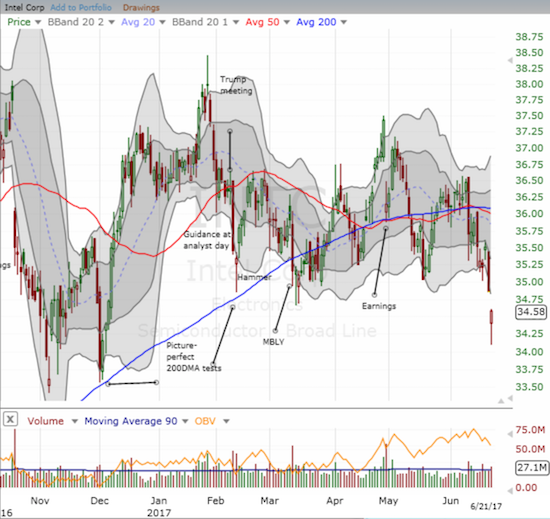
Intel (INTC) is falling behind the big cap tech pack. My last tranche of the “between earnings trade” looks like a complete bust as INTC this week confirmed a 50/200DMA breakdown and even gapped down today. Analysts have come after INTC with downgrades. I do not know what to make of this beating, but I suspect I might try a pre-earnings play next month.
The mood is very different in the biotech sector. The iShares Nasdaq Biotechnology (IBB) rocketed 4.1% today on a second day of very high buying volume. IBB is above its price of every single “bash” except Hillary Clinton’s first campaign-related bash from almost two years ago. IBB finally looks poised to overcome that last hurdle.
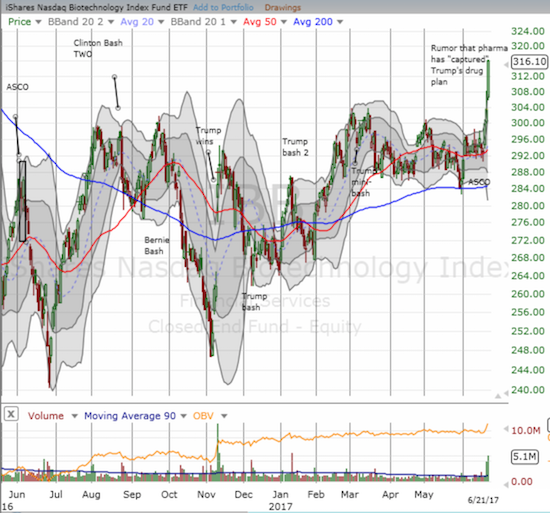
If current rumors are true, IBB should trade above all the recent bashes. Apparently, the drug price plan coming from the Trump administration will fall far short of Trump’s campaign and presidential promises. The rumors are apparently coming to a climax this week after a report from Politico titled “Trump’s drug price ‘remedy’ expected to be industry friendly” last Friday. From the article:
“The administration is not proposing, as Trump did on the campaign trail, that the government negotiate drug prices or allow the importation of cheaper drugs from abroad. At a meeting Friday, top Trump administration officials reportedly made little progress on even on more modest goals that are said to be an executive order on drug prices, which the White House is pushing to release…
‘Our industry sources indicate that pharma expects it has successfully shifted the dialogue from the high price of innovation to transparency and other parts of the supply chain,’ Wells Fargo analyst David Maris wrote in a note to investors Thursday evening. ‘As such, several drug company executives have expressed the belief that Trump’s drug price approach will not include drug re-importation and Medicare negotiation of drug prices.’
The industry’s growing confidence comes in part from the presence of key allies in the White House: Joe Grogan, OMB’s director of health programs, is working on the executive order, according to multiple sources inside and outside of the government. Grogan spent the last five years as the head of federal affairs for Gilead Sciences — the drug company that helped ignite the drug pricing debate in 2013, when it set the price of a new hepatitis C treatment at more than $80,000.”
Buying IBB in the wake of THAT article would have made for a great Trump Trade.
Be careful out there!
— – —
FOLLOW Dr. Duru’s commentary on financial markets via email, StockTwits, Twitter, and even Instagram!
“Above the 40” uses the percentage of stocks trading above their respective 40-day moving averages (DMAs) to assess the technical health of the stock market and to identify extremes in market sentiment that are likely to reverse. Abbreviated as AT40, Above the 40 is an alternative label for “T2108” which was created by Worden. Learn more about T2108 on my T2108 Resource Page. AT200, or T2107, measures the percentage of stocks trading above their respective 200DMAs.
Active AT40 (T2108) periods: Day #339 over 20%, Day #153 over 30%, Day #20 over 40%, Day #7 over 50% (overperiod), Day #2 under 60% (underperiod), Day #99 under 70% (corrected from June 9, 2017 post by doing complete recount!)
Daily AT40 (T2108)
")
Black line: AT40 (T2108) (% measured on the right)
Red line: Overbought threshold (70%); Blue line: Oversold threshold (20%)
Weekly AT40 (T2108)

*All charts created using freestockcharts.com unless otherwise stated
The charts above are my LATEST updates independent of the date of this given AT40 post. For my latest AT40 post click here.
Related links:
The T2108 Resource Page
You can follow real-time T2108 commentary on twitter using the #T2108 or #AT40 hashtags. T2108-related trades and other trades are occasionally posted on twitter using the #120trade hashtag.
Be careful out there!
Full disclosure: long INTC call options, short KMX, long KMX call option, long CAT put option, short AUD/JPY, long FL put spread and call options, long AMZN call option, long GS call options
*Charting notes: FreeStockCharts.com uses midnight U.S. Eastern time as the close for currencies.