
AT40 = 52.1% of stocks are trading above their respective 40-day moving averages (DMAs)
AT200 = 55.4% of stocks are trading above their respective 200DMAs
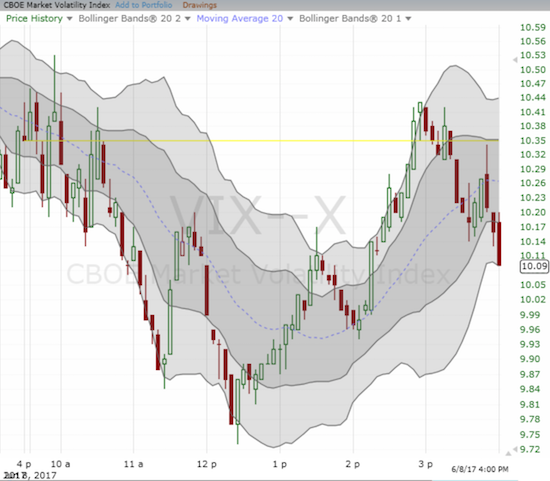
VIX = 10.2 (volatility index)
Short-term Trading Call: cautiously bullish
Commentary
One out of three.
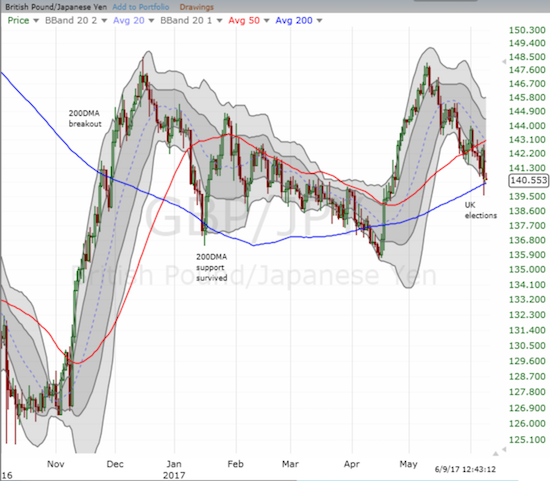
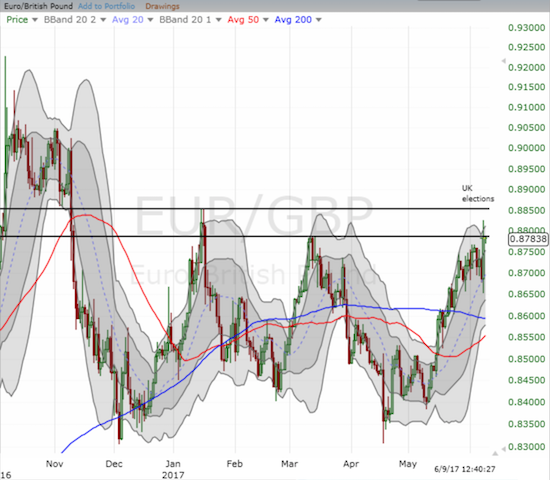
The last event of Thursday’s Trifecta had the only notable impact on financial markets. With exit polls tabulated, news arrived that the Tories in the U.K. will not have a majority in Parliament although they will be the largest of the parties. The British pound (FXB) immediately sold off on the news. Against the dollar (GBP/USD), the pound broke through uptrending support at the 50-day moving average (DMA) that had held since the last pullback. Against the yen (GBP/JPY), the pound broke through 200DMA support but bounced back. The move against the euro (EUR/GBP) did not generate much of technical significance as upper resistance seems to be holding firm.
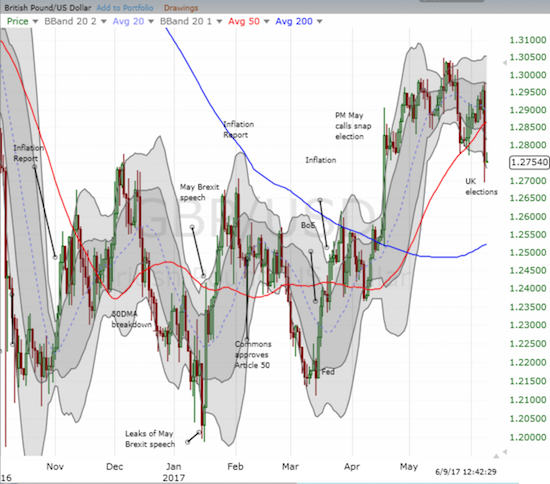
Prime Minister Theresa May called the election in the hope that she could parlay a strong showing into a stronger negotiating position with the European Union over terms of Brexit that she would control. Now that May’s gambit has failed, the pound will likely, over time, erase all its gains from the day May surprised markets with the call for elections (April 18th). Now markets must once again take seriously the prospect of political uncertainty over Brexit. Yet, it is instructive to note how the market’s interpretation of Brexit has evolved. When voters approved Brexit, the pound practically crashed on fears that Brexit would ruin the UK economy. With the economy performing much better than initially expected, financial markets have tended to interpret May’s “hard Brexit” approach (a complete and clean extrication from European Union rules and regulations) as a positive. The market now wavers on the prospect that the UK could still give in to some EU mandates. At a minimum, the return of uncertainty will make the pound once again particularly sensitive to daily Brexit headlines. First off, will Theresa May be forced to resign?
For now, I imagine that the pound will stabilize going into European trading and perhaps even mount a substantial relief rally going into U.S. trading. I am preparing to fade such a rally.
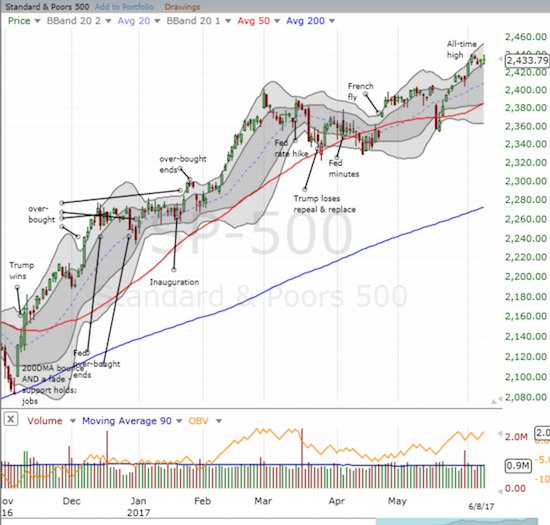
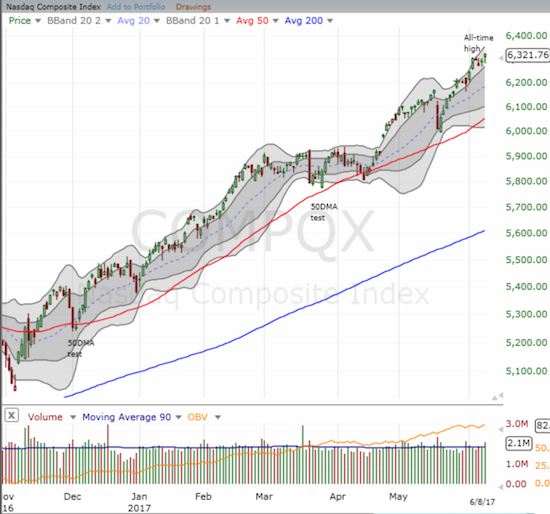
Stateside, the S&P 500 (SPY) bid its time for the day, idling between the highs and the lows of the day. The political drama of former FBI Director James Comey’s Congressional testimony barely registered on the general stock market. Indeed, under the covers, bullish waves kissed the shores all day. For example, the NASDAQ (QQQ) closed at another all-time high. The Financial Select Sector SPDR ETF (XLF) rallied for an impressive 1.2% gain that closed the ETF above its 50DMA. The small breakout briefly took XLF above February’s breakout line and brought XLF much closer to the edge of a very bullish invalidation of the on-going head and shoulders pattern.
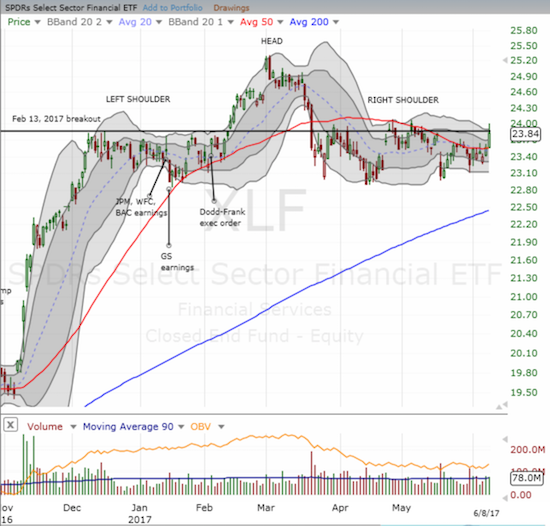
I continue to watch financials closely. Today’s move was attributed to a House vote to roll back most of Dodd-Frank regulation of the financial industry, but it seems unlikely the Senate will go along with this vote. So for now a technical review suffices. A clean breakout above the right shoulder of the H&S pattern will likely motivate me to upgrade my short-term trading call on the entire market from cautiously bullish to bullish. A lot of the action may hinge on the market’s response going into and exiting the U.S. Federal Reserve’s pronouncement on monetary policy next week (June 14th).
The financials were likely a big part of the reason that AT40 (T2108), the percentage of stocks trading above their respective 40-day moving averages (DMAs), soared by 5 percentage points. At the high of the day, AT40 gained 7 percentage points. This near bullish divergence with the flat S&P 500 was significant; it paved the way for me to think incrementally more positively about the market’s underlying foundation.
The volatility index provided the final word on market sentiment. The VIX gapped down at the open and only traded in the green for brief spurts shortly after the open and near the close. Clearly, the market was largely satisfied with the day’s activities.
Beyond the indices and ETFs, three stock-specific, mostly bullish themes caught most of my attention on the day: steel, retail (apparel), and autos.
Steel
On May 31, 2017, Peter Najarian of Najarian Family Office (also a host/guest on CNBC’s Fast Money) appeared on Nightly Business Report on a new segment called “Investor’s Edge” to discuss his method for making money by tracking the trades of big institutional investors. His commentary on steel was particularly noteworthy:
“I own both of these, U.S. Steel and AK Steel. U.S. Steel is symbol X, AK Steel is AKS. And both of these have been seeing some decent money flow after a big selloff.
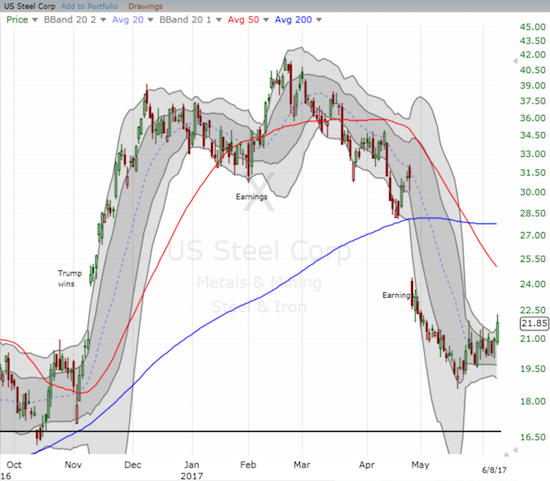
I mean, they were betting on the infrastructure spending that President Trump talked about. It didn’t happen. They came all the way back down to where they were before the election. And now, people are betting maybe something happens in the second half of the year, and they want to get in for the last month of the second quarter.”
While I am not interested here in betting on Trump’s promises for the future, I am interested in following market sentiment. Today, U.S. Steel (X) and other steel-related stocks soared on more tariff news. With U.S. Steel rallying well above its upper-Bollinger Band (BB), I decided to lock in profits. Najarian claims that the steel trade is a second half story so this trade should have room to run. I just do not want to sit still in steel longer than needed.
(Click here to go directly to the Najarian segment)
Retail (Apparel)
I have periodically chronicled the trials and tribulations of the retail sector. In the last Above the 40 post, I took a look at the ugly and the pretty extremes. Somewhere in the middle sits Nordstrom (JWN). Ahead of the bulk of earnings for retailers, NBR brought in a retail analyst whom I recognized as having a particularly good track record. He claimed that certain luxury retailers like Nordstrom should survive the on-going carnage in retail. That nod caught my attention as JWN has stayed on my radar ever since I called it out as a Trump “Volatility Trade” after the Ivanka kerfuffle (sorry, I have always wanted to find a reason to use that word!).
After JWN plummeted in the wake of its May earnings report, I bought shares and then loaded up on a call spread for good measure with a long-term expectation. However, the retail sell-off that Macy’s (M) sparked this week made me forget my original strategy. I stopped the bleeding in the shares and decided to just ride out the call spread. Imagine my mix of delight and dismay when I discovered this morning that JWN gapped up a whopping 7 points, or almost 20%!
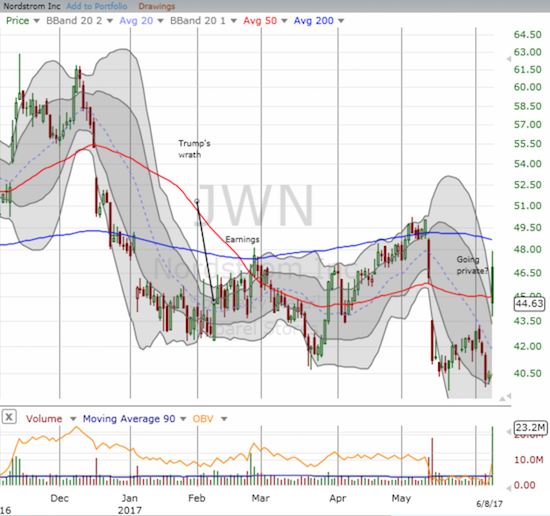
JWN lost half its gain by the close as a testament to the weight of bearishness in retail. If I still had my shares I certainly would have locked in my profits right at the open. Instead, I decided to keep holding my long-term call spread in deference to my earlier strategy. I treated the fade as a gift and bought back half my original position of shares. I will definitely snatch back the other half if the market grants me that opportunity. JWN has become a retail value play and the prospect of going private should provide major support to that value.
Cars
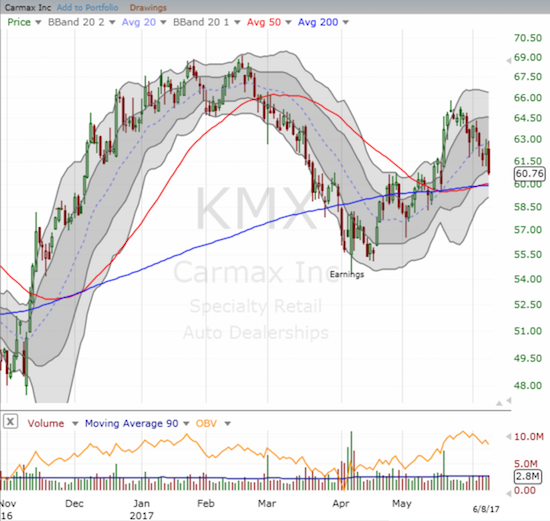
Talk of peak auto has gone on for a few years. The stocks of General Motors (GM) and Ford (F) peaked all the way back in 2013/2014. I have mainly watched this story from the sidelines. Last year, I learned about new models for selling used cars that seek to reduce transaction costs and increase convenience. Shift, founded by Minnie Ingersoll (B.S. computer science, MBA and 11 years at Google (GOOG)), seems particularly promising: for example, see “Minnie Ingersoll: A drive to disrupt.” It occurred to me that if this model works, established dealers like Carmax (KMX) will eventually get shoved out the way. Since then, KMX has experienced three main swoons with another one likely underway now. My latest short position is now back in the green. KMX is still up since I got my original bearish idea, so I know the market has yet to get concerned about potential future industry disruption. (At some point, I hope to write in detail on this space given I know someone who used Shift to buy a car after I made a recommendation).
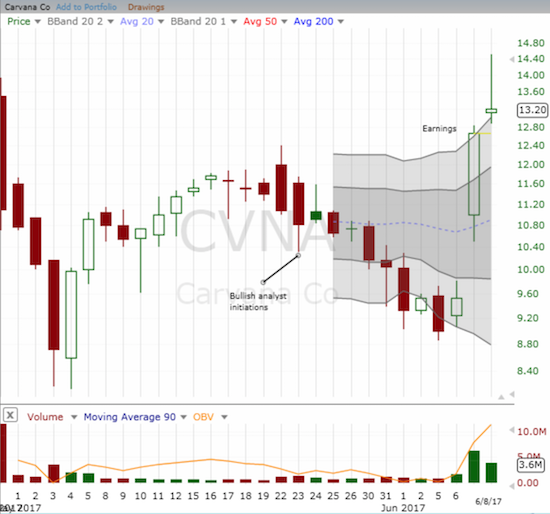
Along the way, I stumbled upon Carvana (CVNA). The company went IPO on April 28, 2017. I first learned about it after seeing the initiation of analysts on May 23. When I discovered that the company sells cars through vending machines, I scoffed. Yet, unlike Snapchat (SNAP) where I treated analyst initiations with tremendous skepticism, I decided to give CVNA a swing as pure speculation. Within days I had to sell to stop the bleeding. Unlike SNAP again, CVNA managed to report earnings that greatly pleased investors and traders. The stock soared to a closing all-time high and landed right back on my radar. The stock soared again today only to fade back to its upper-BB. I snapped up a small number of shares right there to re-speculate.
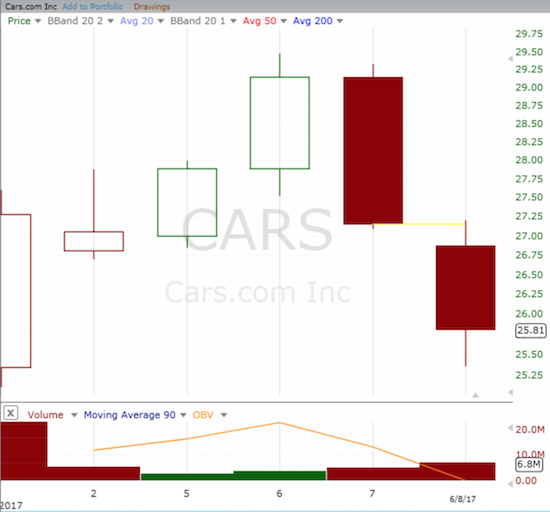
And then there is Cars.com (CARS). I first stumbled on this spin-off in conjunction with news that IHS Markit (INFO) would join the S&P 500 index to replace TEGNA Inc. (TGNA) which planned to spin off CARS at the time. For three of the first 4 days, CARS did well. Based on that strength, I bought the dip on day #5. Much to my dismay, CARS continued to fall today. I doubled down with an eye to stop out at or near a close below the all-time intraday low. (I first learned about the out-sized potential of investing in spin-offs from “You Can Be a Stock Market Genius: Uncover the Secret Hiding Places of Stock Market Profits“).
Be careful out there!
— – —
FOLLOW Dr. Duru’s commentary on financial markets via email, StockTwits, Twitter, and even Instagram!
“Above the 40” uses the percentage of stocks trading above their respective 40-day moving averages (DMAs) to assess the technical health of the stock market and to identify extremes in market sentiment that are likely to reverse. Abbreviated as AT40, Above the 40 is an alternative label for “T2108” which was created by Worden. Learn more about T2108 on my T2108 Resource Page. AT200, or T2107, measures the percentage of stocks trading above their respective 200DMAs.
Active AT40 (T2108) periods: Day #326 over 20%, Day #146 over 30%, Day #13 over 40% (overperiod), Day #2 under 50% (underperiod), Day #28 under 60%, Day #98 under 70% (corrected from June 2, 2017 post)
Daily AT40 (T2108)
")
Black line: AT40 (T2108) (% measured on the right)
Red line: Overbought threshold (70%); Blue line: Oversold threshold (20%)
Weekly AT40 (T2108)

*All charts created using freestockcharts.com unless otherwise stated
The charts above are my LATEST updates independent of the date of this given AT40 post. For my latest AT40 post click here.
Related links:
The T2108 Resource Page
You can follow real-time T2108 commentary on twitter using the #T2108 or #AT40 hashtags. T2108-related trades and other trades are occasionally posted on twitter using the #120trade hashtag.
Be careful out there!
Full disclosure: long UVXY call options, short KMX, long CVNA, long JWN shares and call spread, long CARS, short GBP/JPY, long INFO
*Charting notes: QQQ is used as a proxy for a NASDAQ-related ETF, FreeStockCharts.com uses midnight U.S. Eastern time as the close for currencies.