
AT40 = 36.8% of stocks are trading above their respective 40-day moving averages (DMAs)
AT200 = 57.8% of stocks are trading above their respective 200DMAs
VIX = 13.0 (volatility index)
Short-term Trading Call: neutral
Commentary
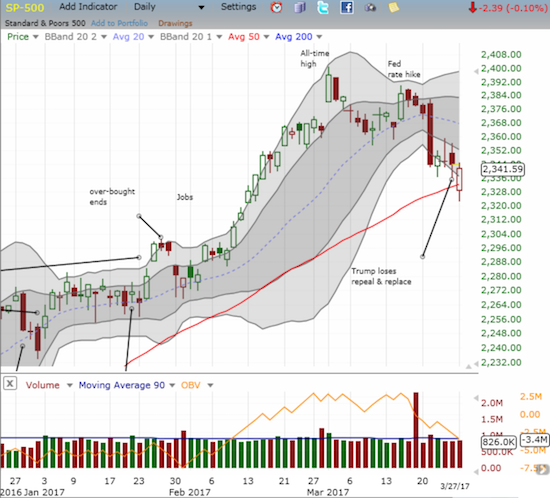
Imagine that, the S&P 500 (SPY) found buyers to defend support at its 50-day moving average (DMA).
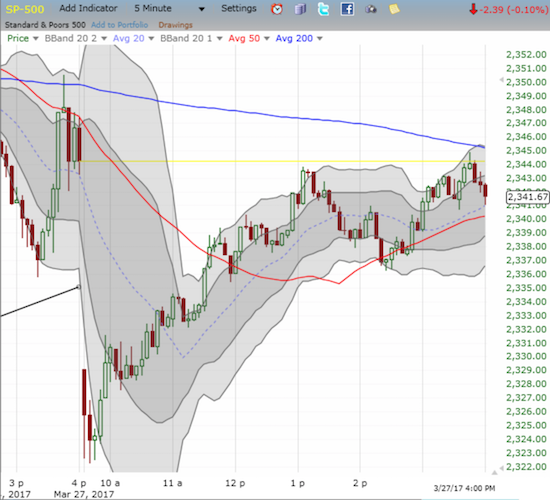
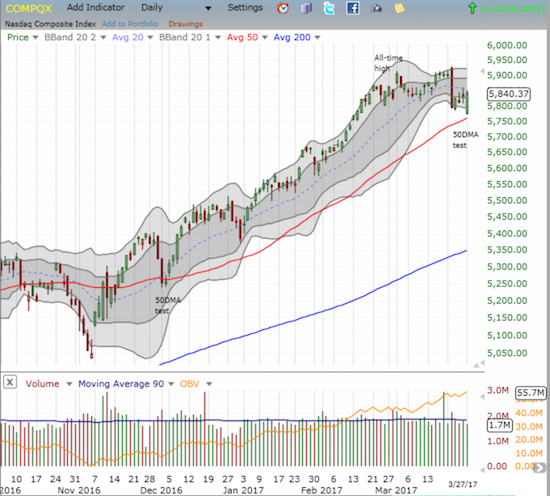
The NASDAQ (QQQ) did the S&P 500 one better by rallying exactly off its open to complete a successful test of 50DMA support. Sellers never even got 10 minutes of fame.
AT40 (T2108), the percentage of stocks trading above their respective 40DMAs, traded as low as 31.2%. Given the strong bounces on the day, this low could end up being “close enough” to oversold…not to mention that low happens to coincide with the low form the day after the U.S. Presidential election. As a result, I quickly flipped my trading call back to neutral from bearish. Consistent with this change of heart, I locked in (small) profits on my shares of ProShares UltraShort S&P500 (SDS).
Sold $SDS shares from bearish signal last week – https://t.co/12A0O8e54V #AT40 #T2108 $SPY $STUDY #122trade
— Dr. Duru (@DrDuru) March 27, 2017
An extremely harsh fade of the volatility index, the VIX, from its high of the day seemed to put an exclamation mark on the bottoms of the major indices.
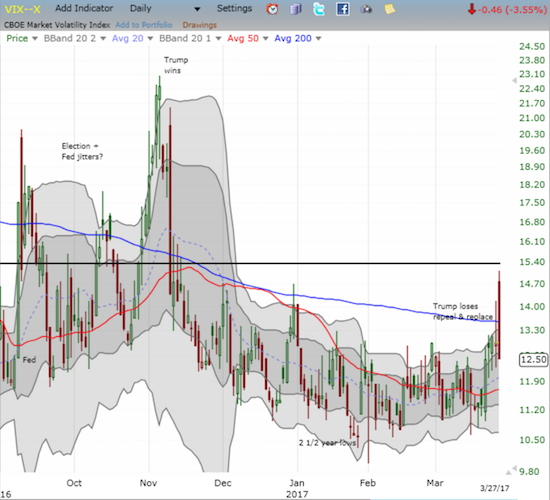
When I flipped to bearish last week, I warned that the bearish tidings might be short-lived: “However, note carefully that I am not aggressively bearish and certainly not calling for a big crash or sell-off in this moment. AT40 is already at low levels – just a little more selling will push me into considering the bullish case.”
I am NOT bullish given AT40 never fell into official oversold conditions. A close above the downtrending 20DMA (around 2367.50) WILL switch be to bullish as I will consider such a move to confirm the “close enough to oversold” encounter from today. I have learned from previous episodes to act on this reading sooner than later. Under these conditions I have often waited to get bullish when AT40 got back to overbought conditions, something not likely to happen anytime soon in this divergent market. I do not anticipate flipping back to bearish in the near-term because a fresh swoon downward will undoubtedly land the stock market into official oversold territory.
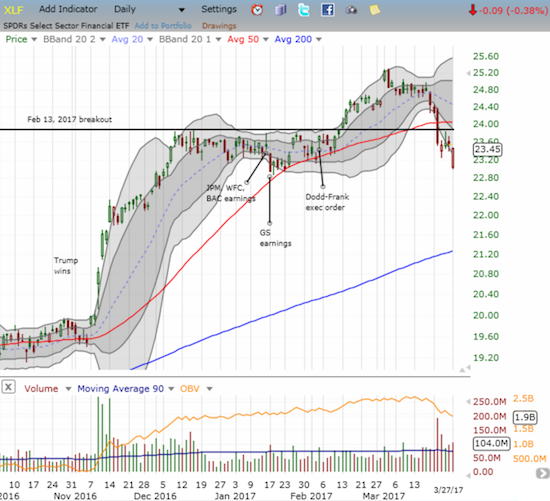
Having said that, financials remain a key trouble spot. The Financial Select Sector SPDR ETF (XLF) joined the rest of the market in rallying off its gapped open. Yet, XLF is below 50DMA resistance as well as its big breakout point from last month. The index is broken down until proven otherwise.
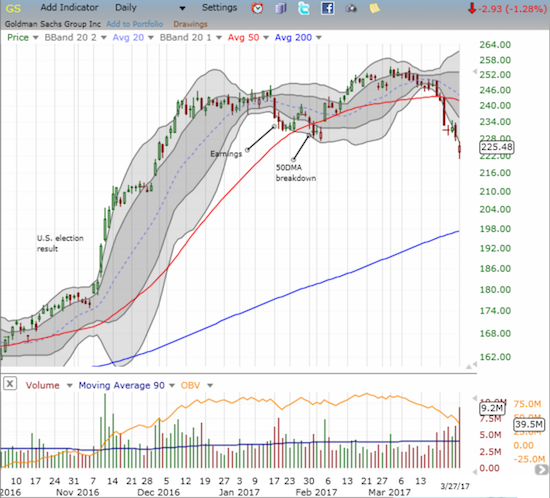
Goldman Sachs (GS) helped to weigh down financials. Its rally off the open fell short as it waned off its high of the day. GS was one of the few stocks I played off the open for a quick flip. The trade was doing well until that fade into the close. Quick profits quickly dissipated to zero (imploding volatility kills long options positions whether calls or puts!).
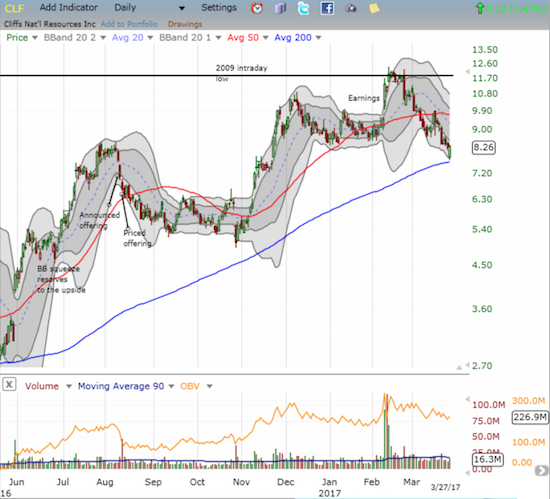
I scrambled to look for a commodity play. Cliffs Natural Resources (CLF) fit the bill as it tested critical support at its 200DMA. A close BELOW that support will be exceptionally bearish for CLF given the downtrend from the last high which coincided with the 2009 low. So this trade on call options is particularly speculative.
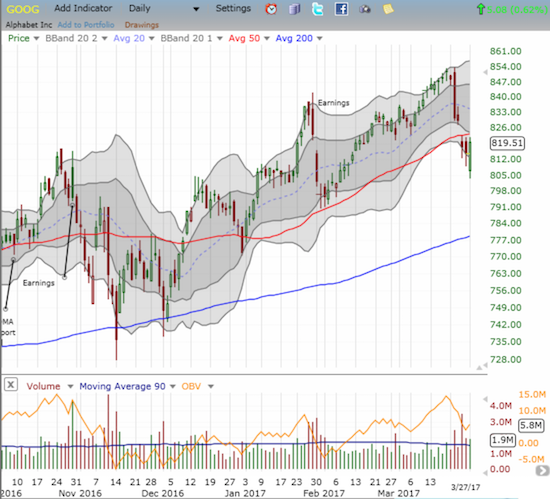
On the tech side of the ledger, Alphabet (GOOG) looks particularly interesting. The stock came into Monday’s trading already suffering from a convincing 50DMA breakdown under the weight of headlines of advertisers withdrawing from YouTube out of fears of placements with offensive material. In the previous days sellers pushed the stock to a lower low only to allow buyers to take the stock well off those lows. On Monday, sellers completely caved into a 0.6% gain on the day. Still, GOOG stopped just short of 50DMA resistance. Just ahead of the close I put on a hedged position of puts and calls in anticipation of a big move from here: breakout or confirmed breakdown. I am guessing odds favor a breakout since sellers seem to be losing their grip on the stock.
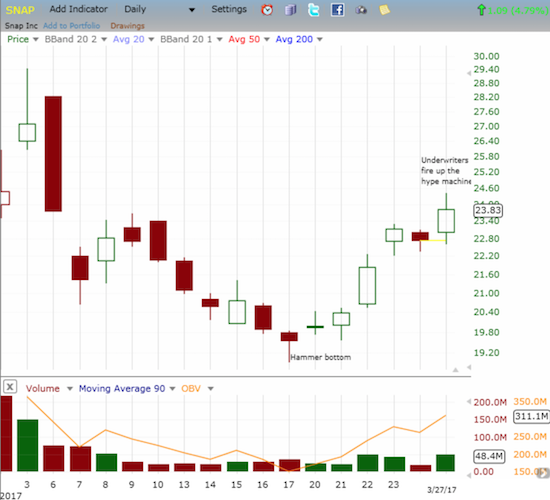
And then there was Snap, Inc. (SNAP). As I anticipated in earlier posts, the recent IPO’s underwriters came out swinging in defense of their baby. The deluge of optimism was a downright hype fest especially relative to analysts from firms who did not get in on the deal. From Bloomberg:
“Analysts of 13 banks that were underwriters on Snapchat’s IPO have issued recommendations on the company’s shares. Among those analysts, 69 percent issued “buy” recommendations or the equivalent, with a median price target of $27, according to an analysis of Bloomberg data. Of the 14 analysts whose firms didn’t work on the Snapchat IPO, only two (14 percent) said the company’s stock was worth buying. The median price target among those unaffiliated analysts is $21 a share.”
Here are some of the initiations with the institution, rating, and price target (where available) from briefing.com. I placed an asterisk by institutions who are NOT among the underwriters. Goldman and Morgan were the lead underwriters and received 25% and 30% respectively of the IPO shares…
- RBC Capital Markets: outperform, $31
- Jeffries, buy: $30
- Credit Suisse, outperform: $30
- Deutsche Bank, buy: $30
- JMP Securities, Mkt Outperform: $28
- William Blair, Outperform
- Morgan Stanley, Outperform: $28
- Oppenheimer, Perform
- Citigroup, buy: $27
- Goldman Sachs, buy: $27
- Cowen, outperform: $26
- *BofA/Merrill, neutral: $25
- JP Morgan, neutral: $24
- Stifel, hold: $24
- UBS, hold: $24
- *Summit Redstone, sell: $17
In the wake of this hype fest, Jim Cramer of Mad Money fame urged viewers to exercise discipline…
“…I get it. This is the year that all advertising firms are sampling Snap, so when you see the sales numbers they will be humongous, no doubt more than the current estimates of even the biggest supporters. You won’t find out if there are no re-ups for a very long time. And they will innovate, making the supporters even more excited at every iteration.
Discipline can be a killer at the beginning, but it rarely is at the end. So I say enjoy Snap but go along without me.”
In other words, by sheer hype, SNAP is likely to continue upward, but its ultimate fate is written on the wall. My effort to get the getting while the getting is good is a layered approach. As noted in previous pieces, my latest trade was to accumulate SNAP into the bottom and wait for a spot to layer back into a short. I thought there was more time ahead before the hype fest, so my short ended up being two days early. I am still net long and am looking to unload at $25 or $26 (I want to be ahead of any rush to sell at the $27 consensus target of the underwriters) at which point I will be back to focusing on accumulating a short position.
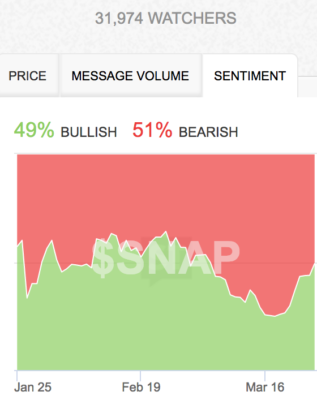
Source: StockTwits
— – —
FOLLOW Dr. Duru’s commentary on financial markets via email, StockTwits, Twitter, and even Instagram!
“Above the 40” uses the percentage of stocks trading above their respective 40-day moving averages (DMAs) to assess the technical health of the stock market and to identify extremes in market sentiment that are likely to reverse. Abbreviated as AT40, Above the 40 is an alternative label for “T2108” which was created by Worden. Learn more about T2108 on my T2108 Resource Page. AT200, or T2107, measures the percentage of stocks trading above their respective 200DMAs.
Active AT40 (T2108) periods: Day #277 over 20%, Day #97 over 30% (overperiod), Day #5 under 40% (underperiod), Day #6 under 50%, Day #18 under 60%, Day #49 under 70%
Daily AT40 (T2108)
")
Black line: AT40 (T2108) (% measured on the right)
Red line: Overbought threshold (70%); Blue line: Oversold threshold (20%)
Weekly AT40 (T2108)

*All charts created using freestockcharts.com unless otherwise stated
The charts above are my LATEST updates independent of the date of this given AT40 post. For my latest AT40 post click here.
Related links:
The T2108 Resource Page
You can follow real-time T2108 commentary on twitter using the #T2108 or #AT40 hashtags. T2108-related trades and other trades are occasionally posted on twitter using the #120trade hashtag.
Be careful out there!
Full disclosure: net long SNAP, long puts and calls on GOOG, long CLF call options, long UVXY calls and puts, long GS calls
I failed to mention that I picked GS for a buy because it was trading well below its lower-Bollinger Band (BB) at a time AT40 was stretched toward 30%. Seemed like a perfect combination for a bounce….