
AT40 = 42.8% of stocks are trading above their respective 40-day moving averages (DMAs)
AT200 = 54.3% of stocks are trading above their respective 200DMAs
VIX = 12.0 (volatility index) – a 17.9% decrease
Short-term Trading Call: neutral (bullish only after the latest Trump Turmoil reverses OR oversold conditions, potentially bearish upon a retest of overbought conditions)
Commentary

Source: The Nut Job movie site
The definition of nut job (also spelled nutjob) from Merriam-Webster: “a mentally unbalanced person: a crazy person”…
When the New York Times reported that President Donald Trump labelled fired FBI Director Comey a “nut job,” look-ups of the term surged on the on-line version of the Merriam-Webster dictionary.
📈'Nutjob' is our number 2 lookup right now. https://t.co/bpGxeCtpSr
— Merriam-Webster (@MerriamWebster) May 19, 2017
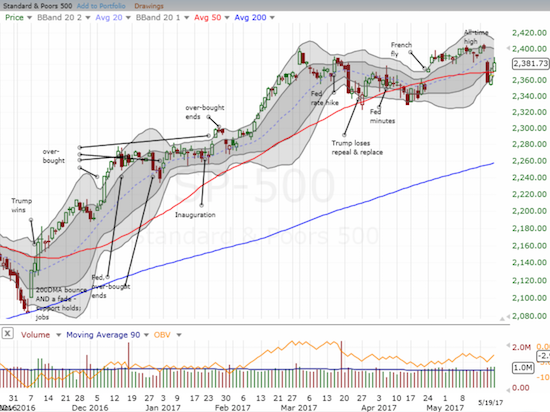
While the 173,750% increase is very likely the result of starting from an extremely small base, it occurred to me that the use and interest in this term present a perfect monicker for the times and this stock market. On Wednesday, May 17th, the S&P 500 (SPY) broke down below its 50DMA and lost 1.8% as the stock market all at once decided to care about the political headlines. The losses essentially ended there as sellers once again proved unable to follow-through on their advantage. In two days, the index traded above Wednesday’s gapped open and closed above its 50DMA. In parallel, the volatility index, the VIX, imploded. On Wednesday, the VIX soared 46.4% and tied August 21, 2015 for the 6th highest one-day change on the VIX (since 1990). No matter the starting point, such a rapid move is a likely sign of “flash panic.” The 17.9% loss on Friday to a 12.0 close placed the VIX right back in the middle of the area of congestion that prevailed before the French Fly although the VIX is still above the extremely low levels that immediately followed the French Fly.
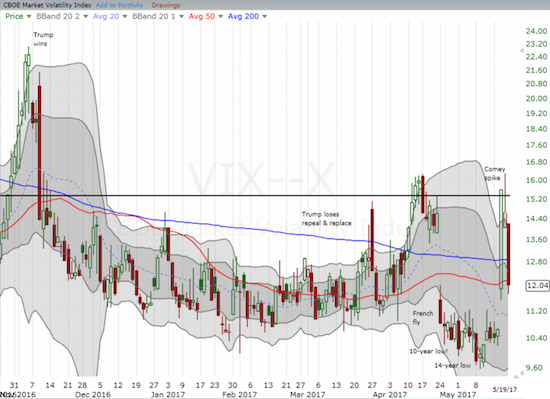
When I sold my put options on ProShares Ultra VIX Short-Term Futures ETF (UVXY) on Thursday, I thought my small profit was a good win. UVXY went on to lose another 14.4% as a result of Friday’s VIX implosion. I also failed to re-establish a hedged call/put option play. I am primed to do so on Monday morning.
A casual observer could be excused for looking at this seesaw and concluding a bunch of nut jobs are behind the curtain spinning the dials and emotions of the market. The trading action makes little sense from a “rational” sense, but it tracks with sentiment and technicals. In other words, the harder one tries to make sense of this kind of nut job action, the less sense it may make. So, as usual, I start with the technicals, and in particular my favorite technical indicator AT40 (T2108), the percentage of stocks trading above their respective 40-day moving averages (DMAs).
On Wednesday, I noted the following about AT40:
“I am not bearish because AT40 (T2108), the percentage of stocks trading above their respective 40DMAs, closed at 36.5%. In a strong bull run, the low 30s is “close enough” to the oversold threshold of 20%. So there is little upside here in flipping to a bearish stance.”
It turned out there was ZERO upside to flipping bearish.
AT40 was the only thing keeping me from flipping bearish given the S&P 500’s major 50DMA breakdown. AT40 closed on Friday at 42.8%. Like the S&P 500, AT40 for a brief moment made progress cutting into its gap down from Wednesday. Although the S&P 500 managed to close above 50DMA resistance, I am not flipping back to bullish until buyers re-demonstrate their muscle by completly reversing Wednesday’s loss – not to mention I hate churning my trading call. Even then, I will have to go back to cautiously bullish because I strongly suspect that the next challenge of overbought conditions will signal a time to get bearish and fade the market. Still, one step at a time. I will cross that bridge once the market gets there.
AT200 (T2107), the percentage of stocks trading above their respective 200DMAs, delivered a faint sign of better things to come for buyers. At one point AT200 managed to completely reverse Wednesday’s loss before fading back to just above Wednesday’s open. Note that AT200 remains in breakdown territory.
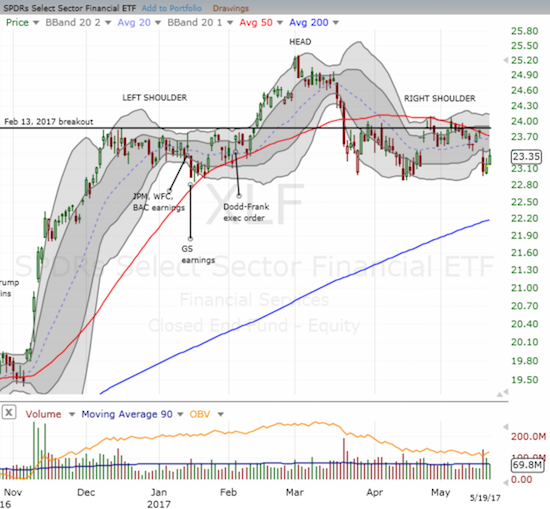
The last two days of buying saved the the Financial Select Sector SPDR Fund (XLF) from a very bearish breakdown from a looming head and shoulders (H&S) top. I continue to monitor these developments like a hawk.
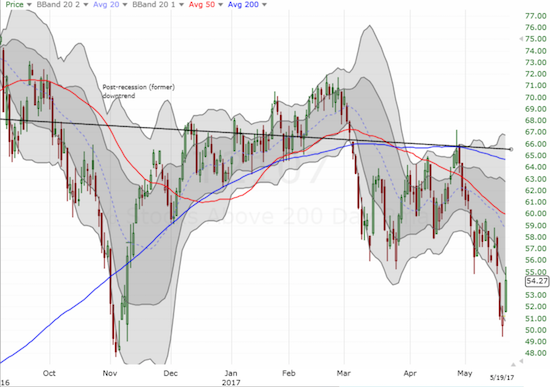
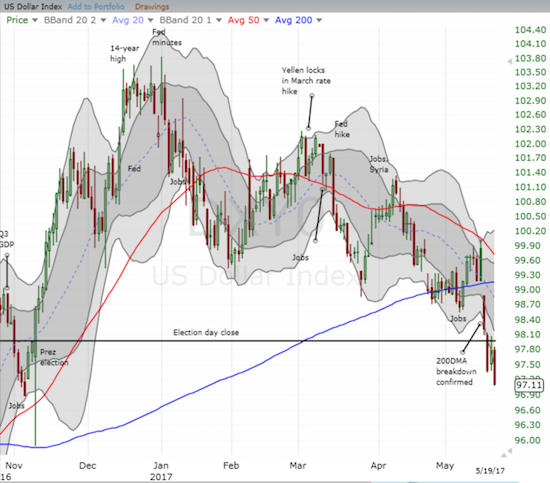
The nut job action in the stock market failed to impress currency traders. After a 1-day respite, the U.S. dollar index (DXY0) continued to follow through on its major 200DMA breakdown. The world at-large is slowly but surely stepping away…
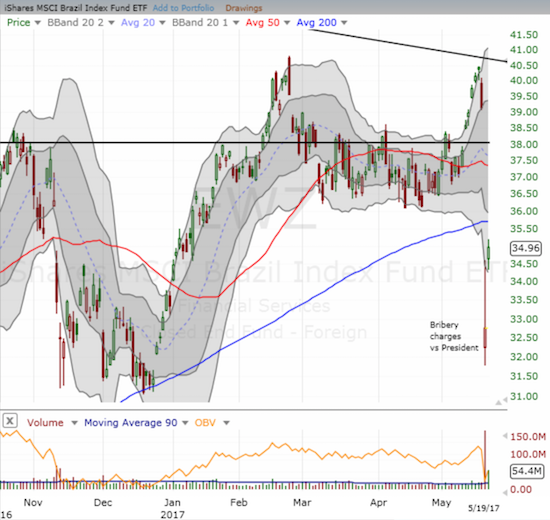
The biggest display of nut job action was in Brazil. A full-scale panic brings out the nut job in all of us. On Thursday, I wrote “Trading Panic: Rushing Past the Exit from Brazil” as a case study in how I prefer to trade in the middle of a panic. The market delivered for me one more time as iShares MSCI Brazil Capped ETF (EWZ) pulled off a large gap up and closed with a 6.8% gain. I sold into this rally and locked in my profits. EWZ now has the formidable task of regaining 200DMA support.
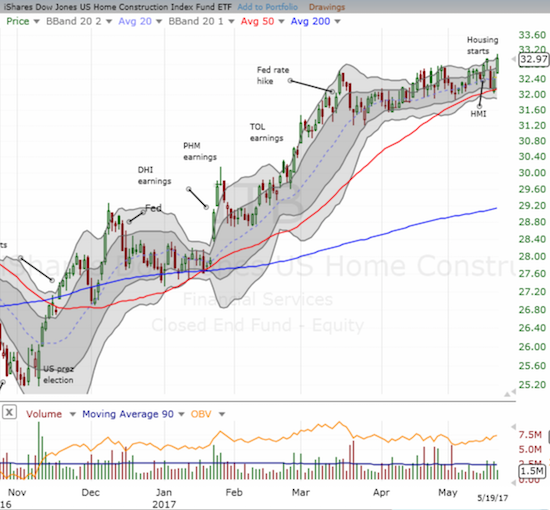
One fascinating point of resilience was home builders. The iShares U.S. Home Construction ETF (ITB) dipped to 50DMA support on Wednesday and rebounded the next day. ITB actually closed the week at a new (marginal) 10-year high.
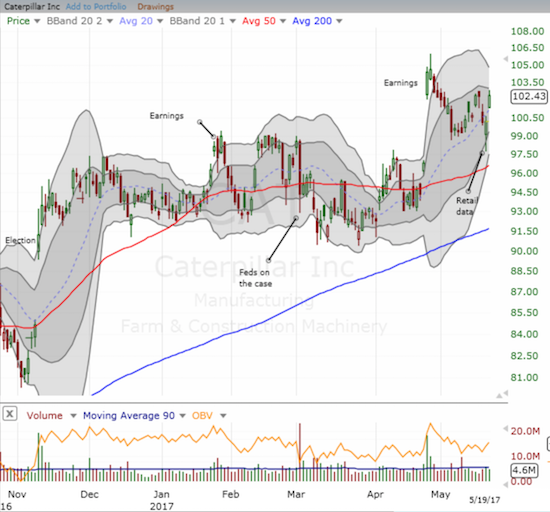
Given the week’s events I decided to re-establish a small hedge in Caterpillar (CAT). CAT fell with the market on Wednesday, but, more importantly, the next day the stock almost finished closing its post-earnings gap up after a lukewarm sales report. The bounceback Friday erased the loss from Wednesday, so technically CAT is back in a bullish place. Yet, if trouble returns to the market, I see CAT as being particularly vulnerable given its tie to the global economy and Trump’s plans for infrastructure spending.
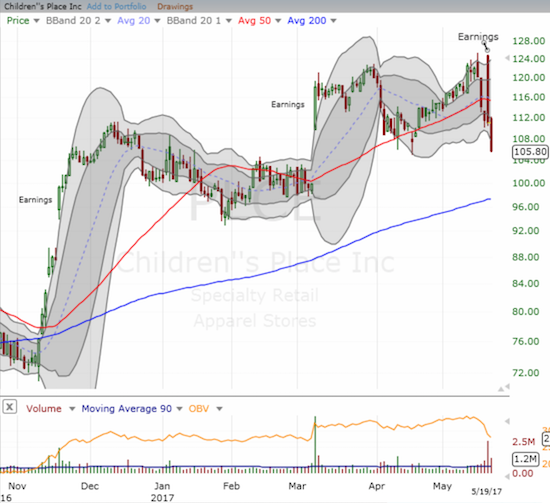
An “ugly stick” award goes to Children’s Place (PLCE). After reporting earnings, PLCE gapped up a whopping 11.8%, hurtled over its 50DMA, and almost hit a new intraday high. The gap turned quickly into crap as PLCE ended the day with a small loss. On Friday, PLCE followed up with more crap and a 4.8% loss. I daresay a test of (uptrending) 200DMA support is in play now. Moreover, strong fades from major milestones are typically majorly bearish events.
Merriam-Webster maintains a “trending now” section that shows the most looked-up words. For each word, MW writes a short article to explain why the term is topical or salient. While Trump turmoil dominates the news, I was still surprised that ALL top 5 words are related to these political headlines. People really are paying close attention – enough attention to even seek out the meaning of the words getting flung around.
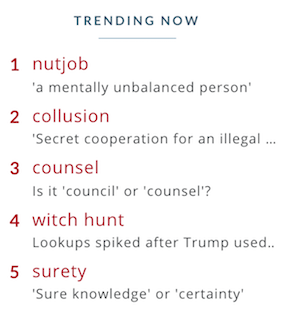
Source (Screen capture): Merriam-Webster Dictionary
Be careful out there!
— – —
FOLLOW Dr. Duru’s commentary on financial markets via email, StockTwits, Twitter, and even Instagram!
“Above the 40” uses the percentage of stocks trading above their respective 40-day moving averages (DMAs) to assess the technical health of the stock market and to identify extremes in market sentiment that are likely to reverse. Abbreviated as AT40, Above the 40 is an alternative label for “T2108” which was created by Worden. Learn more about T2108 on my T2108 Resource Page. AT200, or T2107, measures the percentage of stocks trading above their respective 200DMAs.
Active AT40 (T2108) periods: Day #314 over 20%, Day #134 over 30%, Day #1 over 40% (overperiod ending 2 days under 40%), Day #4 under 50%, Day #16 under 60%, Day #86 under 70%
Daily AT40 (T2108)
")
Black line: AT40 (T2108) (% measured on the right)
Red line: Overbought threshold (70%); Blue line: Oversold threshold (20%)
Weekly AT40 (T2108)

*All charts created using freestockcharts.com unless otherwise stated
The charts above are my LATEST updates independent of the date of this given AT40 post. For my latest AT40 post click here.
Related links:
The T2108 Resource Page
You can follow real-time T2108 commentary on twitter using the #T2108 or #AT40 hashtags. T2108-related trades and other trades are occasionally posted on twitter using the #120trade hashtag.
Be careful out there!
Full disclosure: net short the U.S. dollar
*Note QQQ is used as a proxy for a NASDAQ-related ETF