
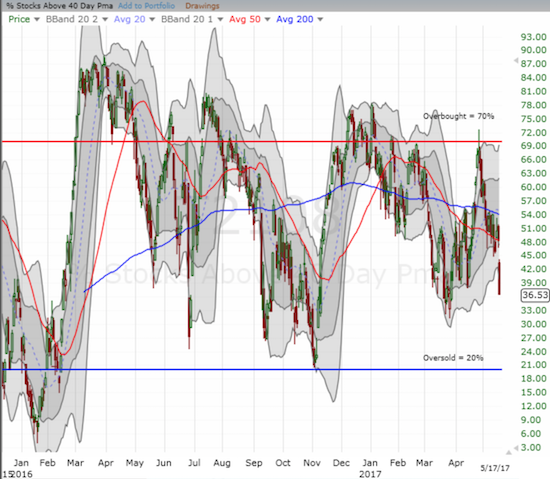
AT40 = 36.5% of stocks are trading above their respective 40-day moving averages (DMAs)
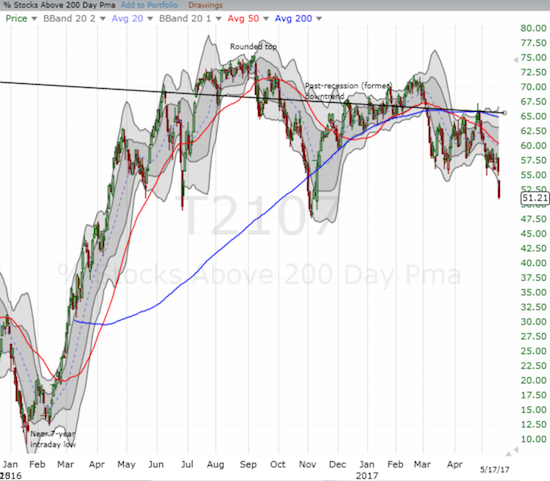
AT200 = 51.2% of stocks are trading above their respective 200DMAs
VIX = 15.6 (volatility index) – a 46.4% increase!!!
Short-term Trading Call: neutral (downgrade from cautiously bullish)
Commentary
Time to downgrade my cautious bullishness to neutral.
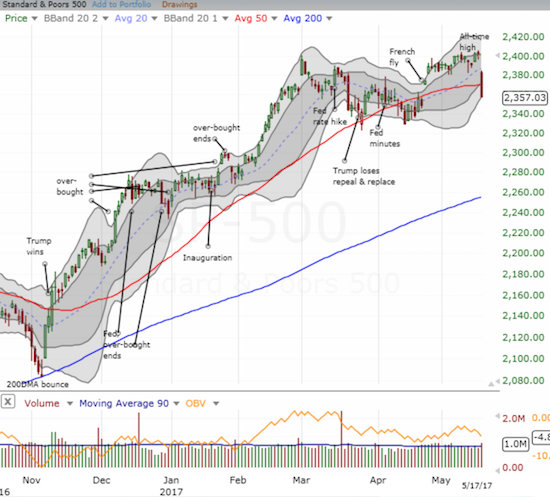
The S&P 500 (SPY) lost 1.8% on its way to a major breakdown of support at its 50-day moving average (DMA). This breakdown forced me to downgrade my short-term trading call. I am not bearish because AT40 (T2108), the percentage of stocks trading above their respective 40DMAs, closed at 36.5%. In a strong bull run, the low 30s is “close enough” to the oversold threshold of 20%. So there is little upside here in flipping to a bearish stance. A neutral trading call facilitates navigating across longs and shorts as the circumstance fits (very short-term).
AT200 (T2107), the percentage of stocks trading above their respective 200DMAs, closed at 51.2%, a new 6+ month low. Today’s loss confirmed the on-going breakdown of AT200.
The “French Fly” launched the gains for the S&P 500 over the last three weeks. The near complete reversal of those gains in just one day is like a shock to the system that will certainly serve as a wake-up call. The volatility index (VIX) was a major recipient of this wake-up call. The VIX soared an incredible 46.4% and closed just above the all-important 15.35 pivot. This surge tied August 21, 2015 as the 6th largest one-day percentage gain on record (data available through 1990). Traders will recall that was the day of a nasty one day-sell off that immediately preceded a flash crash and epic oversold period which drove its own 45.3% jump in the VIX – together I called this period the August Angst.
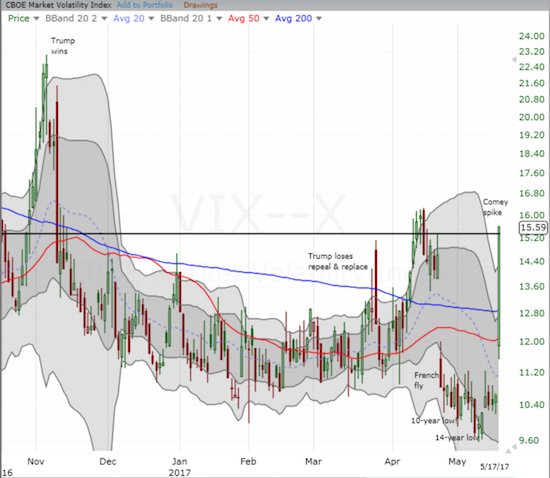
The VIX is another reason why I am not bearish. This kind of move is dripping with panic. It represents broad based, wide scale selling – the kind of selling where traders and investors alike are rushing to dump everything as quickly as possible to lock in profits. I sold my call options on ProShares Ultra VIX Short-Term Futures ETF (UVXY) near the open (I sold the put options on Monday – an earlier lesson learned to lock in profits from a Monday volatility decline), but I reflexively bought put options near the close after seeing how far the VIX climbed. I decided against pairing these puts with call options given the market’s proximity to oversold trading conditions.
I am sure the memories of 2015’s August Angst are fresh on minds (or etched in the wiring of the computer chips of the trading bots). It does not help that this is the month of May where the often misinterpreted and misapplied “sell in May” gets a surfeit of attention. I welcome another surge in the VIX at the scale of the August Angst: such a surge should exhaust sellers just as AT40 drops into oversold territory. (Note: I will need to do an extension of my analysis of extremely low periods of volatility to incorporate the dynamics of the return of more normal levels of volatility. The previous period of extremely low volatility suggested a pullback of at least 5% would come sometime in May. I am not sure whether the end and then return of extremely low volatility reset that timeline or made it even more likely).
I am not going to connect today’s sell-off to the increasingly chaotic political backdrop in the U.S. I did some of that last week in throwing the warning flag at the U.S. dollar (DXY0). Trouble has been brewing for quite some time, particularly as represented by all the reversals of post-election moves that I have chronicled here. The general market simply chose not to care until now.
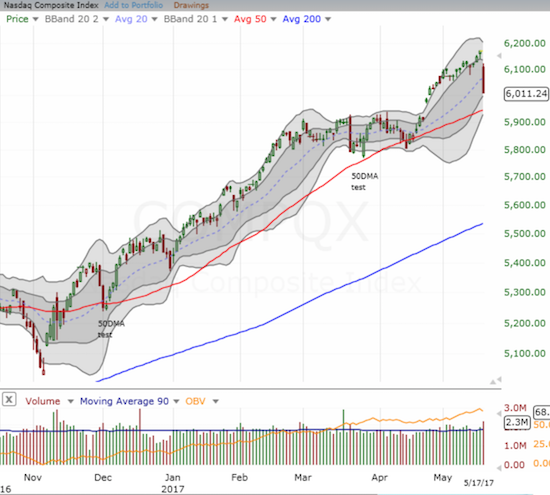
The market also pounded away at the NASDAQ (QQQ)* (source of funds?). Unlike the S&P 500, the tech-laden index is still holding its 50DMA uptrend.
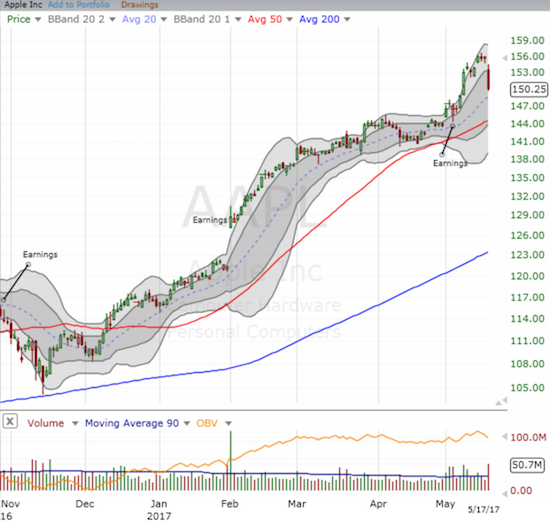
Apple (AAPL) led tech in the downward slide. AAPL lost 3.4% and essentially reversed its last big breakout. At around a 2% loss, I was astonished enough to get a very early start on a weekly play for AAPL with call options expiring next week. AAPL’s plunge signals that really big money and big institutions were behind the persistent and vicious selling on the day – retail money cannot move an $800B stock like this!
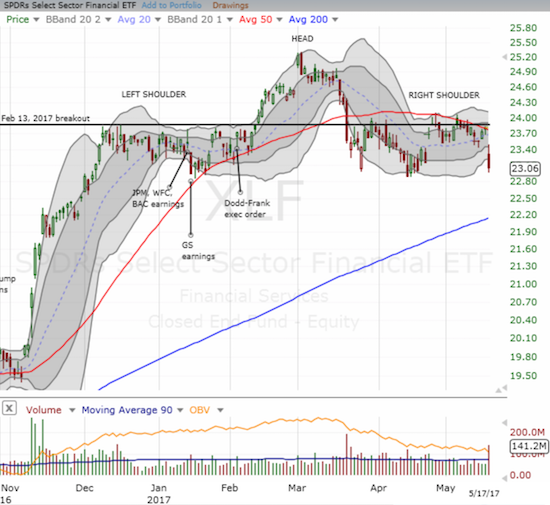
With trouble once again palpable in the market, I am back to eyeing the financials quite closely. The Financial Select Sector SPDR Fund (XLF) is in the middle of what looks like a classic head and shoulders (H&S) pattern. XLF just needs to set a new low for 2017 to confirm the bearish (topping) pattern. Even with oversold trading conditions looming, I would go after put options on XLF if it confirms the H&S pattern. If nothing else, the put options would make for good hedges.
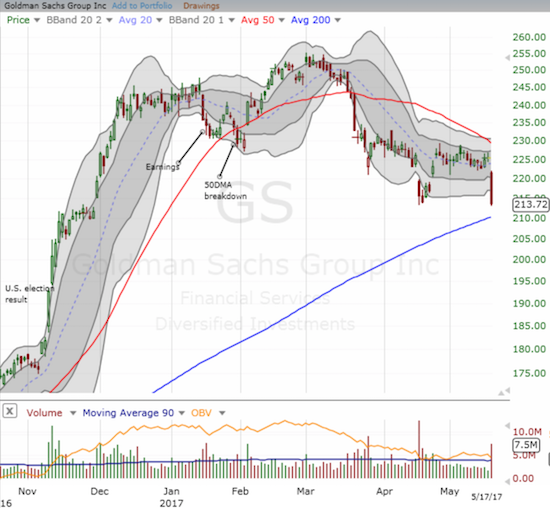
It looks like Goldman Sachs (GS) will be a key tell for financials. GS is facing down a very critical test of 200DMA support as the stock lost a whopping 5.3% on the day. GS closed at a (marginal) new 2017 low and reconfirmed the complete reversal of the November 30, 2016 breakout. Is it inevitable that GS will join the crowd of equities that have reversed post-election moves?
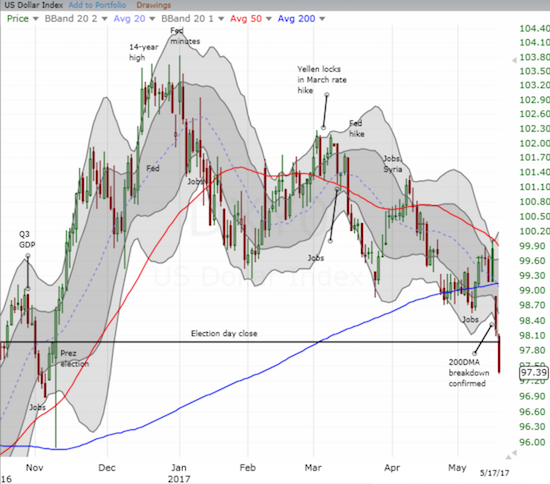
The U.S. dollar index (DXY0) followed through on the previous day’s bearish confirmation of a 200DMA breakdown. Today’s loss marked the complete reversal of post-election gains for the U.S. dollar. I daresay an extended decline to last year’s lows is in the works.
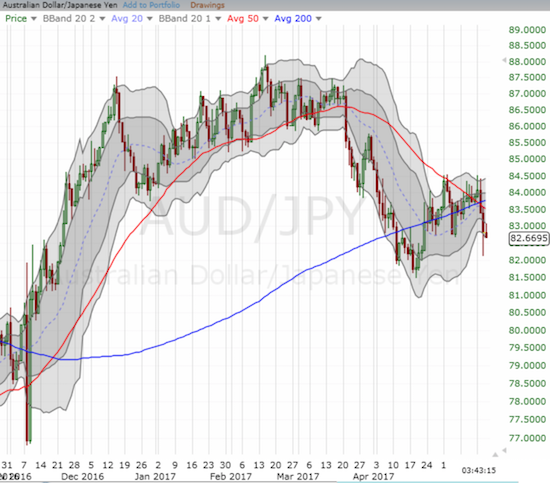
Finally, the Australian dollar (FXA) versus the Japanese yen (FXY) broke down below its 200DMA once again. The French Fly helped propel AUD/JPY – my favorite tell on risk appetite in the currency market – out of the last breakdown. Now financial markets need AUD/JPY to hold its post-breakdown low as it turns out the inability to break free of the 200DMA was signaling the lack of conviction to a risk-on appetite.
Be careful out there!
— – —
FOLLOW Dr. Duru’s commentary on financial markets via email, StockTwits, Twitter, and even Instagram!
“Above the 40” uses the percentage of stocks trading above their respective 40-day moving averages (DMAs) to assess the technical health of the stock market and to identify extremes in market sentiment that are likely to reverse. Abbreviated as AT40, Above the 40 is an alternative label for “T2108” which was created by Worden. Learn more about T2108 on my T2108 Resource Page. AT200, or T2107, measures the percentage of stocks trading above their respective 200DMAs.
Active AT40 (T2108) periods: Day #312 over 20%, Day #132 over 30% (overperiod), Day #1 under 40% (underperiod ending 21 days over 40%), Day #2 under 50%, Day #14 under 60%, Day #84 under 70%
Daily AT40 (T2108)
")
Black line: AT40 (T2108) (% measured on the right)
Red line: Overbought threshold (70%); Blue line: Oversold threshold (20%)
Weekly AT40 (T2108)

*All charts created using freestockcharts.com unless otherwise stated
The charts above are my LATEST updates independent of the date of this given AT40 post. For my latest AT40 post click here.
Related links:
The T2108 Resource Page
You can follow real-time T2108 commentary on twitter using the #T2108 or #AT40 hashtags. T2108-related trades and other trades are occasionally posted on twitter using the #120trade hashtag.
Be careful out there!
Full disclosure: long UVXY put options, long AAPL call options, net short the U.S. dollar, short AUD/JPY
*Note QQQ is used as a proxy for a NASDAQ-related ETF