
AT40 = 49.1% of stocks are trading above their respective 40-day moving averages (DMAs)
AT200 = 57.2% of stocks are trading above their respective 200DMAs
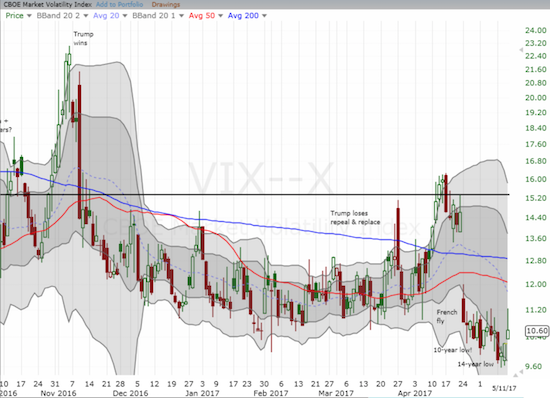
VIX = 10.6 (volatility index)
Short-term Trading Call: bullish
Commentary
The week started with the volatility index, the VIX, plunging to a 14-year low. I held onto my put options on ProShares Ultra VIX Short-Term Futures (UVXY) but did not get the opportunity to extend profits. The VIX recovered each of the next 3 days from there and even returned to the high of the recent range. Stock buyers took over at that point from weak sellers and helped the S&P 500 (SPY) snap back. Today’s trading action picked the index off the bottom of the last trading range to a close that lay flat with the open.
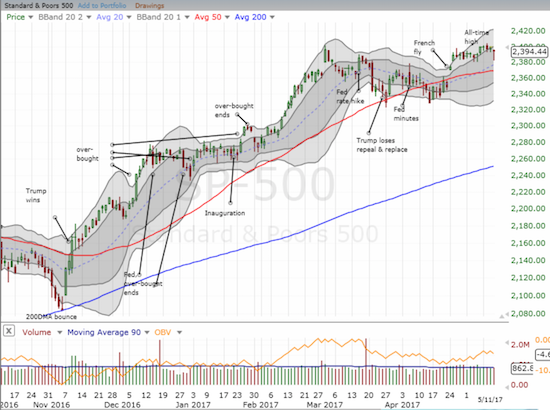
AT40 (T2108), the percentage of stocks trading above their respective 40DMAs, still closed with a notable loss from 54.0% to 49.1%. At its lowest, AT40 traded at 44.7%. The action in AT200 (T2107), the percentage of stocks trading above their respective 200DMAs, was much more troubling. AT200 closed at 57.2% with its lowest point marking its third lowest point since it broke down in March. While the S&P 500 can continue skirting a bearish divergence with a non-cooperative AT40, the weakening AT200 bodes poorly for longer-term prospects of the stock market. As always, I am interpreting one step at a time.
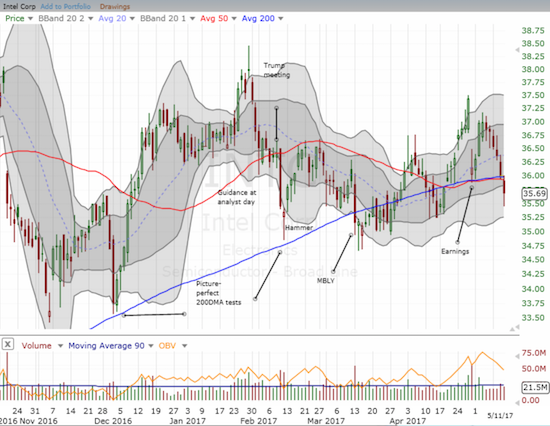
Intel (INTC) is one of the big caps causing a bit of a drag on the major indices. After INTC suffered a post-earnings gap down, I loaded up on call options as a part of my “between earnings” strategy for INTC. I assumed converged support at the 50 and 200DMAs would hold, and they did hold long enough for me to capture a double. However, the recovery was short-lived; it did not quite reverse post-earnings losses. Today, INTC broke down through support and closed at a new post-earnings low. I will be looking to relaunch the between earnings trade in the next few trading days.
The true goat of the day was Snap, Inc. (SNAP). The young company’s first earnings report as a publicly-traded company snapped shares by 21.5%. Such a snap back to reality was easy to accomplish given the stock’s sky-high valuation and hype to match. I have written many times here about my bearish overall assessment of SNAP and my various trades. The stock’s post-earnings collapse provided validation and confirmation. The next test is here with the stock hovering above its $17 IPO price tag.
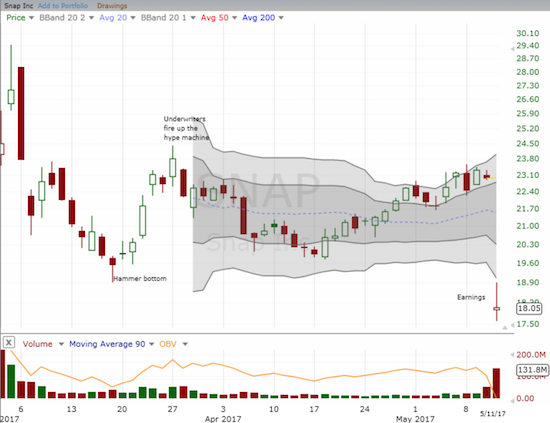
I covered my short position in after-hours trading as SNAP bounced off its $17 IPO price. There should be no surprise that sellers dried up at that point. I imagine investors and traders who landed the IPO are loathe to sell into a panic for a loss, but they were likely rushing to lock in whatever profits they had left. I was impressed that SNAP managed to open as high as it did ($17.96). I did not think to short again as SNAP reached the former intraday all-time low. The picture-perfect retreat from that technical level reminded me why trading SNAP has been so attractive. I am once again long SNAP and looking to add a last tranche of shares closer to the IPO price…assuming that level will hold for a while. SNAP issued 200M shares and 132M shares traded today, so it is very possible that the market has not yet washed out IPO-related sellers. The next big event will be the window insiders get to dump stock into the market. If SNAP’s massive stock-based compensation is any indication, insiders will be dumping as fast as the winds allow.
The analyst reaction to the calamity was interestingly varied. The mix bodes well for on-going opportunities to go long and short the stock. I culled this list from reporting in briefing.com. If the analyst made a rating or price target change, I noted it. I placed an asterisk next to underwriters.
- Cantor Fitzgerald: Underweight to Neutral
- Needham: Underperform
- *Oppenheimer: Perform to Outperform, target $23
- Pivotal: Sell
- *RBC: Outperform, target $31
- *Stifel: Hold, target $24 to $22
RBC really stands out as particularly stubborn. I am guessing RBC is a near sure shot to get some of the business for offering up secondary shares to the stock market. I am eagerly awaiting the reactions of other underwriters. Recall that I was particularly critical of the hype machine of analyst initiations on March 27th. The stock has yet to trade higher than its close on that day.
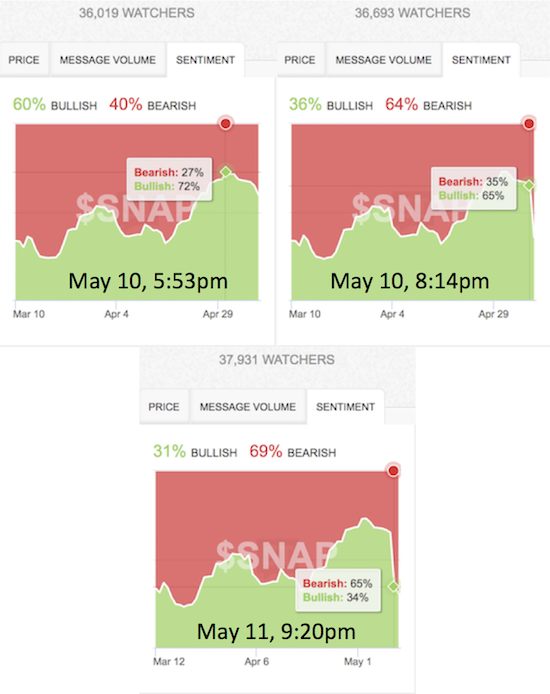
Finally, sentiment on SNAP continues to chase price. I took three snapshots of the sentiment reported on StockTwits. Traders were still bullish as earnings rolled out. That sentiment quickly flipped to bearish a few hours into after-hours trading. Sentiment today confirmed the switch to bearishness.
Be careful out there!
— – —
FOLLOW Dr. Duru’s commentary on financial markets via email, StockTwits, Twitter, and even Instagram!
“Above the 40” uses the percentage of stocks trading above their respective 40-day moving averages (DMAs) to assess the technical health of the stock market and to identify extremes in market sentiment that are likely to reverse. Abbreviated as AT40, Above the 40 is an alternative label for “T2108” which was created by Worden. Learn more about T2108 on my T2108 Resource Page. AT200, or T2107, measures the percentage of stocks trading above their respective 200DMAs.
Active AT40 (T2108) periods: Day #308 over 20%, Day #128 over 30%, Day #18 over 40% (overperiod), Day #1 under 50% (underperiod), Day #10 under 60%, Day #80 under 70%
Daily AT40 (T2108)
")
Black line: AT40 (T2108) (% measured on the right)
Red line: Overbought threshold (70%); Blue line: Oversold threshold (20%)
Weekly AT40 (T2108)

*All charts created using freestockcharts.com unless otherwise stated
The charts above are my LATEST updates independent of the date of this given AT40 post. For my latest AT40 post click here.
Related links:
The T2108 Resource Page
You can follow real-time T2108 commentary on twitter using the #T2108 or #AT40 hashtags. T2108-related trades and other trades are occasionally posted on twitter using the #120trade hashtag.
Be careful out there!
Full disclosure: long UVXY call and put options, long SNAP
*Note QQQ is used as a proxy for a NASDAQ-related ETF