
AT40 = 58.0% of stocks are trading above their respective 40-day moving averages (DMAs)
AT200 = 62.0% of stocks are trading above their respective 200DMAs
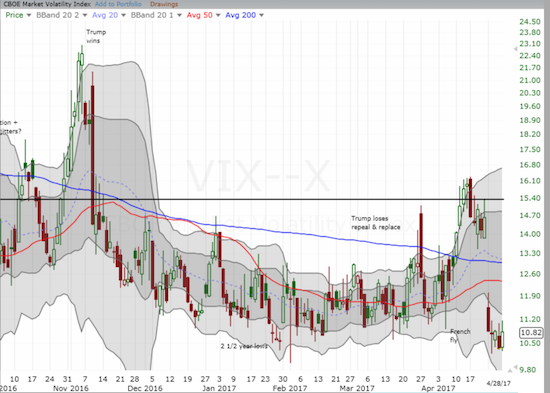
VIX = 10.8 (volatility index)
Short-term Trading Call: bullish
Commentary
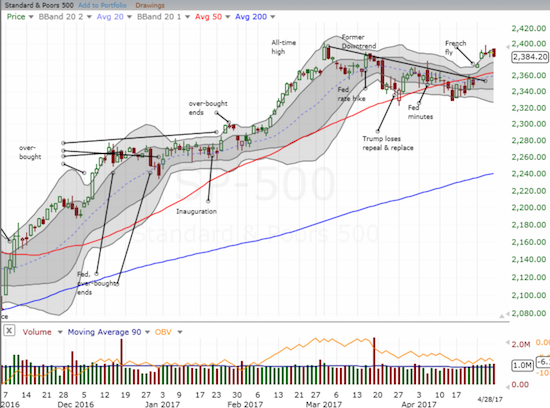
The last week of trading for April transitioned readily from the French Fly that sent financial markets into celebratory dances to a subtly ominous Friday Fade that confirmed a market failure at the threshold of overbought conditions.
Just as I was preparing to craft a strategy for overbought trading, AT40 (T2108), the percentage of stocks trading above their respective 40-day moving averages (DMAs), threw me for a loop. AT40 closed out trading for April with a plunge from 65.3% to 58%. In most cases, this definitive failure right at the edge of the overbought threshold would send me rushing to get bearish. Recall that AT40 pushed into overbought territory during much of trading on Wednesday. However, such a rush is unnecessary in a market where buyers and bulls thoroughly dominate and sellers have folded time and time again. Let’s see where we are when (not if) the S&P 500 (SPY) retests 50DMA support.
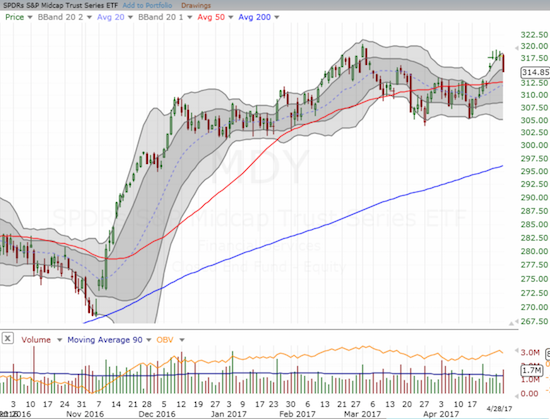
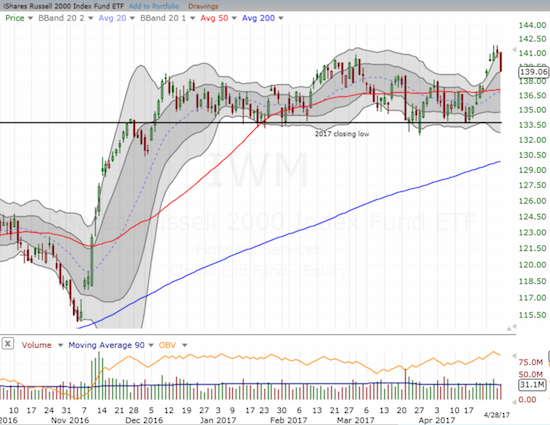
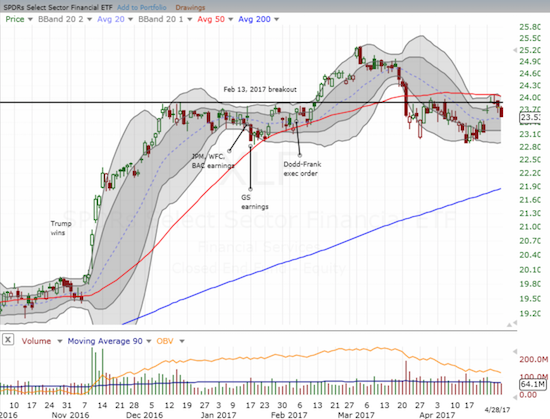
The source of the trouble on the day came from mid-caps, small caps, and financials in general. Each chart seemed to make a statement about the end of momentum. The SPDR S&P MidCap 400 ETF (MDY) lost 1.0% and reversed part of the week-opening gap up after three straight days stalled just under its all-time high. The iShares Russell 2000 (IWM) lost 1.3% and closed at Monday’s close after three straight days stalled at its new all-time high. The Financial Select Sector SPDR ETF (XLF) looks like it confirmed 50DMA resistance after it sank to a 1.0% loss.
The message across the board seems to be that upward momentum has stalled out again almost as quickly as it resumed…just in time for “sell in May.” Despite this May alert, the volatility index barely stirred.
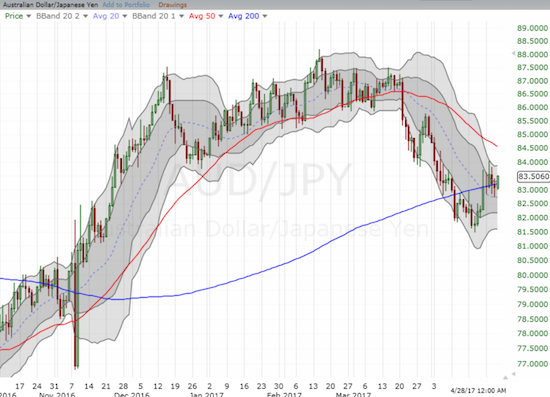
In forex, the Australian dollar versus the Japanese yen (AUD/JPY) even looks like it will manage to hold its 200DMA as support.
Given this mix of signals, I have very low expectations for May, but I also no longer expect my long-standing prediction for a May 5% pullback to come to fruition. The return of the VIX to an extremely low level further complicated my original prediction. There will be plenty of time for re-establishing that assessment if the S&P 500 breaks down and closes below its 50DMA support and especially if it closes below the former downtrend.
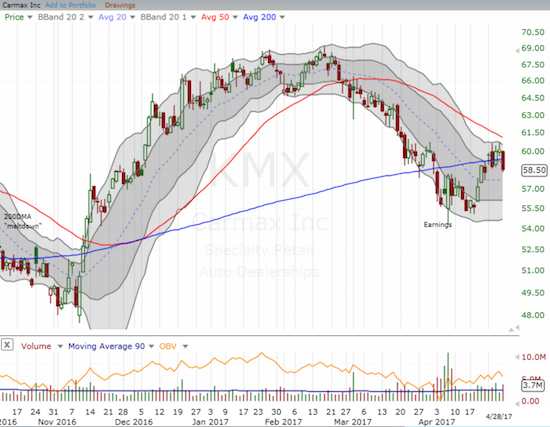
My short-term trading call stays at bullish, but I did find occasion to try some shorts. The one I held past a day is Karmax (KMX). While KMX managed to bounce back quickly from early post-earnings selling on April 6th, the fresh 200DMA breakdown on Friday suspiciously looked like a confirmation of downtrending 50DMA resistance.
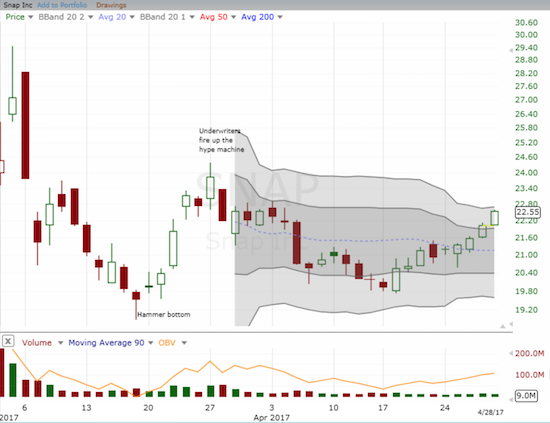
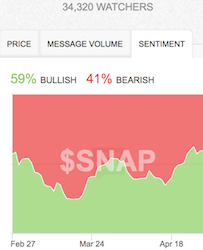
Snap, Inc. (SNAP) is rallying on the tailwinds of fresh bullishness. Over the past 9 trading days, SNAP experienced a loss on just one day. StockTwits sentiment is following price higher. I used Friday’s gains to return to a net short position. Given the heavy interest and expense in shorting SNAP when it first debuted, I am surprised (and relieved) to note that only 5.2% of its float is sold short based on the latest data.
While the drag on the market came from small-caps, mid-caps, and financials, some key big-cap names turned in disappointing performances.
Intel (INTC) experienced another post-earnings swoon. A 3.4% loss pushed the stock back to its converged 50 and 200DMA support. In the spirit of my “between earnings play”, I used the retest of support as an opportunity to jump back into call options (expiring in June).
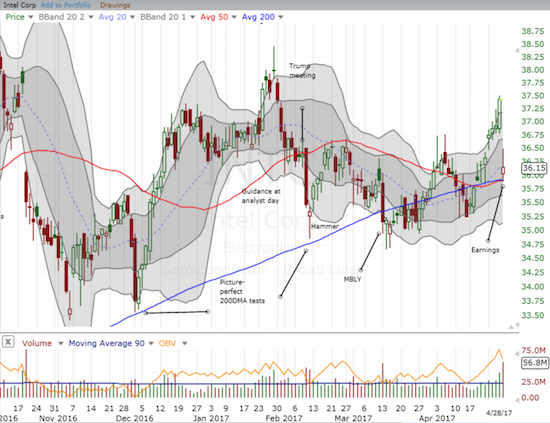
Note how INTC rallied hard just ahead of earnings. I strongly suspect expectations moved too high too fast to support reality.
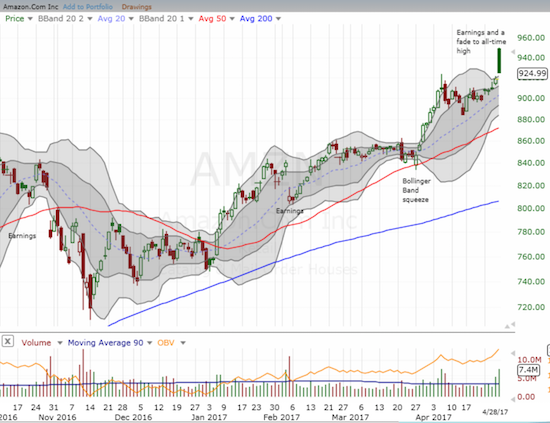
Post-earnings trading started out well for Amazon.com (AMZN) but sellers were persistent all day. After gapping up over 3.4%, AMZN faded to a mere 0.7% gain at the close. This gap and crap looks like a blow-off top. Still, I stuck to my AMZN post-earnings trading rule and bought at the open for a 2-week trade. I first low-balled a call spread. As the stock continued to tumble downward, I added shares to the mix with a tight stop. That stop tripped relatively quickly, so now I watch and wait for any new entry points.
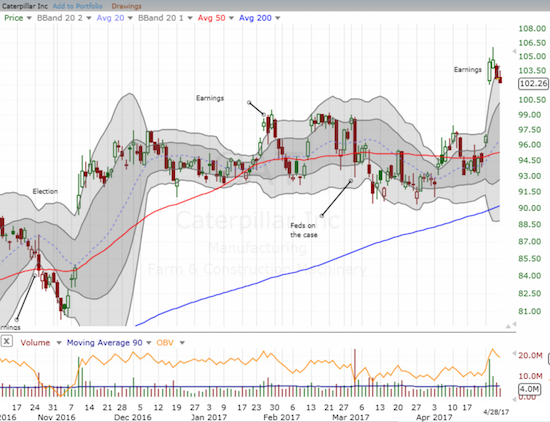
Caterpillar (CAT) delivered a stunning post-earnings performance last week. However, the momentum seems to be waning already. On Friday, CAT closed at a marginally new post-earnings low. Suddenly its big gap up looks like it is in trouble. I decided to trade on the prospect for big moves to come with a hedged call and put option position.
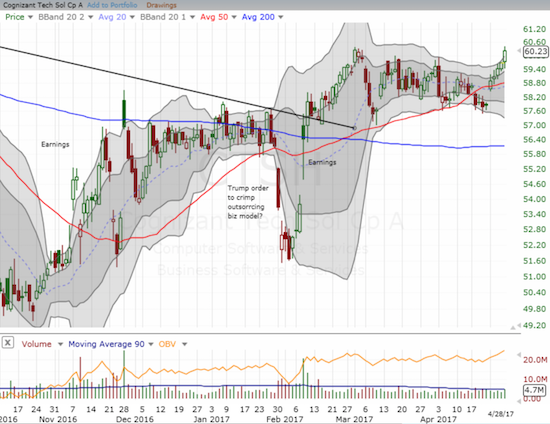
On the bullish side, Cognizant Technology (CTSH) continues to defy earlier concerns over changes to immigration laws. On Friday it closed within pennies of the last high in a move that just about confirmed the 50DMA uptrend and support.
Be careful out there!
— – —
FOLLOW Dr. Duru’s commentary on financial markets via email, StockTwits, Twitter, and even Instagram!
“Above the 40” uses the percentage of stocks trading above their respective 40-day moving averages (DMAs) to assess the technical health of the stock market and to identify extremes in market sentiment that are likely to reverse. Abbreviated as AT40, Above the 40 is an alternative label for “T2108” which was created by Worden. Learn more about T2108 on my T2108 Resource Page. AT200, or T2107, measures the percentage of stocks trading above their respective 200DMAs.
Active AT40 (T2108) periods: Day #299 over 20%, Day #119 over 30%, Day #9 over 40%, Day #6 over 50% (overperiod), Day #1 under 60% (underperiod ending 4 days above 60%), Day #71 under 70%
Daily AT40 (T2108)
")
Black line: AT40 (T2108) (% measured on the right)
Red line: Overbought threshold (70%); Blue line: Oversold threshold (20%)
Weekly AT40 (T2108)

*All charts created using freestockcharts.com unless otherwise stated
The charts above are my LATEST updates independent of the date of this given AT40 post. For my latest AT40 post click here.
Related links:
The T2108 Resource Page
You can follow real-time T2108 commentary on twitter using the #T2108 or #AT40 hashtags. T2108-related trades and other trades are occasionally posted on twitter using the #120trade hashtag.
Be careful out there!
Full disclosure: long call and put options on UVXY, long CTSH, long INTC call options, short KMX, net short SNAP, short AUD/JPY, long put and call options on CAT
*Note QQQ is used as a proxy for a NASDAQ-related ETF