
The trade in silver just got even more interesting.
For a few weeks, I wondered aloud why speculators were so stubbornly bullish on the precious metal, especially relative to speculators in gold. In my last post on silver, I noted how speculators were finally beating a hasty retreat. In the latest Commitment of Traders (CoT) data, silver speculators reduced net longs all the way back to levels last seen 13 months ago. The chart below demonstrates the dramatic nature of this reversal when comparing to the levels from the breakout of early 2016 and the historic high from just one month ago. Net longs dropped 50% in just 4 weeks.
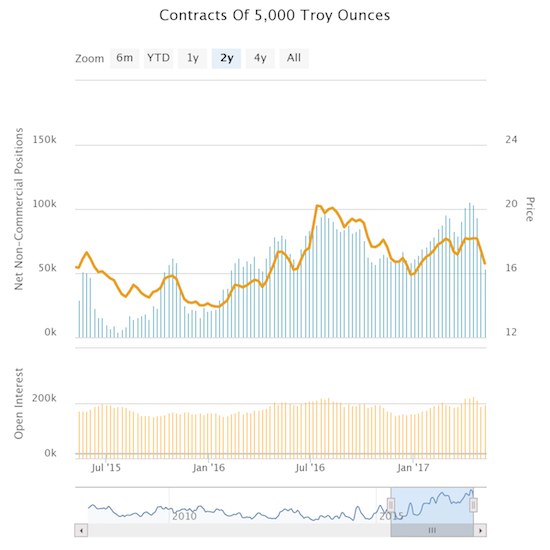
Source: Oanda’s CFTC’s Commitments of Traders
In the week prior, this decline looked like it was timed to get out of the way of the May meeting of the U.S. Federal Reserve. The follow-on decline looks like it has coincided with a bottom in the iShares Silver Trust (SLV).
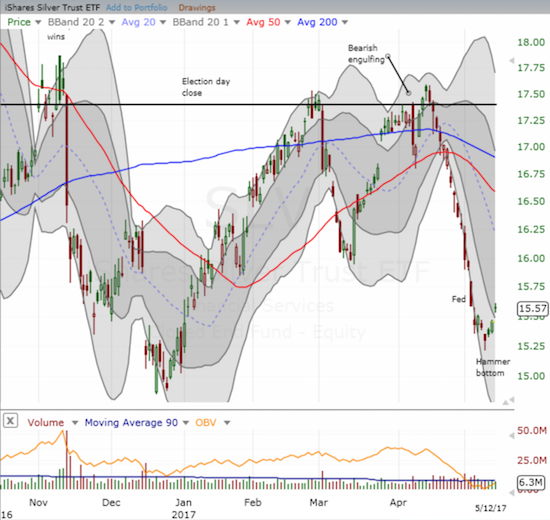
Source: FreeStockCharts.com
On Tuesday, May 9th (the CoT data is good as of May 8th), SLV printed a hammer pattern. A hammer occurs when buyers reject an intraday low and drive the closing price close to or, even better, above the open. The pattern is most meaningful at the tail end of an extended sell-off as it represents the likely exhaustion of sellers. Follow-on buying confirms the pattern if it occurs before the intraday low of the hammer gets violated. In the case of SLV, that buying has occurred for three straight days so far. The 14-straight days of selling that preceded the hammer bottom was a record for SLV, and it certainly set the stage for seller’s exhaustion and a subsequent relief bounce at SOME point.
Assuming this bottom has legs, I peg an immediate upside target at the now declining 50-day moving average (DMA). Invalidation of bottom occurs with a close below the hammer’s intraday low. Since I am now officially bearish on the U.S. dollar index (DXY0), I am much more inclined than usual to bet on this bottom.
Be careful out there!
Full disclosure: long SLV shares and options