
AT40 = 58.3% of stocks are trading above their respective 40-day moving averages (DMAs)
AT200 = 61.1% of stocks are trading above their respective 200DMAs
VIX = 10.6 (volatility index)
Short-term Trading Call: bullish
Commentary
At the end of April, I noted how the stock market headed into May trading with a mix of alerts. AT40 (T2108), the percentage of stocks trading above their respective 40-day moving averages (DMAs), faded from intraday overbought conditions in a move that I typically interpret as bearish. Yet, the S&P 500 (SPY) displayed no reason for concern beyond an eventual retest of support at its 50DMA. Moreover, the volatility index was as sluggish as ever. The start of trading for May followed through on the mixed alerts.
Tech stocks led the way with a tremendous move by the NASDAQ (QQQ)* to a new all-time high. The NASDAQ gapped up and gained 0.7% on the day. The tech-laden index reconfirmed the dominance of bulls and buyers by once again closing on or above its upper-Bollinger Band (BB).
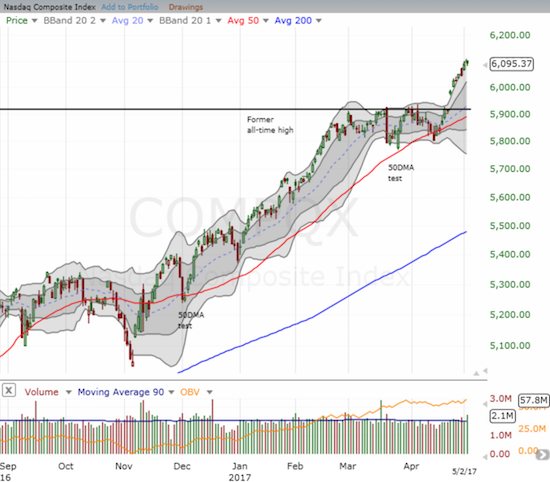
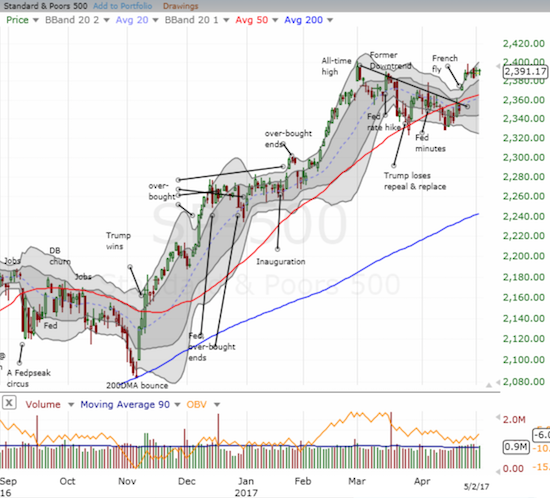
While the NASDAQ was showing off on Monday, the S&P 500 (SPY) barely held onto its gain for the day. Add in Tuesday’s slight gain, and the index is still stuck in the muck of a tight 6-day trading range.
AT40 also failed to follow the NASDAQ’s lead. On Monday, my favorite technical indicator had to recover from an intraday loss. On Tuesday, AT40 closed even with the end of Friday’s plunge.
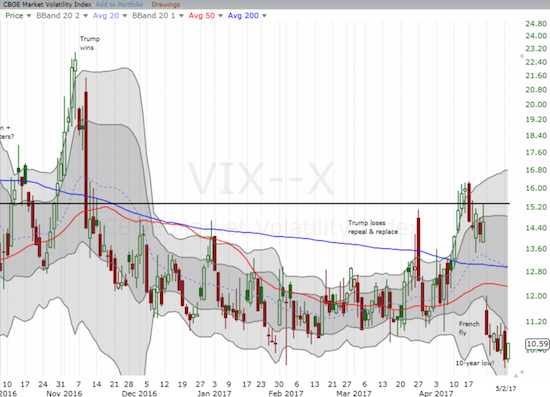
The biggest show-off on Monday was the volatility index, the VIX. The VIX closed at 10.1 and a 10-year low. Since 1990, there have only been 14 other trading days that delivered lower closes. Thinking that the VIX would bounce back quickly given Wednesday’s Fed meeting, soon after the open I sold my put options on ProShares Ultra VIX Short-Term Futures (UVXY). If I had just held into the close, I would have locked in good profits on my overall UVXY call/put hedge.
Taken together, I am still expecting a mild retest of 50DMA support for the S&P 500 at some point this month. Yet the coming results of the Federal Reserve’s May meeting present a small wildcard. The latest economic data hardly justify an imminent rate hike, so it is very possible that the Fed may take this opportunity to lift its foot off the rate hike pedal. If so, I will be VERY interested to see whether the market interprets such a move as bullish because easier money hangs around for longer or bearish because economic weakness may loom larger. See “Gold and Silver Lag A Market Wavering On Two More Rate Hikes for 2017” for additional Fed-speculations.
Speaking of economic weakness, weak auto sales grabbed a lot of headlines on the day. From Reuters:
“Major automakers on Tuesday posted declines in U.S. new vehicle sales for April in a sign the long boom cycle that lifted the American auto industry to record sales last year is losing steam, sending carmaker stocks down.
The drop in sales versus April 2016 came on the heels of a disappointing March, which automakers had shrugged off as just a bad month. But two straight weak months has heightened Wall Street worries the cyclical industry is on a downward swing after a nearly uninterrupted boom since the Great Recession’s end in 2010.”
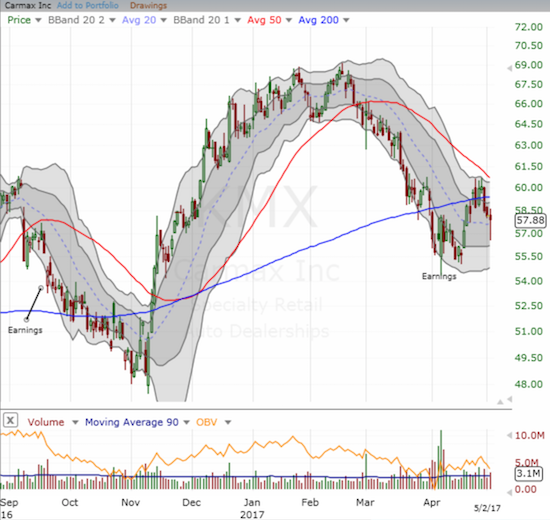
Carmax (KMX) initially sold off on the news, and I took the opportunity to lock in profits on the short position I opened last week based on the technicals. The move turned out to be fortuitous (since my short-term trading call is bullish, I do not hold short positions for long). KMX needs to close at a new post-earnings low to confirm the current 200DMA breakdown and resistance at a sharply downtrending 50DMA.
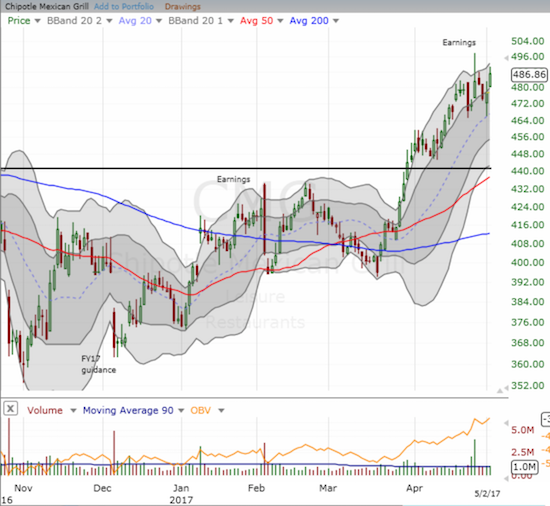
Chipotle Mexican Grill (CMG) has my full attention now. Previously, I made nearly weekly hedged plays on CMG. Following last month’s breakout, I strictly focus on bullish plays. I took advantage of last week’s post-earnings fade to open new positions. On Monday, I thought I got it all wrong as CMG finished reversing all its post-earnings gain and then some. On Tuesday, I was able to take profits on my call options. I am still sitting on a call spread that is now even. CMG may need a week or two more to stabilize into a new pattern.
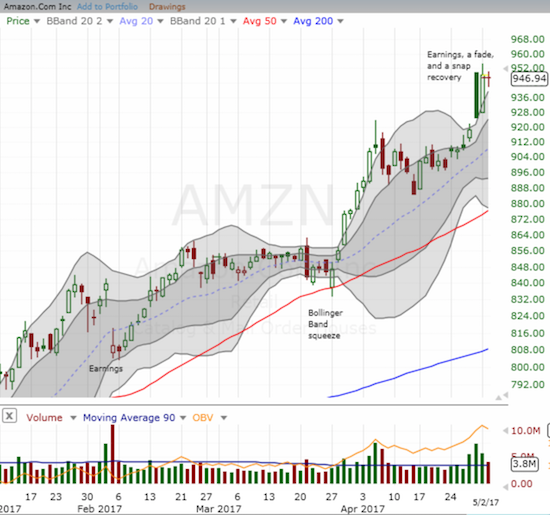
Speaking of wild trading, Amazon.com (AMZN) pulled off a post-earnings move I do not think I have seen in a very long time, maybe ever. As I discussed last week, I went back to my traditional post-earnings play on AMZN by buying soon after the post-earnings open. I stick to the rules even if AMZN is well above its upper-Bollinger Band (BB) as it was on Friday. I started with a low ball offer on a call spread and then added shares as the gap up kept closing. I eventually stopped out those shares. I was completely unprepared to get back into AMZN the very next trading day. On Monday, AMZN rode the wave of big cap tech and managed to trade at a new intraday all-time high before closing just about where it opened post-earnings on Friday. On Tuesday, I rushed into the tiny dip to get back into a small amount of shares. I am absolutely astonished at the ability of such a big cap stock to come back so quickly after such a major fade above its upper-Bollinger Band.
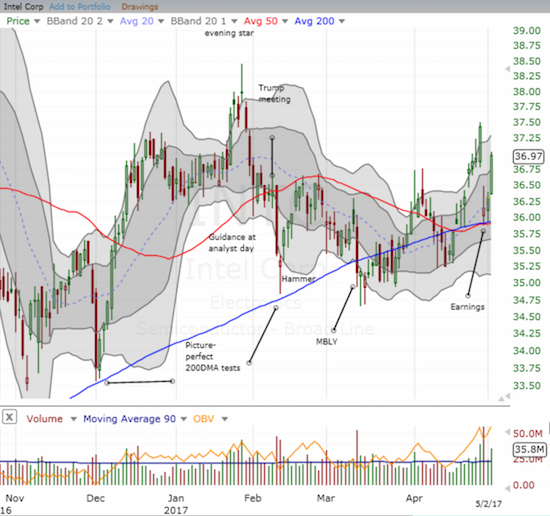
Intel (INTC) has also traded in a manic fashion post-earnings. Last week, I pointed out how INTC gapped down post-earnings but managed to close right on top of support. I took advantage of the sell-off to execute my “between earnings” INTC trade. INTC rode the big cap tech wave on Monday with a decent confirmation of support. Tuesday’s 1.9% surge took my position of call options to a double. I typically follow an options trading rule to take profits on a quick double. However, in this case, I decided to hold a little longer given the exceptionally strong comeback that looks to completely close the post-earnings gap. However, I will have to close out at the first sign of weakness in order to protect the majority of profits.
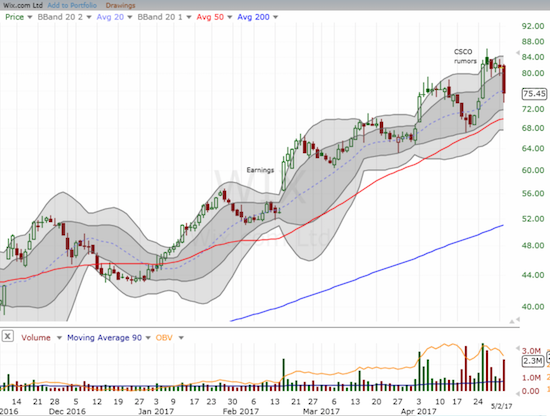
I am watching Wix.com (WIX) like a hawk. This stock turned into an epic miss as I identified it for a buy on a breakout two years ago. I never bought in and failed to watch for new entry points. The stock struggled going into its ultimate bottom in early 2016 around $15 where I figure it would be just another busted tech/internet-related IPO. WIX has soared since then on a very convincing uptrend, and I somehow have failed to latch onto any of several good entry points (gentle tests of the uptrend). Now, I see unusual trading activity with volume picking up substantially since April 3rd. Perhaps rumors of interest from Cisco (CSCO) in WIX is driving the trading. Whatever it is, “something” big seems on the way. Earnings are next week on May 10th before market open. I have not yet decided how to trade this one. A hedged play seems in order given the potential for this high-volume churn to represent distribution.
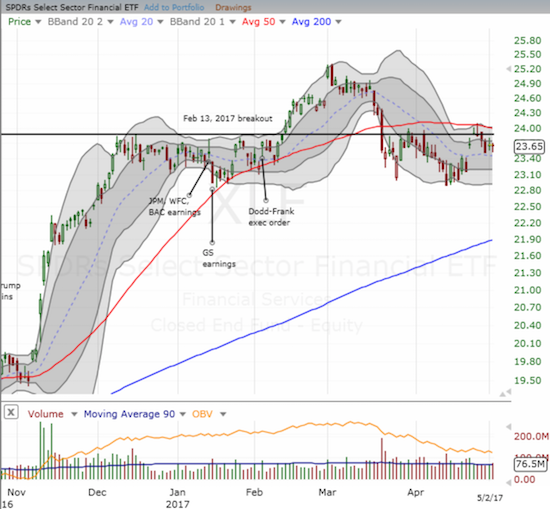
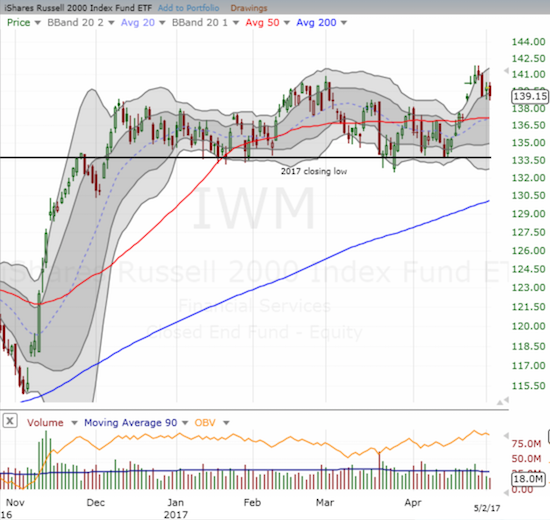
While hanging out with the bulls has been rewarding, I am still looking out the corner of my eye at the lagging and non-confirming financials and small caps. As I pointed out in the last Above the 40 post, these laggards are contributing to mixed signals for May. The message is not lost on me…
Be careful out there!
— – —
FOLLOW Dr. Duru’s commentary on financial markets via email, StockTwits, Twitter, and even Instagram!
“Above the 40” uses the percentage of stocks trading above their respective 40-day moving averages (DMAs) to assess the technical health of the stock market and to identify extremes in market sentiment that are likely to reverse. Abbreviated as AT40, Above the 40 is an alternative label for “T2108” which was created by Worden. Learn more about T2108 on my T2108 Resource Page. AT200, or T2107, measures the percentage of stocks trading above their respective 200DMAs.
Active AT40 (T2108) periods: Day #301 over 20%, Day #121 over 30%, Day #11 over 40%, Day #8 over 50% (overperiod), Day #3 under 60% (underperiod), Day #73 under 70%
Daily AT40 (T2108)
")
Black line: AT40 (T2108) (% measured on the right)
Red line: Overbought threshold (70%); Blue line: Oversold threshold (20%)
Weekly AT40 (T2108)

*All charts created using freestockcharts.com unless otherwise stated
The charts above are my LATEST updates independent of the date of this given AT40 post. For my latest AT40 post click here.
Related links:
The T2108 Resource Page
You can follow real-time T2108 commentary on twitter using the #T2108 or #AT40 hashtags. T2108-related trades and other trades are occasionally posted on twitter using the #120trade hashtag.
Be careful out there!
Full disclosure: long INTC call options, long AMZN call spread and shares, long CMG call spread, long UVXY call options
*Note QQQ is used as a proxy for a NASDAQ-related ETF