
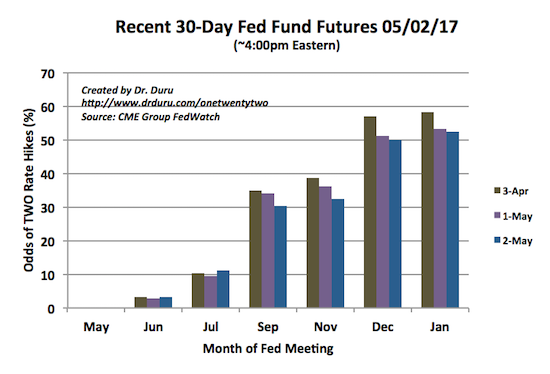
Market expectations for a June rate hike remain as solid as ever. However, expectations for two more rate hikes in 2017 have wavered. A day ahead of the release of the next decision on monetary policy from the U.S. Federal Reserve, Fed Fund futures pricing in two rate hikes by December (assuming 25 basis point hikes) have finally dipped below 50% by the smallest of margins.
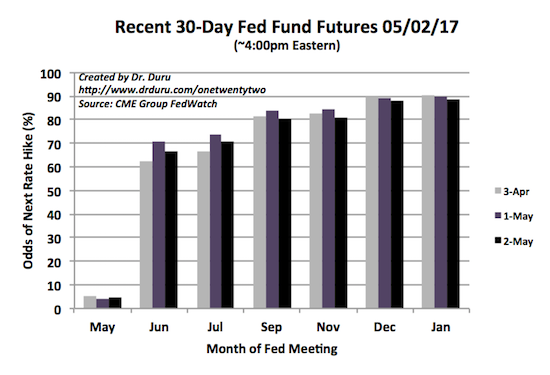
Source: CME FedWatch Tool
The slow erosion of expectations for two more rate hikes in 2017 extends into January, 2018 where the odds of two rate hikes by then are only 52.3%. The increased uncertainty can be seen in financial stocks where the Financial Select Sector SPDR ETF (XLF) has stalled out over the past month as part of a larger trading range extending back to December, 2016.
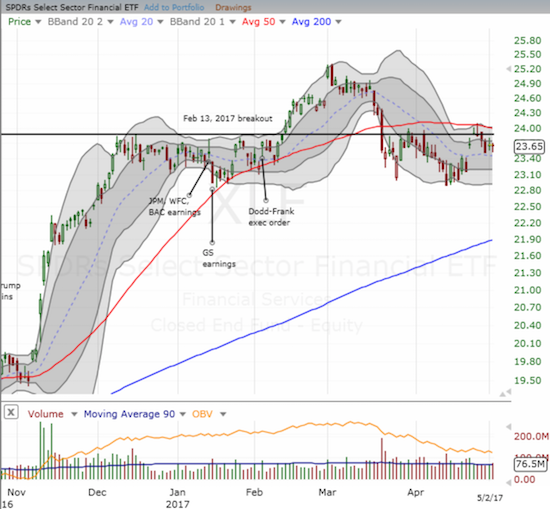
Source: FreeStockCharts.com
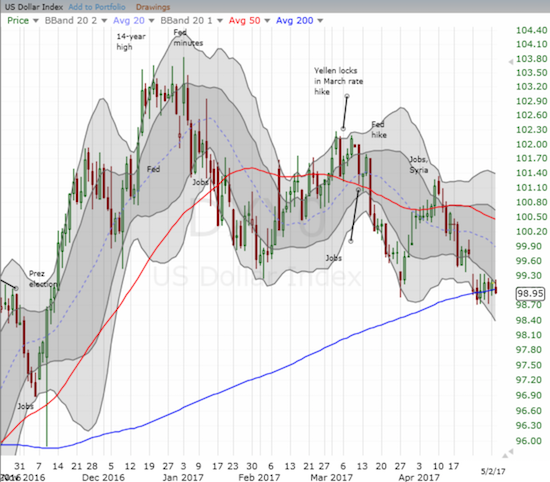
The U.S. dollar index (DXY0) also reflects the uncertainty in the rate outlook as it teeters on major support at its 200-day moving average (DMA).
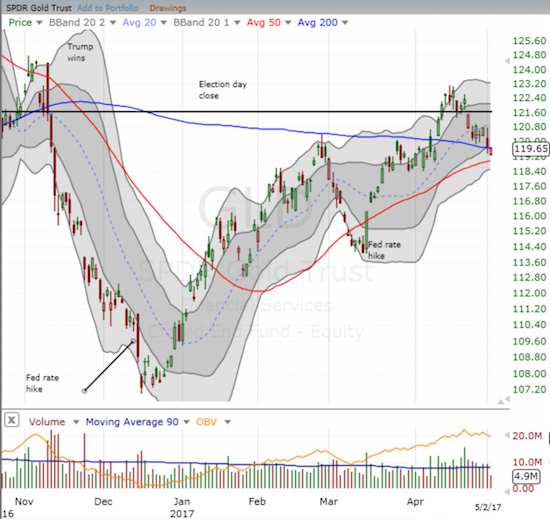
Interestingly, in mid-April gold STOPPED benefiting from the increased uncertainty. The SPDR Gold Shares (GLD) now sits at an important juncture as it tests 200DMA support with 50DMA support directly below.
The picture is even worse for silver. For 12 straight trading days, the iShares Silver Trust (SLV) has closed with a daily loss. This losing streak is SLV’s longest ever since its inception in 2006. The next longest losing streak ended at 10 trading days on November 11, 2015 (data from Yahoo Finance). That sell-off was part of a bottoming process that ended with the Fed’s first rate hike the following month.
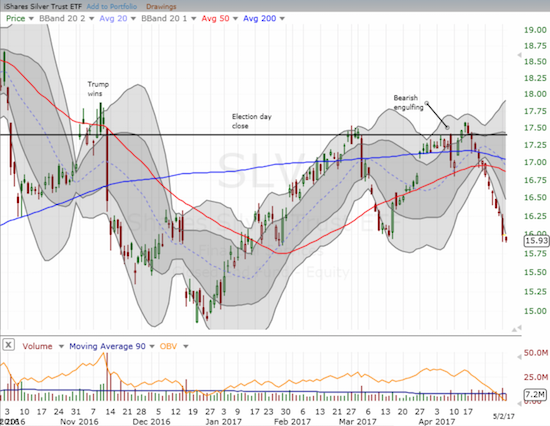
This losing streak happened to come immediately after I declared silver speculators vindicated for running up futures contracts to maximum bullishness. Silver speculators remain stubbornly bullish as net long contracts just pulled away ever so slightly from the historic high last week. So I am left wondering whether SLV is well overdue for a substantial relief rally.
Gold speculators hold net long contracts well off last year’s historic high. Yet, they have been re-accumulating for 6 weeks straight. Perhaps THESE traders are finally ready to confirm what silver speculators have long suspected?
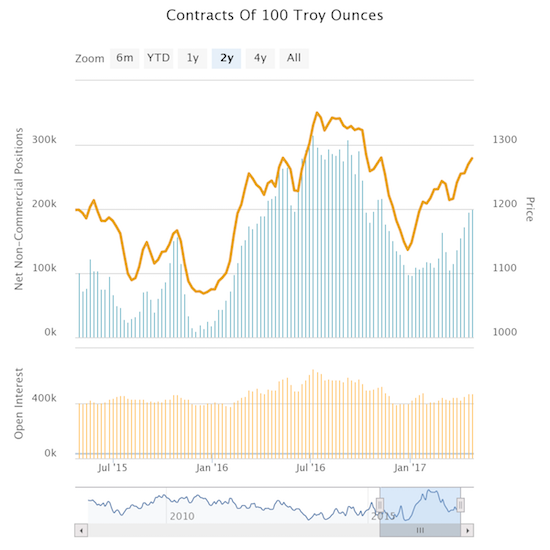
Source: CFTC’s Commitments of Traders
Taken together, all these indicators seem to point to a pre-Fed trade in favor of GLD and/or SLV. The Fed Fund futures hint that the Fed may soon retreat, even if subtly, off its determination to get two more rate hikes done this year. The financials and the dollar index are in agreement. If the precious metals snap into alignment, GLD and SLV could experience a sharp rally.
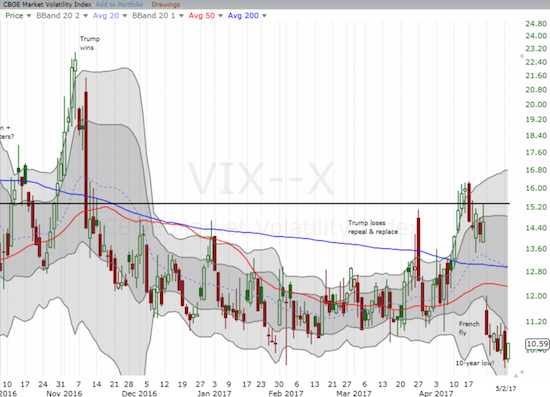
The historically low level of the volatility index, the VIX, makes a pre-Fed trade all the more intriguing. Unlike most Fed meetings, the market is not greeting this meeting with an elevated level of concern. The VIX closed at 10.6, just 4.8% off the previous day’s close at a 10-year low. Monday’s close was in fact the 15th lowest close for the VIX since 1990! This exceptionally low VIX going into a Fed meeting could help amplify any Fed surprise – a likely positive for GLD and/or SLV.
For making this pre-Fed trade, I would typically go for a hedged play going long GLD and short SLV. As I have mentioned before, I never short the precious metals. I am going to stick to that principle and instead buy put options on the iShares 20+ Year Treasury Bond (TLT) for the hedge against getting this trade completely wrong (a refreshed belief in two rate hikes this year should weaken TLT). Since I already have a short-term call spread on GLD, the remaining component to my trade will be call options on SLV. I may also close out the short-end of the call spread. (Note I have held core positions in GLD and SLV shares for many years).
Full disclosure: long GLD shares and call spread, long SLV