
AT40 Status: 58.9% of stocks are trading above their respective 40-day moving averages (DMAs)
AT200 Status: 68.5% of stocks are trading above their respective 200DMAs
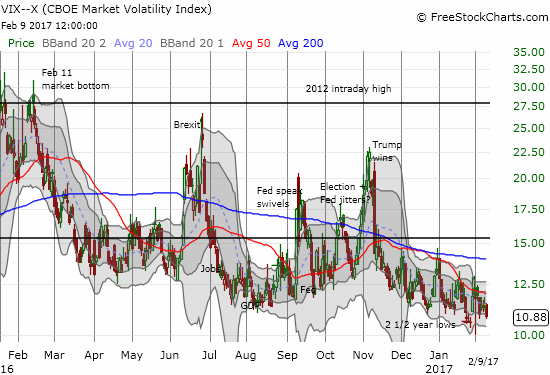
VIX Status: 10.9 (volatility index)
Short-term Trading Call: neutral
Commentary
“We’re way ahead of schedule, I believe. And we’ll be announcing something, I believe, in the next two or three weeks that will be phenomenal in terms of tax.”
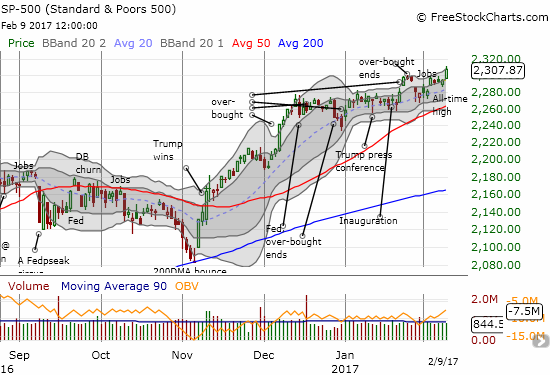
Those words were all the market needed to hear to rally pretty much across the board today. The S&P 500 gained 0.6% and crossed the 2300 barrier on its way to a new all-time high. Accordingly, the volatility index, the VIX, closed near 2 1/2 year lows.
The rally was broad based enough to push AT40 (T2108), the percentage of stocks trading above their respective 40-day moving averages (DMAs), significantly higher to a 58.9% close. Still, my favorite technical indicator has a ways to go to confirm the bullish moves in the stock market.
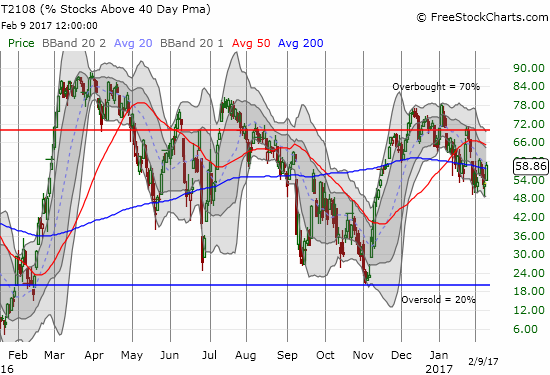
While AT40 put on a good show for the day, it still stands in contrast to the bullish price action on the S&P 500. AT40 did not even surpass the high from last week, set as the market responded bullishly to the January U.S. jobs report. The S&P 500 moved from the bottom to the top of its now uptrending Bollinger Band (BB) channel. Given the anticipation of a “phenomenal tax plan” may play out over several weeks, the index theoretically has a lot of runway to move higher. As a reminder, I cannot reconcile this picture because AT40 is still on the tail-end of a period where it fell from over-bought status four times. This behavior puts AT40 in bearish territory and positions it as a bearish divergence form the S&P 500 until it can recover overbought status. Absent such a move, I cannot swing back to a bearish call until the S&P 500 actually makes a bearish move which at this point would have to be some kind of blow-off. Net-net, my trading call stays at neutral.
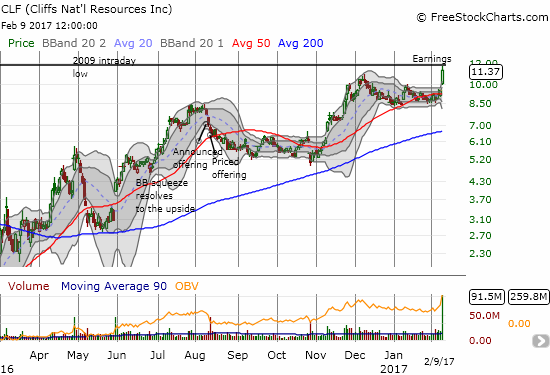
The best news of the day came from the market’s post-earnings reaction to Cliffs Natural Resources (CLF). In an “Above the 40” post last week, I expressed hope that this trade could yet live as CLF hung around its 50DMA. Today’s 19.4% gain was a LOT more than I could have anticipated. I quickly locked in my profits on my call options (albeit early!). I will now watch to see whether CLF can make a historic move by closing above the previous historic low from 2009.
— – —
FOLLOW Dr. Duru’s commentary on financial markets via email, StockTwits, Twitter, and even Instagram!
“Above the 40” uses the percentage of stocks trading above their respective 40-day moving averages (DMAs) to assess the technical health of the stock market and to identify extremes in market sentiment that are likely to reverse. Abbreviated as AT40, Above the 40 is an alternative label for “T2108” which was created by Worden. Learn more about T2108 on my T2108 Resource Page. AT200, or T2107, measures the percentage of stocks trading above their respective 200DMAs.
Active AT40 (T2108) periods: Day #245 over 20%, Day #65 over 30%, Day #64 over 40%, Day #62 over 50% (overperiod), Day #4 under 60% (underperiod), Day #11 under 70%
Daily AT40 (T2108)
")
Black line: AT40 (T2108) (% measured on the right)
Red line: Overbought threshold (70%); Blue line: Oversold threshold (20%)
Weekly AT40 (T2108)

*All charts created using freestockcharts.com unless otherwise stated
The charts above are my LATEST updates independent of the date of this given AT40 post. For my latest AT40 post click here.
Related links:
The T2108 Resource Page
You can follow real-time T2108 commentary on twitter using the #T2108 or #AT40 hashtags. T2108-related trades and other trades are occasionally posted on twitter using the #120trade hashtag.
Be careful out there!
Full disclosure: no positions
From Tom McClellan: “low VIX, low worry and high complacency are producing low QQQ volume.” As he points out, when investors get complacent and stop worrying, that’s usually the sign of an impending market top.
My own indicator is more qualitative than quantitative. I can’t find anything I want to buy that’s ‘cheap’ enough to warrant the risk. Nada.
And I’m itching to buy something. That’s also a bad sign. It’s a ‘dumb money’ indicator.
The longer this uptrend goes without a correction, the nastier the correction will be.
I love nasty corrections.
Bring it on! I am itching to buy as well….sounds like a great title for my next Above the 40….