
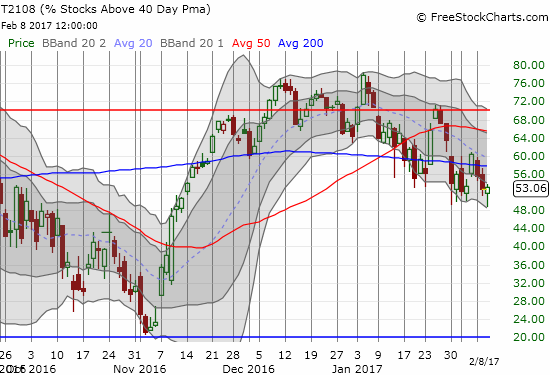
AT40 Status: 53.1% of stocks are trading above their respective 40-day moving averages (DMAs)
AT200 Status: 66.8% of stocks are trading above their respective 200DMAs
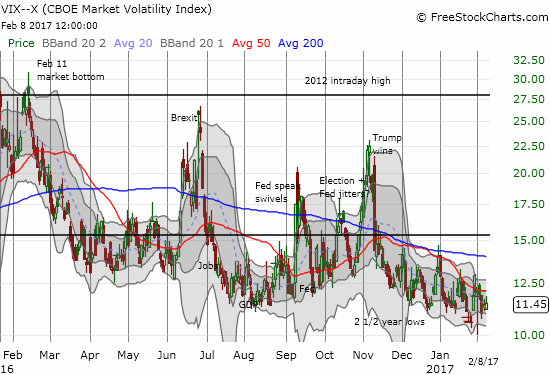
VIX Status: 11.5 (volatility index)
Short-term Trading Call: neutral
Commentary
As is so typical of this go-stop-stop stock market, this week started without immediate follow-through to a fresh all-time high on the S&P 500 (SPY). That new record occurred partially in response to last Friday’s U.S. jobs report for January.
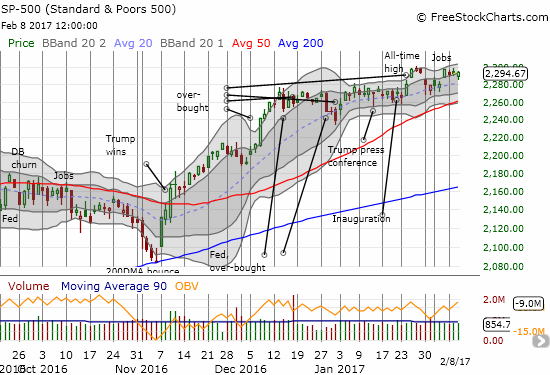
In my last “Above the 40” post, I noted “the current rally has been one of the more stealthy (and halting) ones in a long time.” Today I stumbled upon a chart that seems to validate my observation. It turns out that the S&P 500 has not been this “boring” since at least 1970. The index has failed to notch a 1% intraday gain for 37 straight trading days. Over this time, the index has gained 1.8%. This streak also happened to start the day after the Fed’s December rate hike.
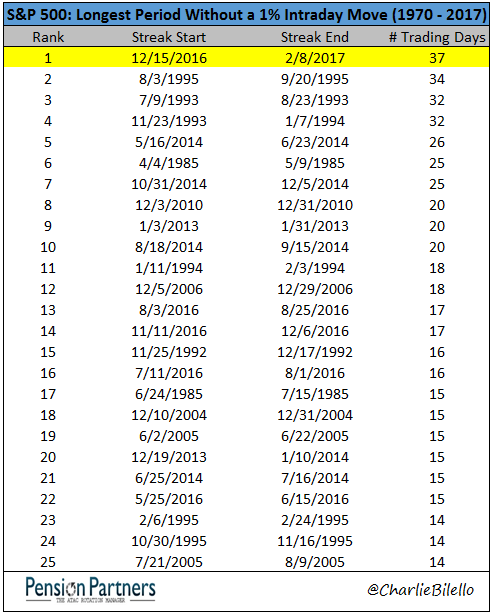
Source: StockTwits
This slowdown in trading helps explain why the volatility index, the VIX, continues to plumb 2 1/2 year lows which are in turn near levels last seen in early 2007…right before the financial crisis.
While the stock market “slumbers” its way to sporadic all-time highs, AT40 (T2108), the percentage of stocks trading above their respective 40-day moving averages (DMAs), continues to limp its way lower. The bearish divergence becomes more stark with each new all-time high (or close revisit) on the S&P 500 that gets followed by lower levels on my favorite technical indicator. At its lowest point today, AT40 fell to its third lowest level since the November election.
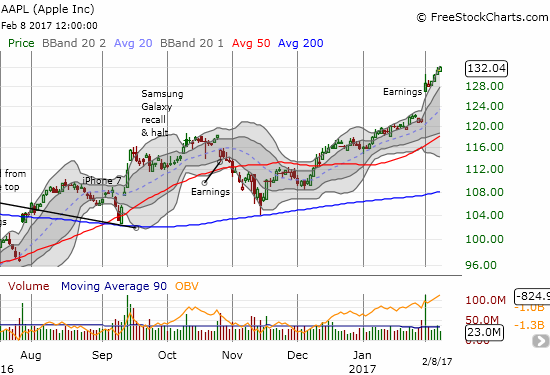
This divergence suggests there is underlying weakness in the market while a select group of strong stocks continue to push higher. Apple (AAPL) is definitely one of the ringleaders trying to encourage the rest of the market to higher levels. The uptrend kicked into a higher gear after earnings – there is hardly anything more bullish for a stock than buyers willing to keep pushing higher along the uppermost Bolliner Band (BB).
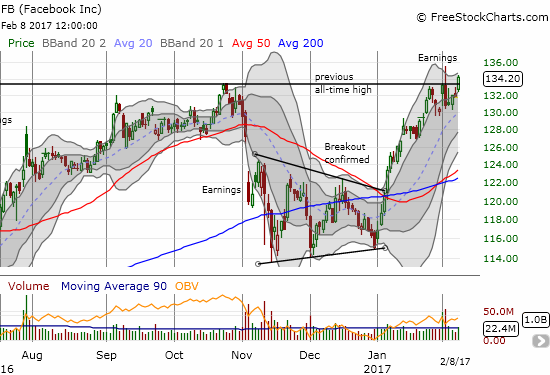
Facebook also returned to the act by notching a new all-time high that essentially invalidated last week’s post-earnings fade.
Today’s Nightly Business Report provided some great fund flow data to give important context for the post-election rally. The fund flows have been VERY impressive. The $47B in November and the $59B in December that poured into U.S. ETFs were the strongest two consecutive months since at least 2008.
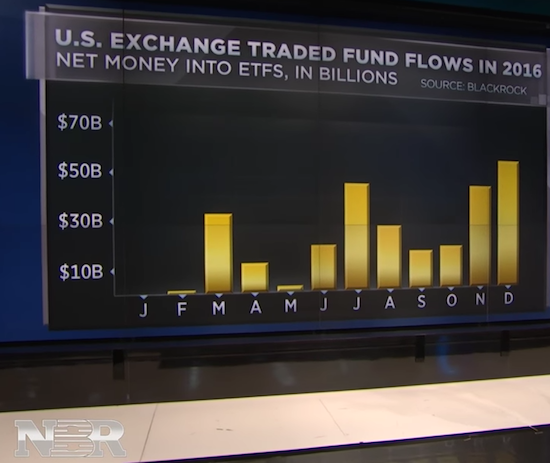
Source: Nightly Business Report
Those paying attention to geo-politics should notice that U.S. ETF fund flows surged post-Brexit in July, 2016 by the same amount as they did in the wake of the U.S. election. If ever we needed confirmation of the market’s preference to follow big events with a lot of buying, the graphic above displays it clear as day.
This year started off well on a global basis. Nightly Business Report went from U.S. ETFs to the global view for January. The fund inflows were extremely strong: the best January on record and the highest since September, 2008.
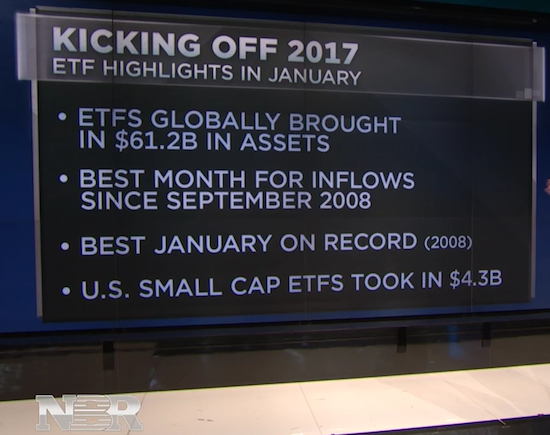
Source: Nightly Business Report
The VIX barely stands a chance with these billions upon billions constantly pouring into financial markets!
These fund flows of course beg the question: are we seeing the climax of exuberance in the market? After all, the Fed is tightening, ever so slowly, monetary policy. After years of constantly pouring their own monies into markets, most of the globe’s central banks are not likely to prime the pump even further this year. Even China just hiked interest rates…ever so slightly. This week, the Reserve Bank of Australia suggested that it is likely done even considering rate cuts for the time-being. Last week the Bank of England gave a thinly veiled warning that monetary policy is not likely to loosen further given the outlook for inflation and weakness in the British pound.
So does the S&P 500 slumber to freshen up for a big breakout – like a coiled spring? Or does the S&P 500 slumber while termites slowly eat away at its load-bearing walls? These questions keep me locked on neutral for my short-term trading call.
And then there is gold (GLD).
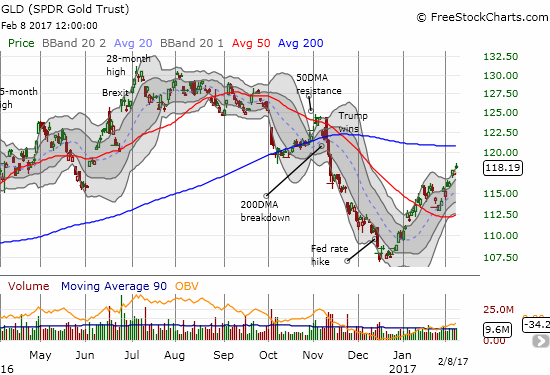
In what looks like a repeat from a year ago, SPDR Gold Shares (GLD) is rallying sharply in the wake of the last Fed rate hike. Gold investors seem to revel in trying to think two steps ahead. Whereas last year I think the rally was about fears the Fed rate hike would crush the economy and then force the Fed to cut rates, I cannot back into a story for this rally. Economic optimism is running high and monetary policies are not likely to ease further. So now I am guessing that gold bugs fear inflation is finally coming with all the plans for tax cuts and higher government spending in the U.S. It remains to be seen whether that inflation story comes to pass and even whether the Fed will be too slow to respond if it does come.
— – —
FOLLOW Dr. Duru’s commentary on financial markets via email, StockTwits, Twitter, and even Instagram!
“Above the 40” uses the percentage of stocks trading above their respective 40-day moving averages (DMAs) to assess the technical health of the stock market and to identify extremes in market sentiment that are likely to reverse. Abbreviated as AT40, Above the 40 is an alternative label for “T2108” which was created by Worden. Learn more about T2108 on my T2108 Resource Page. AT200, or T2107, measures the percentage of stocks trading above their respective 200DMAs.
Active AT40 (T2108) periods: Day #244 over 20%, Day #64 over 30%, Day #63 over 40%, Day #61 over 50% (overperiod), Day #3 under 60% (underperiod), Day #10 under 70%
Daily AT40 (T2108)
")
Black line: AT40 (T2108) (% measured on the right)
Red line: Overbought threshold (70%); Blue line: Oversold threshold (20%)
Weekly AT40 (T2108)

*All charts created using freestockcharts.com unless otherwise stated
The charts above are my LATEST updates independent of the date of this given AT40 post. For my latest AT40 post click here.
Related links:
The T2108 Resource Page
You can follow real-time T2108 commentary on twitter using the #T2108 or #AT40 hashtags. T2108-related trades and other trades are occasionally posted on twitter using the #120trade hashtag.
Be careful out there!
Full disclosure: long GLD, long GLD call options