
(T2108 measures the percentage of stocks trading above their respective 40-day moving averages [DMAs]. It helps to identify extremes in market sentiment that are likely to reverse. To learn more about it, see my T2108 Resource Page. You can follow real-time T2108 commentary on twitter using the #T2108 hashtag. T2108-related trades and other trades are occasionally posted on twitter using the #120trade hashtag. T2107 measures the percentage of stocks trading above their respective 200DMAs)
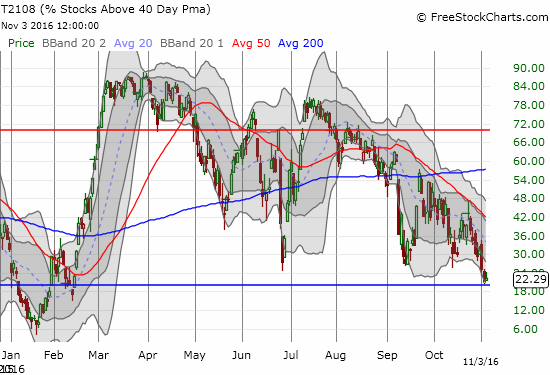
T2108 Status: 22.3%
T2107 Status: 48.1%
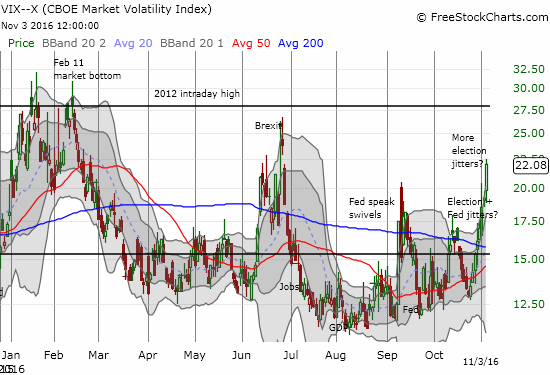
VIX Status: 22.1 (a 14.3% gain, the VIX was as high as 22.6)
General (Short-term) Trading Call: cautiously bullish
Active T2108 periods: Day #179 over 20%, Day #5 under 30% (underperiod), Day #10 under 40%, Day #27 under 50%, Day #42 under 60%, Day #68 under 70%
Commentary
Surprising bullish divergence with $SPY red while %stocks>40DMA gains. I don't think this will last though. Oversold coming (<20%) #T2108
— Dr. Duru (@DrDuru) November 3, 2016
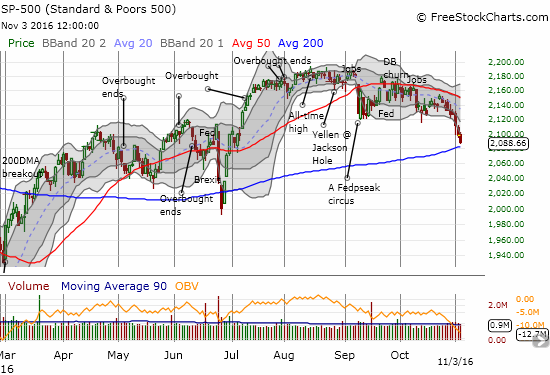
Just last week, I assumed that the S&P 500 (SPY) would maintain its trading range going into the U.S. Presidential election. Instead, the 200-day moving average (DMA) has finally turned on its magnetic attraction. (Yesterday, my former mentor TraderMike reminded me of the likelihood that the market was setting up for a major election-related test of 200DMA support in “How to Get a Read on the Market“).
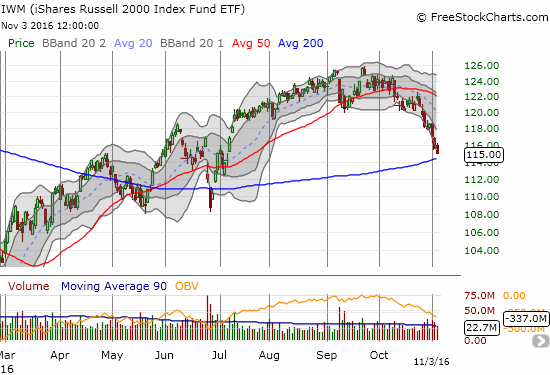
Last week, I pointed to small cap stocks, via iShares Russell 2000 (IWM), as a part of the bearish divergence pointing to more selling pressure in the market. IWM is now testing support at its 200DMA.
The NASDAQ (QQQ) has essentially confirmed a double-top by cracking the low from September. A 200DMA test would be a very serious continuation of the sell-off and would surely send T2108 into oversold territory (less than 20%). Perhaps such a milestone will be required to bring buyers back into the market with confidence regardless of the catalyst(s) driving the market down.
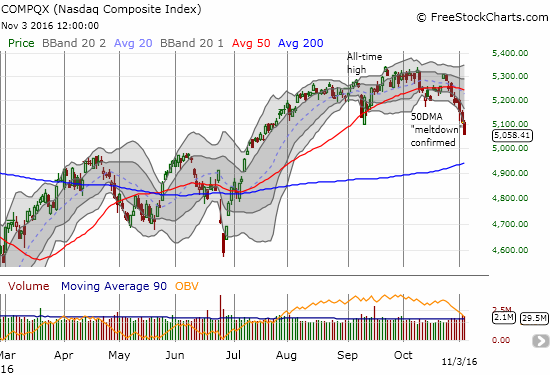
Of course, traders must always approach lines of support and resistance with caution. These important lines in the sand are no match for momentum. Just look at how the NASDAQ cleaved right through its 200DMA support in May and even more convincingly in June. In other words, when these tests occur, I still take trades one day at a time.
The bearish divergences have now converged into noticeable selling. The growing weakness in the stock market should now be obvious to everyone, including participants who do not (formally) follow technicals. As is often the case, once the selling becomes obvious, it is time to consider the contrarian case – especially when a palpable event looms to create gloomy and jittery overhang (aka the US Presidential election). As I anticipate oversold conditions in coming days, I am preparing my mind for getting bullish. Accordingly, I have changed my trading call from neutral to cautiously bullish. Right on time, T2108, the percentage of stocks trading above their respective 40DMAs, closed higher on the day even after fading sharply from its high. This gain stood in stark contrast to the gloomy bearishness shown above and of course caught my keen interest even though the move is not nearly as dramatic as the reversal the day after the Brexit one-day sell-off.
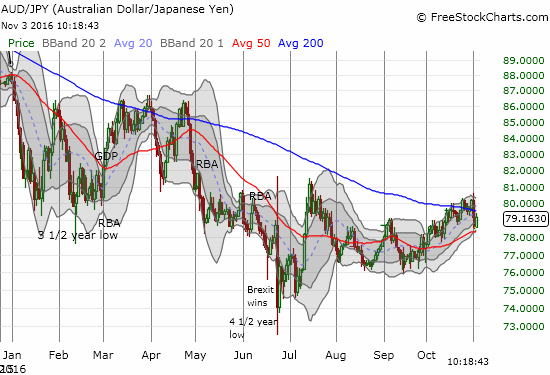
Now that I am thikning more bullishly, I suddenly recognized a bullish divergence that has been in play for quite some time: the Australian dollar (FXA) versus the Japanese yen (FXY). AUD/JPY completely failed to confirm the increasingly bearish undertones of the market that led to today’s rendezvous with oversold conditions. For example, compare the reaction of AUD/JPY to post-Brexit to today’s presumed election jitters. Not only is AUD/JPY far above its Brexit levels, but also the currency pair managed to break out above 200DMA resistance last week. Just to show off, AUD/JPY managed to bounce off uptrending 50DMA support on a day of selling in the stock market.
After it is all said and done, the volatility index (VIX) now holds the wildcard. The VIX increased for the EIGHTH straight day. Yesterday’s Federal Reserve pronouncement on monetary policy was more of the same and generated only the breifest of relief to the stock market. The VIX was off to the races again today with a 14.3% run-up.
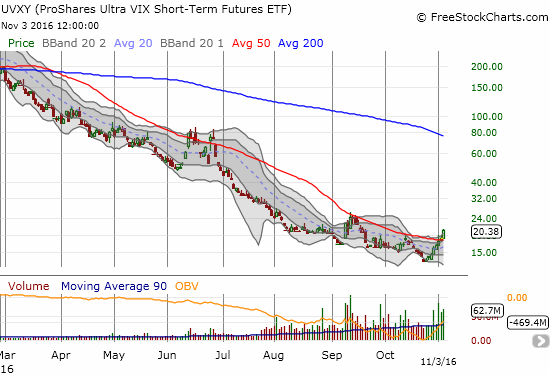
The resilience in the VIX means that my attempts to fade volatility have been completely thrashed. It is now time for me to stand down and wait for the VIX to show some weakness rather than try to anticipate it. Volatility is so strong that the long-suffering ProShares Ultra VIX Short-Term Futures (UVXY) actually managed to make a VERY rare higher high.
With my cautiously bearish trading call, I have triggered my trading rules for oversold conditions. The VIX sits right at the center of my attention. For example, I am looking for a moment when the VIX makes an extremely strong move higher, especially with a gap up, followed up by a quick reversal. See the post-Brexit response as a great example. If the VIX fails to close higher, I will trigger bullish trades once the VIX closes below today’s low.
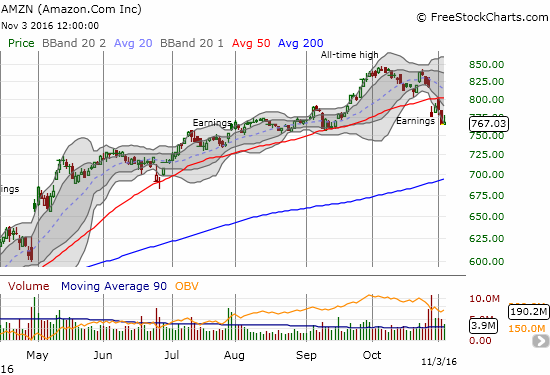
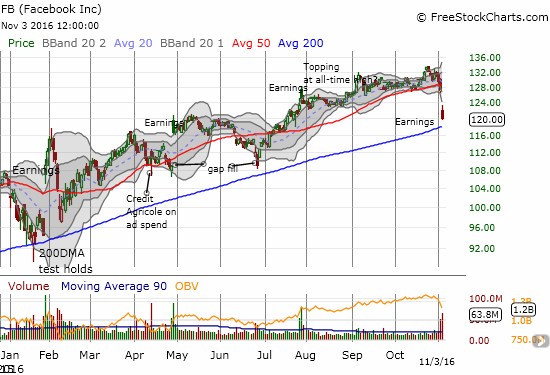
As far as individual stocks go, Amazon.com (AMZN) and Facebook (FB) have my full attention. These are two market darlings that have suddenly run afoul of buyers and attracted committed sellers. In the case of AMZN, the stock hit my $800 upside target (and test of 200DMA resistance) well ahead of schedule. Yesterday, AMZN confirmed that resistance with a close at a fresh post-earnings low. This bearish move may have sealed the fate on my post-earnings trade.
Facebook (FB) reported earnings that were not received well at all. FB gapped down and closed well below its lower-BB for a 5.6% loss. Notice in the chart below that elling volume surged just ahead of earnings. All year, the uptrending 200DMA support has held as a firm guide to higher prices. This latest test could be the most critical of all. Traders can buy speculatively on a closer test of the 200DMA or more conservatively wait for a new post-earnings high. I decided to go ahead and start a first tranche with two call options expiring next week at the $123 strike.
— – —
FOLLOW Dr. Duru’s commentary on financial markets via email, StockTwits, Twitter, and even Instagram!
Daily T2108 vs the S&P 500
")
Black line: T2108 (measured on the right); Green line: S&P 500 (for comparative purposes)
Red line: T2108 Overbought (70%); Blue line: T2108 Oversold (20%)
Weekly T2108

*All charts created using freestockcharts.com unless otherwise stated
The charts above are the my LATEST updates independent of the date of this given T2108 post. For my latest T2108 post click here.
Related links:
The T2108 Resource Page
Be careful out there!
Full disclosure: long SDS, long UVXY shares and short UVXY call and long UVXY put options, short AUD/JPY, long FB call options, long AMZN call spread