
(T2108 measures the percentage of stocks trading above their respective 40-day moving averages [DMAs]. It helps to identify extremes in market sentiment that are likely to reverse. To learn more about it, see my T2108 Resource Page. You can follow real-time T2108 commentary on twitter using the #T2108 hashtag. T2108-related trades and other trades are occasionally posted on twitter using the #120trade hashtag. T2107 measures the percentage of stocks trading above their respective 200DMAs)
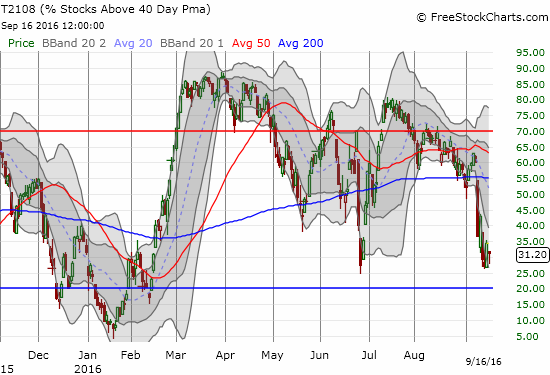
T2108 Status: 31.2%
T2107 Status: 66.3%
VIX Status: 15.37 (closed right at the 15.35 pivot line!)
General (Short-term) Trading Call: neutral
Active T2108 periods: Day #146 over 20%, Day #2 over 30% (overperiod), Day #4 under 40% (underperiod), Day #6 under 50%, Day #6 under 60%, Day #34 under 70%
Commentary

This week’s stock market action almost seemed to confirm that the latest bout of volatility in the stock market shook out a lot of sellers. In the last T2108 Update, I laid out the case for a potential bounce from Tuesday’s selling. The big bounce came Thursday, September 15, and it almost astounded me as much as the violent selling last Friday….but on the NASDAQ (QQQ), not the S&P 500.
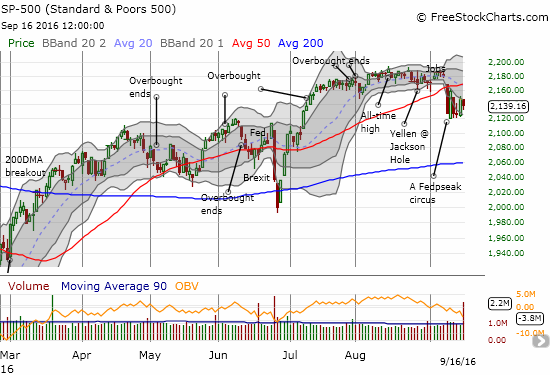
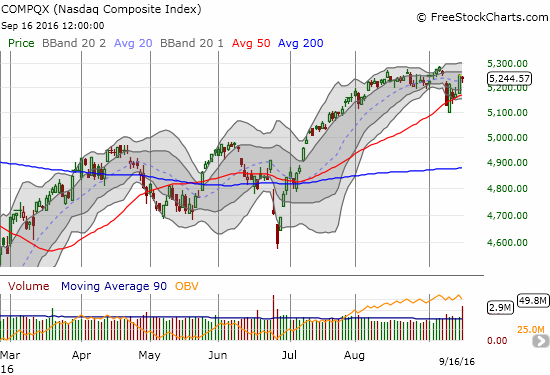
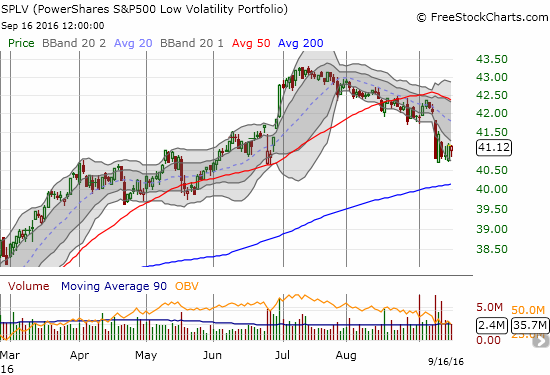
The S&P 500 is stuck in a new lower trading range where sellers have failed to follow-through and buyers have shown waning interest. The NASDAQ looks unquestionablt healthier. Its 50DMA breakdown was marginal and lasted just a day on a closing basis. The tech-laden index rallied sharply from there, retested support twice, and surged on Thursday to a near gap close. This divergence is quite remarkable. The divergence this week mirrors an on-going divergence between PowerShares S&P 500 Low Volatility ETF (SPLV) and PowerShares S&P 500 High Beta ETF (SPHB). Think of SPHB as consisting of stocks with similar risk profiles as those in the NASDAQ. SPHB has pulled back mildly and held 50DMA support. SPLV is suffering from a 2-month downtrend that accelerated with last Friday’s sell-off. I still think this divergence is not sustainable and likely signals a larger sell-off on the horizon.

Despite my concerns for the market’s health over the horizon, I am sticking with the neutral short-term trading call. Sellers were not quite convincing this week, and I get flashbacks of post-Brexit every time I think too hard about the case of the bears.
The message from T2108, the percentage of stocks trading above their respective 40-day moving averages (DMAs), suggests the stock market may have already reached “close enough” to oversold conditions (below 20%). The current sell-off pushed T2108 as low as 26.2% before Thursday’s dramatic turnaround. The closing low exactly matched the closing low from the immediate wake of post-Brexit selling. My lesson from that June is to take seriously the potential of a bottom here. I am duly recalling how Brexit shook out enough sellers to send the indices soaring for about three weeks. So if I am correct about a larger sell-off on the horizon, sellers will have to bulk up and drive T2108 into true oversold territory.
The bears are still making their presence felt on volatility even though the volatility index, the VIX, printed its lowest close since last Friday’s sell-off. The VIX has not reversed even half of its surge from last Friday. The VIX ended the week right on the critical 15.35 pivot line (I can’t make this stuff up!). This move means that bears are still holding out some hope to reignite more significant selling. If this line fails to hold, I expect buyers to sustain at least a few days of follow-through pressure on the bears similar to what has happened in earlier episodes.
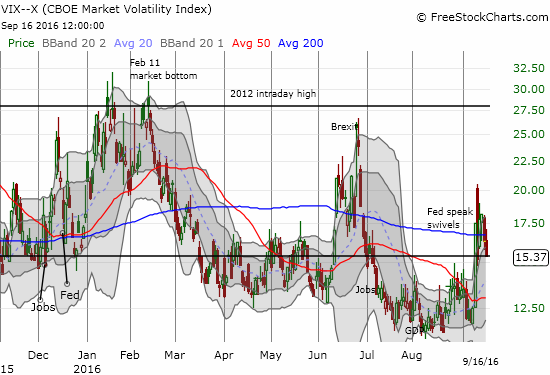
I am surprised that the VIX ended the week with its lowest close since last Friday’s sell-off. The 5.7% loss on the day stood in contrast to the losses on both indices, and, even more importantly, to the confusion on interest rates. (Perhaps the monthly expiration of options led to significant relief). Thanks to today’s U.S. inflation data, the timing for the next rate hike shot forward to December from March, 2017. The week began with odds set for a December rate hike.
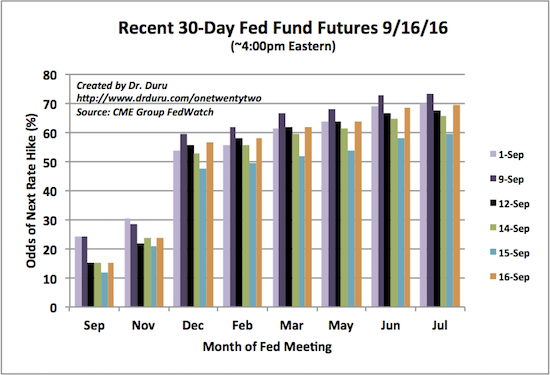
Source: CME FedWatch Tool
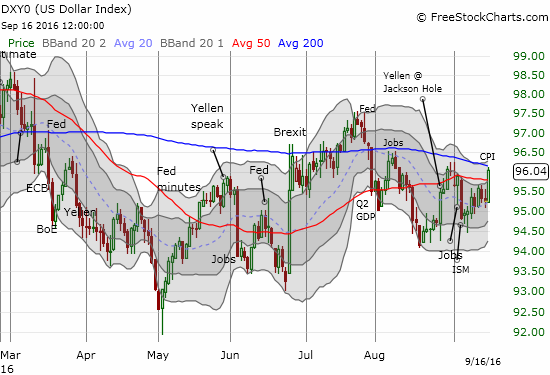
The U.S. dollar index (DXY0) was on balance a big winner on the week. The inflation data not only helped drive rate expectations forward but were also convincing enough to finish a complete reversal of the dollar index’s loss on the heels of weak ISM data 10 days ago. The index now faces another important test of 200DMA resistance as it closed the week near its post-Jackson Hole high. (I went ahead and purchased a fresh tranche of put options on CurrencyShares Japanese Yen ETF (FXY)).
So the Federal Reserve’s pronouncements on monetary policy on Wednesday, September 21 loom large over the market. We can only hope the Fed will settle the confusion, but I am bracing for anything. The FedHeads and FedSpeak initiated a bout of confusion and roiling in the markets that was further enhanced by the back and forth of economic data. (When can we vote on just silencing the noise?!). Given these dynamics, I am expecting volatility to remain elevated going into the announcement. I also fully expect the Fed to work its typical anti-volatility magic, thus setting up this latest pre-Fed anti-volatility trade. I will try to wait until the hours before the announcement to make this trade. For now, I am staying net long volatility.
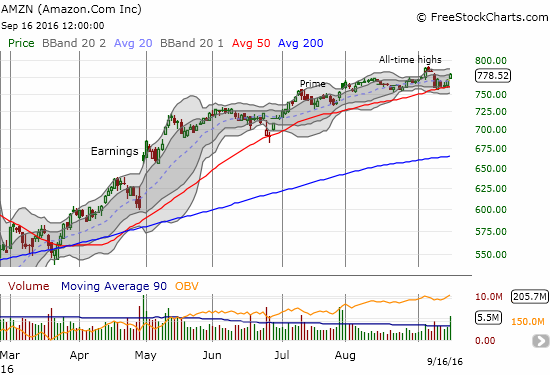
In my last T2108 Update, I pointed to the trade in AMZN as a sentiment driver. The stock managed to hold its 50DMA support in picture-perfect style and held up a proud banner for buyers and bulls. AMZN even showed off on Friday with a bout of relative strength that represents a break out from the congestion at support.
While the acrobatics in AMZN displayed strong form, Apple (AAPL) was the true marquee performer…and my biggest miss perhaps of the year. When I reviewed the technicals for AAPL, the stock broke through 50DMA support and closed just above 200DMA support. I rode the bearish sentiment, anticipated a further breakdown, and dropped my previous strategy of buying call options every two weeks. If I had stuck to the plan, fought the bearish tidings, and wished for the best, I would have enjoyed at least part of AAPL’s remarkable 11.4% run-up for the week. The irony runs deeper given my reaction to the initial selling following the announcement of the iPhone 7:
“Today my latest trade on AAPL blew up. An analyst downgrade and the company’s refusal to release iPhone pre-order numbers seemed to combine to take down AAPL. I have also read multiple pieces wringing hands over AAPL’s growth potential given an underwhelming new product launch in the iPhone 7. Ironically, traders usually fade AAPL after a product announcement, but THIS time AAPL managed a strong close. I was readying myself for a nice breakout…
If I had not seen the stock’s reaction, I would have assumed AAPL just gave the market good news: demand is so high, they cannot keep up! Perhaps instead the interpretation is that AAPL will forgo sales….? Whatever is going on, the droop in AAPL now puts the converged 50 and 200DMAs in play. Needless to say, I have placed my 2-week call buying strategy for AAPL on the shelf…”
Sure enough, reports throughout the week confirmed the tremendous demand implied by AAPL’s announcement.
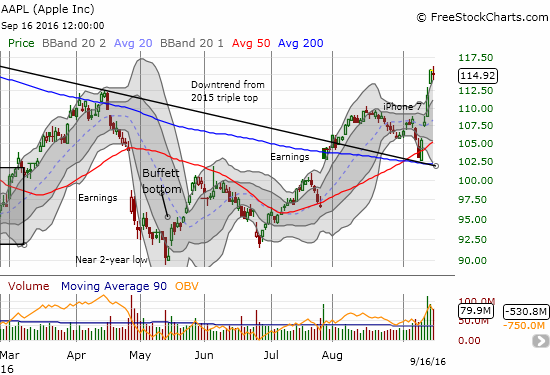
Just to deepen the irony, I loaded up on put options as a trade on a pullback from extremely overbought trading conditions. AAPL closed three straight days above its upper-Bollinger Band (BB) at the end of this quick burst. After this trade, I am itching to get back on the AAPL rocket.
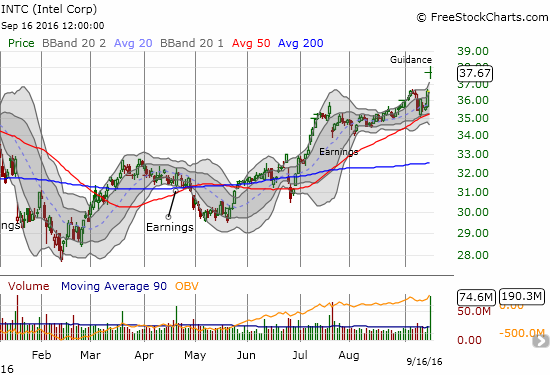
Apple had some help in powering the NASDAQ higher. Intel (INTC) gapped up and gained 3.0% on the day after reporting guidance for Q3. INTC now trades back at the highs from late 2014 even after the market delivered three poor receptions in a row to 2016 earnings reports – certainly a strange way to accomplish such a feat. This behavior makes me wonder about the sustainability of a GOOD reception to earnings news! This year, I have not diligently applied my INTC trading strategy of buying between earnings. I find myself caught empty-handed in the middle of this rally.
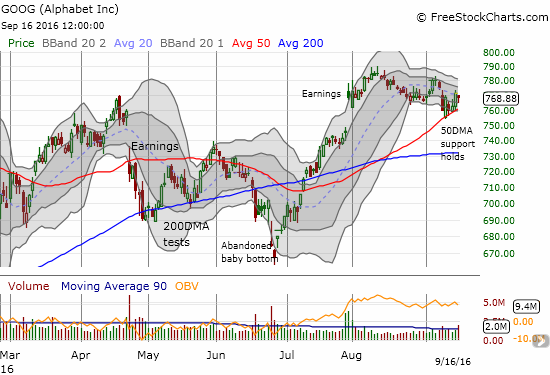
Alphabet (GOOG) is another well-watched stock that performed well at support. GOOG opened the week with a gap down that neatly stopped at 50DMA support. Each day until Friday, GOOG made sure to kiss the 50DMA support line. In the last T2108 Update, I singled out GOOG for call options I bought as a concession to the odds for an imminent bounce in the market. I bought on the 14th only to watch GOOG fade from its high. The next day, GOOG was very sluggish out the gate despite and lagged the market’s rally at the time. I decided to lock in a small profit only to watch GOOG finally catch up. I left a good chunk of change on the table with that trade.
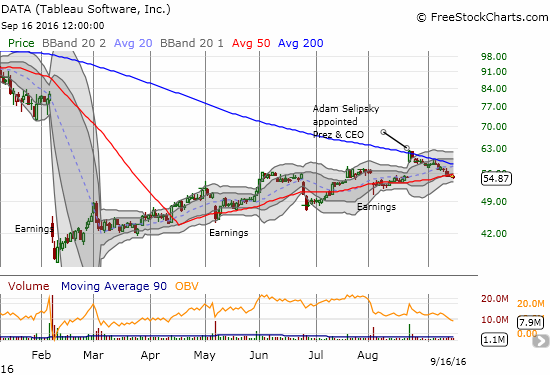
While big cap tech stocks reached higher, Tableau finished a fill of a gap up. I was greatly surprised by the huge surge on the simple news of a change in the executive suite. Yet, with DATA toying once again with an uptrending 50DMA, I am tempted to bet on a rebound similar to the past three times.
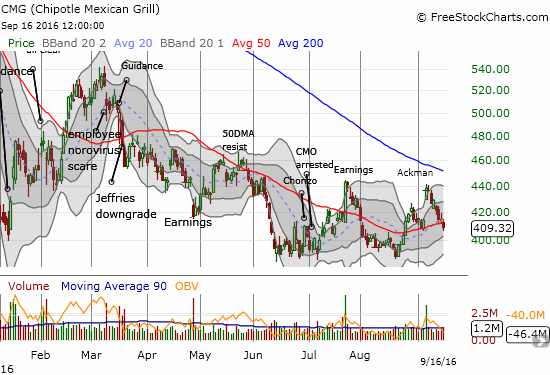
Speaking of gap reversals to the downside, Chipotle Mexican Grill (CMG) completely reversed and then some the gap up from news of the Bill Ackman – Pershing Square position. My doubt proved correct. With the 50DMA support faltering and the Ackman halo vanquished, I am going back to my previous strategy of buying a small amount shares and buying weekly puts. More big (and unpredictable) spikes up/down ahead…
In early June, I discussed the potential for a bottom in the Lendingclub (LC). LC has managed to hold that bottom long enough to punch through a big breakout over the past month. As LC drives into May’s big gap down, time ticks away on my fistful of call options that I bought to play the potential bottom. I think the position is also fighting against the clock that could be ticking away on a bigger market sell-off. =gulp=

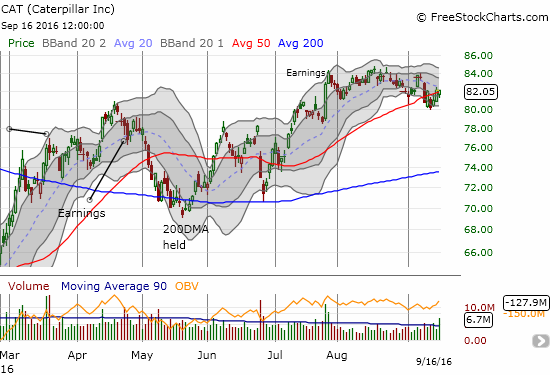
Finally, Caterpillar (CAT). I gave up on my put options on CAT until last Friday’s sell-off delivered a small profit. The profits disappeared on Monday’s rally and returned when CAT gapped down below 50DMA support the next day. I decided to keep holding in anticipation of follow-through that never materialized. I did not renew the position and prefer, for now, to wait out the Fed meeting before executing my next move.
— – —
FOLLOW Dr. Duru’s commentary on financial markets via email, StockTwits, Twitter, and even Instagram!
Daily T2108 vs the S&P 500
")
Black line: T2108 (measured on the right); Green line: S&P 500 (for comparative purposes)
Red line: T2108 Overbought (70%); Blue line: T2108 Oversold (20%)
Weekly T2108

*All charts created using freestockcharts.com unless otherwise stated
The charts above are the my LATEST updates independent of the date of this given T2108 post. For my latest T2108 post click here.
Related links:
The T2108 Resource Page
Be careful out there!
Full disclosure: long SDS, long UVXY shares, long AAPL puts, net long the U.S. dollar, long LC calls