
(T2108 measures the percentage of stocks trading above their respective 40-day moving averages [DMAs]. It helps to identify extremes in market sentiment that are likely to reverse. To learn more about it, see my T2108 Resource Page. You can follow real-time T2108 commentary on twitter using the #T2108 hashtag. T2108-related trades and other trades are occasionally posted on twitter using the #120trade hashtag. T2107 measures the percentage of stocks trading above their respective 200DMAs)
T2108 Status: 29.3% (as low as 26.8%)
T2107 Status: 66.2%
VIX Status: 17.9 (17.7% gain, as high as 19.0)
General (Short-term) Trading Call: neutral
Active T2108 periods: Day #145 over 20%, Day #1 under 30% (underperiod ending 50 days over 30%), Day #1 under 40% (ending 1 day over 40%), Day #3 under 50%, Day #3 under 60%, Day #27 under 70%
Commentary

The circus of Fedspeak is finally silenced by the quiet period ahead of next week’s Fed meeting. Yet, the market found new reasons for worry (reportedly a poor oil demand forecast from the IEA caused concerns). Bears and sellers managed to hold the line at resistance at the 50-day moving average (DMA) of the S&P 500 (SPY) in what is now a rare demonstration of follow-through.
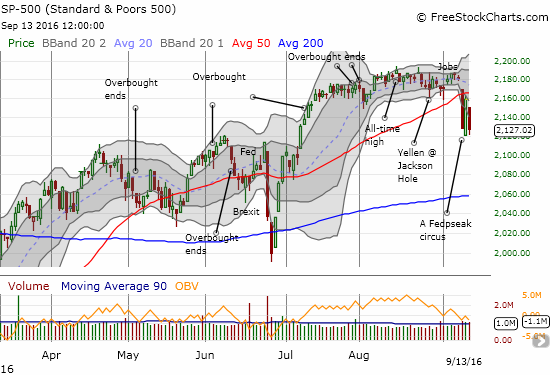
As a result, the volatility index (VIX) managed its first higher close above the 15.35 pivot in two months. The VIX gained 17.7% although it still faded a bit from its high of the day.

T2108, the percentage of stocks trading above their respective 40DMAs, dropped closer to oversold territory (20%). My favorite technical indicator closed at 29.3% and dropped as low as 26.8%. For reference, in the immediate aftermath of Brexit, T2108’s lowest close was at 27.5%, and it traded as low as 24.5%. As a reminder, these levels are often “close enough” to the oversold level of 20%. So sellers have made a convincing case to push the stock market into oversold territory. In preparation, I am giving bullish positions more serious consideration even as I still look to fade rallies. The short-term trading call stays at neutral.
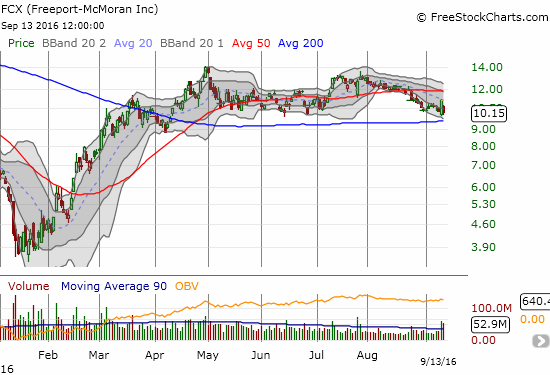
Freeport–McMoran (FCX)
FCX is back to the bottom of its prior trading range. I sold a put option that was a leftover from a hedged play on this trading range. I am on alert to buy FCX calls if the market drops into oversold conditions and/or FCX rallies again on strong volume.
Speaking of commodities, there are some interesting breakdowns underway.
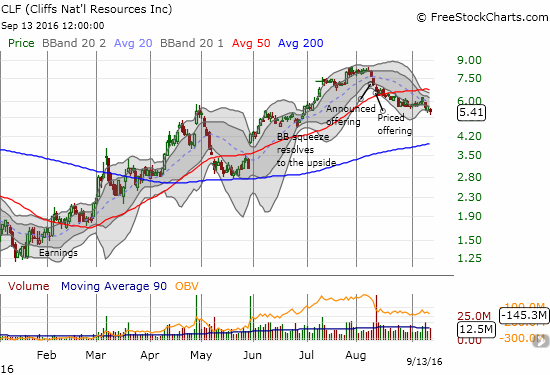
Cliffs Natural Resources (CLF)
Like FCX, CLF last peaked in late July. However, its decline did not start in earnest until a stock offering. I am guessing that CLF sensed things got about as good as they are going to get for a while.
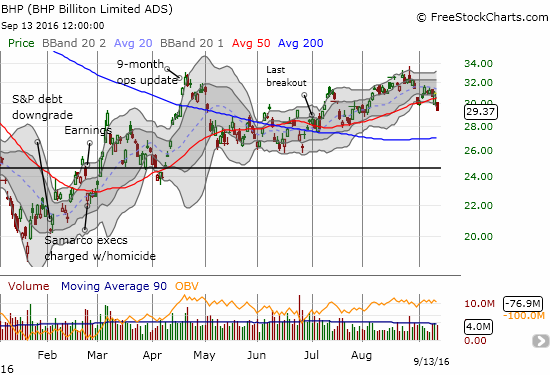
BHP Billiton (BHP)
As I noted in my last T2108 Update, one of the few bearish positions I closed out was a short position on BHP. I did so right after the open and by the close was VERY relieved. Imagine my great surprise when BHP opened trading the next day with a gap right back down to the previous open. Buyers were not interested this time. Suddenly, BHP is suffering from a confirmed 50DMA breakdown. I am duly noting how BHP flipped around its 50DMA throughout much of the summer as I frequently traded through that churn as part of my pairs trading strategy on iron ore.
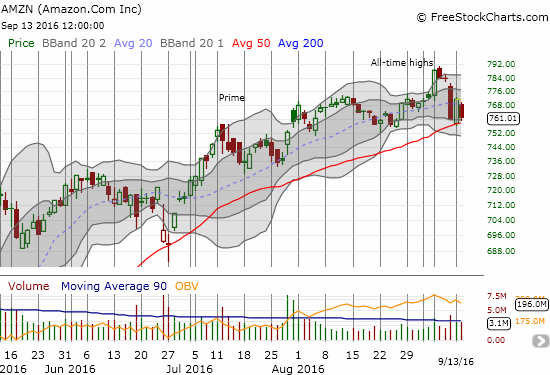
Amazon.com (AMZN)
Suddenly AMZN is struggling to hold support at its 50DMA. Given AMZN’s status as a market darling, a breakdown could further sour sentiment. Similarly, a strong rebound could re-motivate traders and re-ignite tech stocks.
iShares MSCI Emerging Markets (EEM)
After rallying convincingly off 50DMA support to start the week, EEM gapped right back down into a 50DMA breakdown. I went ahead and used this second trip to close out my put options. With expiration on Friday, I am less interested in trying to hold out for further declines. I will be looking for future fade opportunities or go back to my more typical strangle options play (calls and puts).
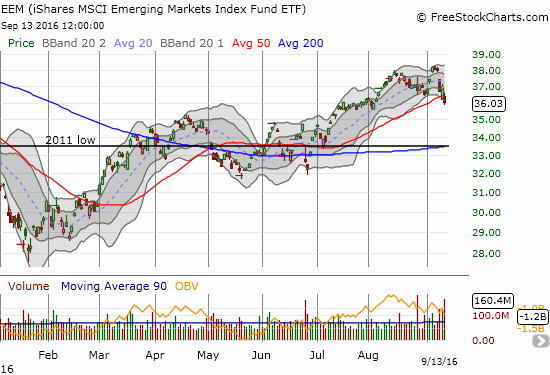
As I rushed to close out my bearish position on EEM, I locked in profits on several other bearish positions. I considered Tuesday’s sell-off as a “second chance” albeit at slightly worse prices given the time decay from Friday to Tuesday. My next question is whether any of my new bullish positions will pay off this week as I anticipate more relief rallies out of these near oversold trading conditions. I added Google (GOOG) call options to that mix.
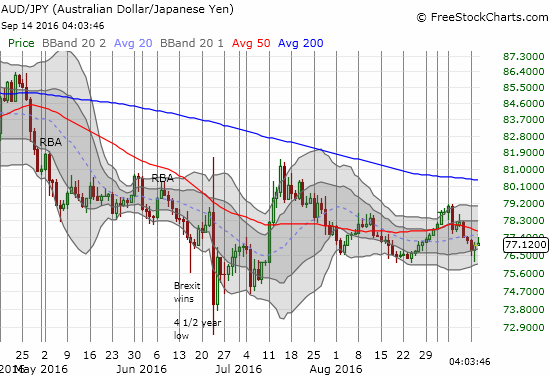
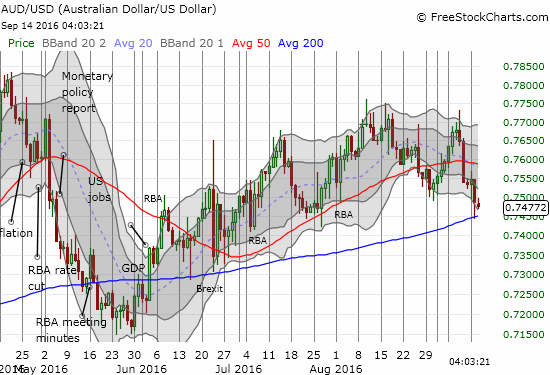
Finally, I have not thrown up a chart of the Australian dollar (FXA) in quite a while. AUD/JPY in particular is holding recent lows. The currency pair specifically diverged from the day’s selling in a potential sign of an imminent return of buyers and a “risk-on” market move. Against the U.S. dollar, the Aussie finally retested 200DMA support. I covered my short AUD/USD and am now watching closely for the resolution of this test.
— – —
Daily T2108 vs the S&P 500
")
Black line: T2108 (measured on the right); Green line: S&P 500 (for comparative purposes)
Red line: T2108 Overbought (70%); Blue line: T2108 Oversold (20%)
Weekly T2108

*All charts created using freestockcharts.com unless otherwise stated
The charts above are the my LATEST updates independent of the date of this given T2108 post. For my latest T2108 post click here.
Related links:
The T2108 Resource Page
Be careful out there!
Full disclosure: long SDS, long SSO call options, long UVXY shares and short call option, long SVXY put and call options, short AUD/JPY