
(T2108 measures the percentage of stocks trading above their respective 40-day moving averages [DMAs]. It helps to identify extremes in market sentiment that are likely to reverse. To learn more about it, see my T2108 Resource Page. You can follow real-time T2108 commentary on twitter using the #T2108 hashtag. T2108-related trades and other trades are occasionally posted on twitter using the #120trade hashtag. T2107 measures the percentage of stocks trading above their respective 200DMAs)
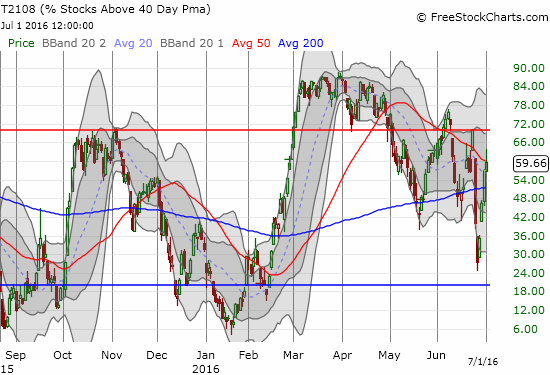
T2108 Status: 59.7%
T2107 Status: 62.5%
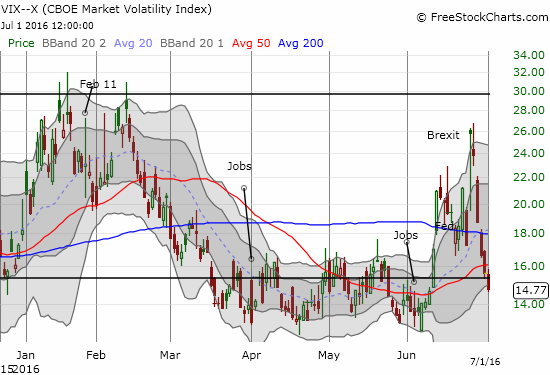
VIX Status: 14.8
General (Short-term) Trading Call: neutral
Active T2108 periods: Day #98 over 20%, Day #4 over 30%, Day #3 over 40%, Day #2 over 50%, Day #6 under 60%, Day #16 under 70%
Commentary
If not for the currency market, we might think nothing important ever happened.
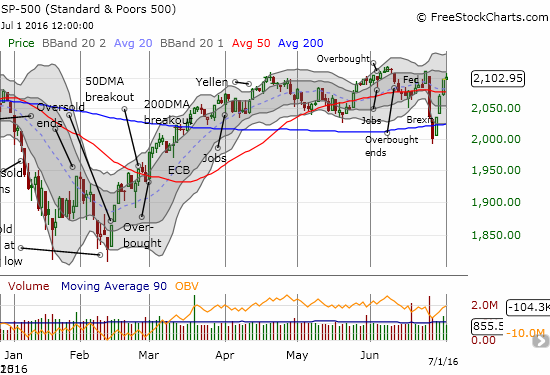
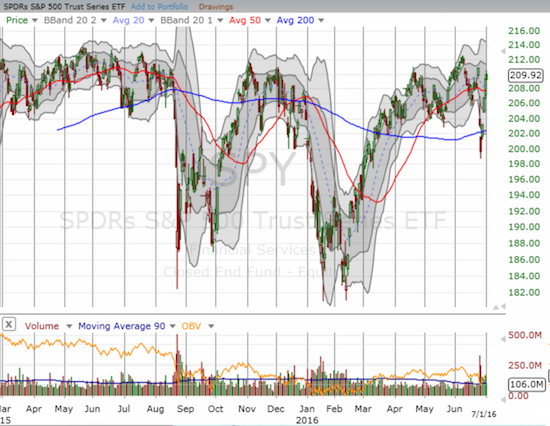
The S&P 500 (SPY) ended June with a 0.3% gain for the month. Embedded within that deceptively placid move was a 2-day 5.3% loss that took T2108, the percentage of stocks trading above their respective 40-day moving averages (DMAs), down to near oversold conditions. It took 4 days for the S&P 500 to reverse that loss (at the high of the day).
A full review of the highlights of this wild Brexit experience is in order.
- June 23 (pre-Brexit): T2108 closed at 69.99%, a hair’s length away from overbought (over 70%).
- June 24 (post-Brexit): The volatility index, the VIX, soared 49%. Going back to 1990, this was the FOURTH LARGEST percentage gain in the VIX. Not even the financial crisis comes close. The largest one-day VIX gain then was 34.5% on September 29, 2008 (ranked #6 but ranked #13 now). The British pound (FXB) hit a 30-year low against the U.S. dollar.
- June 27: The VIX dropped despite a second day of selling on the S&P 500. T2108 closed at 27.5%, approaching oversold territory (below 20%). The S&P 500 closed at 2000.54 and broke below 200DMA support. The index also closed well below its lower-Bollinger Band (BB). The British pound hit a 31-year low against the U.S. dollar.
- June 28: The FTSE 100, a collection of the 100 largest companies in the UK by market cap, completely reversed its post-Brexit loss. The S&P 500 reversed the previous day’s loss and closed above its 200DMA resistance.
- June 29: The S&P 500 surged again and closed just below 50DMA resistance.
- June 30: The S&P 500 closed above 50DMA resistance. The FTSE 100 closed at a new 11-month high. Bank of England governor Mark Carney indicated that the UK’s central bank will have to provide additional monetary easing sometime this summer.
- July 1: At its high of the day, the S&P 500 finished its reversal of post-Brexit losses. The index faded from there and lost about half of its small gain on the day.
Now, for each of these steps, I review what I did versus what I think I should have done with the benefit of some hindsight. Some of the mathematics almost seem too simple, easy, and obvious in retrospect…
- June 23 (pre-Brexit): I made perhaps my most fortuitous trades in many years. I loaded up on shorts and puts ahead of Brexit given my existing bearishness and my disbelief at the market’s celebration in the face of what looked like a very uncertain situation filled with potential peril.
- June 24 (post-Brexit): I immediately closed out a large number of my bearish positions. These trades followed my informal rules. In all cases, positions soared in value, and I wanted to lock in profits before gap buyers went to work. Sure enough, the gap was bought after the first 15 minutes or so of selling. However, the buying lasted only about 30 minutes before sellers took over again. In retrospect, I see I then moved too quickly into some long hedges: T2108 had not even cracked the May, 2016 low. The S&P 500 had not quite reached its 200DMA. These long positions motivated me to hold my remaining bearish positions longer than I should have. In other words, I unnecessarily turned a simple trading situation into a more complex one. I should have entirely focused on managing the bearish positions and figuring out exit strategies in case of a rebound. Strangely enough, it idid not occur to me at the time to check the historical record on VIX 1-day percentage gains. If I had recognized the historical extreme, I probably would have closed a lot more bearish positions and would have been more prepared to get bullish the following week.
- June 27: The VIX’s contrary move on the day was just about the loudest buying signal I have seen in a VERY long time. The buying signal was even louder with the S&P 500 closing at the magic number 2000 AND trading well below the lower-BB which in itself is its own form of an over-extended move. Yet, I did not fully absorb the significance of the combination of these signals because T2108 was not quite oversold. Fortunately, I acknowledged “quasi-oversold” conditions and expected a rebound the next day. Unfortunately, I primed myself for fading the subsequent rally instead of closing out all my bearish positions or even buying aggressively upon confirmation of a bounce. I even rationalized shorting AMZN with a plan to hedge if the stock succeeded in bouncing off 50DMA support. In retrospect, I should have exercised patience and left the stock alone. I would have then been mentally prepared to BUY once support was confirmed the next day.
- June 28: The expected rally came, but it was MUCH stronger than I anticipated. I licked my chops as limit orders triggered for fresh bearish positions (since I expected the bounce, I entered all my new positions at “discounts”). In retrospect, the S&P 500’s ability to punch right through 200DMA resistance should have confirmed for me a change in market sentiment. Instead, I looked ahead to adding to bearish positions upon a retest of 50DMA resistance. Moreover, the VIX sunk below 20, the level conventionally considered a marker for “elevated fear.” In other words, the market’s return to complacency was well underway, but I decided to continue standing still in the face of the new momentum.
- June 29: The test of 50DMA resistance came in a flash. I eagerly doubled down on bearishness not expecting this resistance to give way…or at least not anytime soon. I happened to choose hedges that were well under-performing the market’s rally. I allowed this divergence to convince me that the market’s rally would end in short order. In retrospect, I should have exercised patience and waited for confirmation of 50DMA resistance.
- June 30: I finally woke from my “slumber” when the S&P 500 very quickly punched right through 50DMA resistance. I slowed down my pace of accumulation of bearish positions and implemented more hedged trades. I unloaded some longs including earlier hedges that FINALLY became profitable trades. My trading bias went from bearish to neutral.
- July 1: Still taken aback by the sharpness of the post-Brexit rebound, I could not help adding to one more bearish position. I took profits on a LOT of long positions, including all my remaining post-Brexit hedges. A fourth rally day in a row “felt” like the equivalent of overbought, and T2108 was trading in the low 60s. Assuming my initial rationale for bearishness still applied – the descent from overbought conditions on June 10, 2016 and the failure at “overbought resistance” on June 23rd – caution seemed quite appropriate. There is no retrospective here yet, but at least my moves on this day all made sense based on the existing trading signals and my rules. The S&P 500’s fade from the highs – the first real sign of sellers in 4 days – seemed to validate my trades.
I went through this detail to examine my thinking and identify areas of improvement. The most glaring mistake I see is the lack of flexibility (feel free to add more in the comments!). I was both too slow and too fast. I maintained well-defined milestones, but I did not wait for confirmation of the meaning of those milestones. In my haste, I was then too slow to reconsider my positioning when the signals were begging me to do so. With epic and historic market moves underway, I should have been more prepared to shift with the market’s changing tides. I am taking that lesson to heart going forward. (Ironically enough, I performed much better in my forex trading through this period by staying alert and flexible at all times).
So, now where does the market stand? T2108 closed at 59.6% after trading as high as 63.8%. T2108 got “close enough” to overbought conditions for me to think just as I did on June 23rd, the pre-Brexit day. The peaks on the S&P 500 from June 8th and June 23rd form lower highs. If the index falls back from here, a bearish bias will make sense…especially if 50DMA support gives way again. A bullish bias makes sense if the market can manage to push T2018 back into overbought territory. In between, I will not make any more bearish moves outside of very specific cases. The same is even more true for bullish positions.
The S&P 500 has now made several attempts at new all-time highs since it last scored one in May, 2015. Depending on how you count, the index has registered 5 to 7 failures to generate a rally strong enough to break into new all-time high territory. In between these failures are some steep and dramatic sell-offs. The worst sell-offs created oversold trading conditions. After initial bounces from the depths of oversold trading conditions, follow-through selling occurred before the market carved out a sustainable bottom.
This action begs a BIG question: who is getting exhausted from these wild gyrations, sellers or buyers? If these moves are shaking out weak hands and sellers, then a break to new all-time highs SHOULD lead to a tremendous surge (a classic extended overbought rally). If instead buyers are getting exhausted from picking the market back up over and over, then breaks of key lows SHOULD lead to rapid follow-through selling, particularly outside of oversold conditions. The Brexit swing from euphoria to panic and back to relief is an abbreviated microcosm of the index’s larger wild behavior. The sharp moves carved out a definitive trading range outside of which should lie the next big moves – lots of chop to come in between.
There are a LOT of charts I could show to emphasize some important points, but I will focus on three for now.
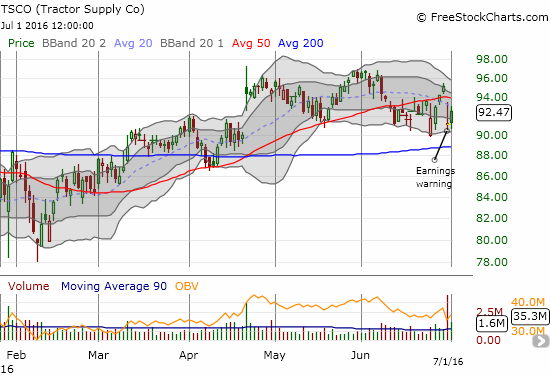
Tractor Supply Company (TSCO) issued an earnings warning on Thursday. The stock barely budged on Brexit and was well on its way to challenging recent highs before the warning. TSCO gapped down about 5%. Buyers stepped in and almost filled the gap before the stock closed near its open. Buyers went right back to work the next day on strong volume. I consider TSCO a single-stock case of the range trade. If TSCO overcomes the post-warning loss, the stock should rally away. A break of the post-warning low, even with 200DMA support nearby, should mean look-out below…
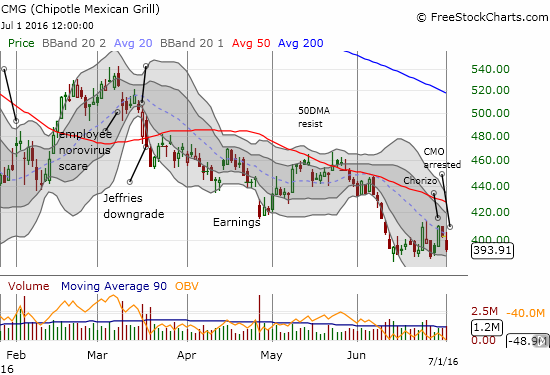
I described my new trading strategy for Chipotle Mexican Grill (CMG) in the last T2108 Update. CMG continues to provide good trading volatility. I ended the week with shares and put options while flipping in and out of other puts and calls. I see CMG in great danger of breaking through the recent lows given its inability to sustain two big buying surges. The arrest of CMG’s Chief Marketing Office on drug charges should be unrelated to the core business, but it will likely hurt confidence in the company nevertheless. It makes little sense to invest in CMG here until it can regain buying momentum – like first closing above the current post-sell-off trading range.
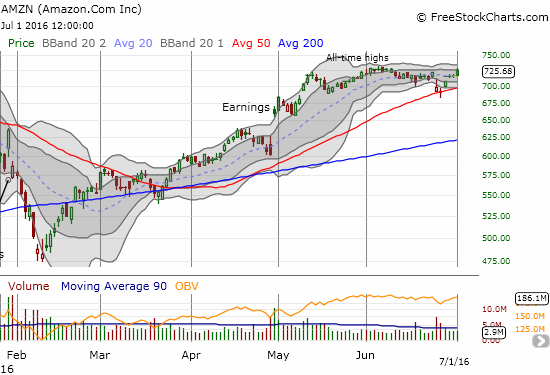
As I mentioned above, Amazon.com (AMZN) was one of my mistakes in getting too aggressive with follow-on bearish positions. On Tuesday, June 28th, AMZN made a picture-perfect bounce from 50DMA support. The test even ended with a classic doji that signals a likely change in market direction and sentiment; buyers and sellers battled to a stalemate. I was successful in hedging that day with a quick flip but had to wait until FRIDAY to log profits on a second hedge that week. AMZN’s rally did not closely follow the general market, but it is now within striking distance of setting a very bullish tone with a new all-time high…a milestone I thought was NOT in the cards.
— – —
Reference Charts (click for view of last 6 months from Stockcharts.com):
S&P 500 or SPY
U.S. Dollar Index (U.S. dollar)
EEM (iShares MSCI Emerging Markets)
VIX (volatility index)
VXX (iPath S&P 500 VIX Short-Term Futures ETN)
EWG (iShares MSCI Germany Index Fund)
CAT (Caterpillar).
IBB (iShares Nasdaq Biotechnology).
Daily T2108 vs the S&P 500
")
Black line: T2108 (measured on the right); Green line: S&P 500 (for comparative purposes)
Red line: T2108 Overbought (70%); Blue line: T2108 Oversold (20%)
Weekly T2108

*All charts created using freestockcharts.com unless otherwise stated
The charts above are the my LATEST updates independent of the date of this given T2108 post. For my latest T2108 post click here.
Related links:
The T2108 Resource Page
Be careful out there!
Full disclosure: long UVXY shares, long put options on SSO, short AMZN, long CMG shares and put options
Pretty much did the same. One account up 75% another 50% after watching a woman walk though a flooded street to vote.
People don’t do that when they are satisfied
Nice “on the ground” trading! That’s priceless intel….