
(T2108 measures the percentage of stocks trading above their respective 40-day moving averages [DMAs]. It helps to identify extremes in market sentiment that are likely to reverse. To learn more about it, see my T2108 Resource Page. You can follow real-time T2108 commentary on twitter using the #T2108 hashtag. T2108-related trades and other trades are occasionally posted on twitter using the #120trade hashtag. T2107 measures the percentage of stocks trading above their respective 200DMAs)
T2108 Status: 53.0%
T2107 Status: 54.1%
VIX Status: 12.4
General (Short-term) Trading Call: Neutral.
Active T2108 periods: Day #144 over 20%, Day #103 above 30%, Day #47 above 40%, Day #2 over 50% (overperiod), Day #13 under 60%, Day #213 under 70%
Reference Charts (click for view of last 6 months from Stockcharts.com):
S&P 500 or SPY
SDS (ProShares UltraShort S&P500)
U.S. Dollar Index (volatility index)
EEM (iShares MSCI Emerging Markets)
VIX (volatility index)
VXX (iPath S&P 500 VIX Short-Term Futures ETN)
EWG (iShares MSCI Germany Index Fund)
CAT (Caterpillar).
Commentary
The S&P 500 (SPY) printed another all-time high on Friday, May 15th. The index is up 0.3% from a week ago when I wrote the last T2108 Update noting how those Friday gains represented half of 2015’s entire year-to-date gain. Such is the nature of the chop of the market that goes nowhere yet manages the smallest slivers of miniscule progress.
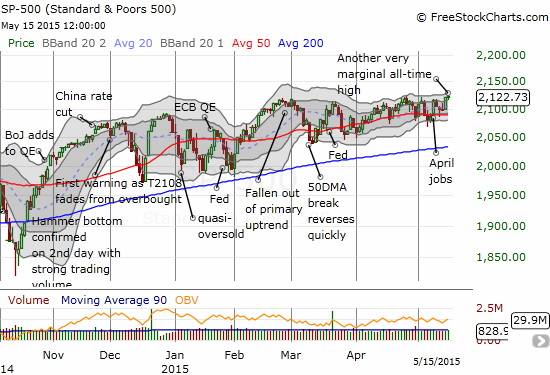
The S&P 500 is making so such slow progress upward along its 50-day moving average (DMA) that I describe this as a chopping range. The move is not technically a trading range since new highs are being made along the way. All the chop makes it feel like nothing is really happening. The index is also looking like a coiled spring given it is spending a lot more time above its 50DMA than below.
T2108 is chopping even more than the S&P 500. It closed at 53.0% – smack in the middle of a very firm range for 2015. This lag means, technically, the S&P 500 has a lot more upside potential before a notable pullback. My trading call stays in neutral though. Instead of betting on market direction, I am betting on an increase in volatility.
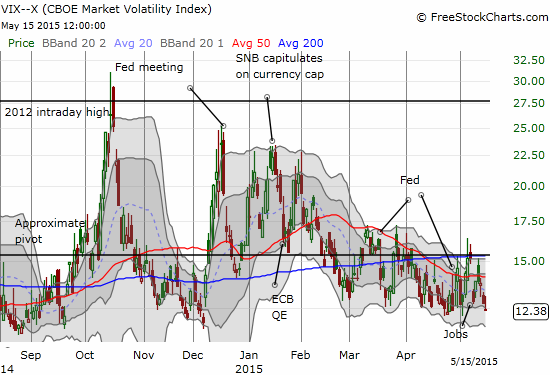
Volatility has held onto its lows despite this chopping range. The VIX is now back to levels that have preceded brief pops higher.
In the last T2108 Update, I noted I would bet on volatility once the S&P 500 made a new marginal high. The market’s chopping behavior did not disappoint. So, on Friday I loaded up on ProShares Ultra VIX Short-Term Futures (UVXY) call options. I only purchased half the position I wanted as I was looking for rock-bottom prices. Why be so cheap? Well, a bet on UVXY is a bet against a very strong trend…
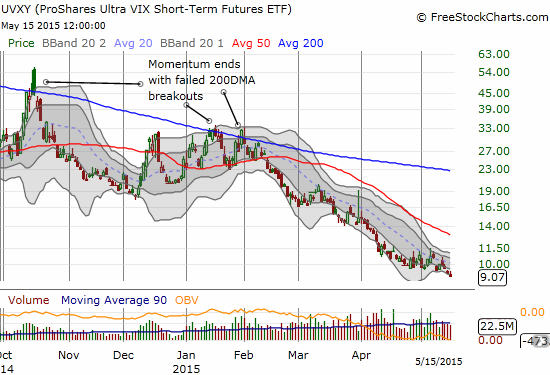
…so betting on UVXY is a particularly tricky form of market-timing. In my favor is UVXY’s tendency to end a decline with a tap on its lower-Bollinger Band (BB).
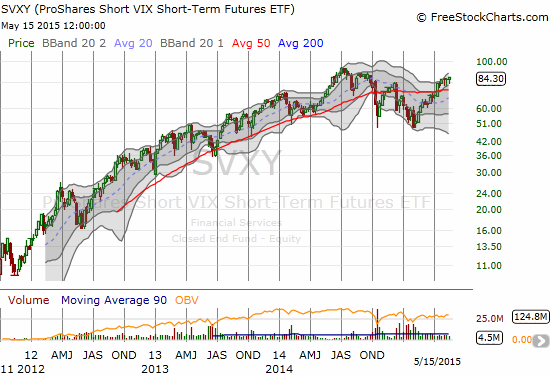
Speaking of volatility bets, the REAL bet on volatility has been to bet against it. ProShares Short VIX Short-Term Futures (SVXY) has been an amazingly winning bet which has far surpassed market returns even with the stumbling since late last year.
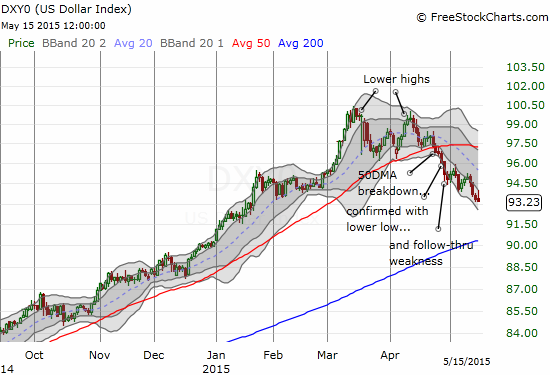
Some market observers have expressed concern that a strengthening U.S. dollar (UUP) would kill corporate profits and the stock market. Now they can worry that the dollar’s decline signals a lowering confidence in the U.S. economy. I pointed out the dollar’s “trend troubles” in late April. The dollar’s primary uptrend is now officially over and an outright DOWNtrend from the recent highs is fully underway.
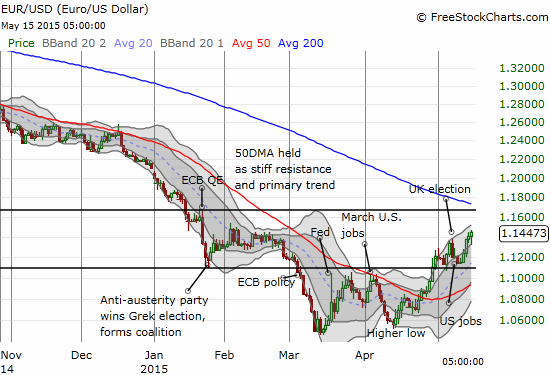
Market observers should duly note that the S&P 500 has not skyrocketed higher upon the dollar’s weakness. Perhaps it is because much of the dollar’s decline has come from a shift in sentiment toward the euro (FXE). EUR/USD has returned to the QE/Greek election trading band and is trading in-line with the post-election high. I am currently betting on at least a return to the bottom of this band. I am also expecting the top of the band to hold as resistance.
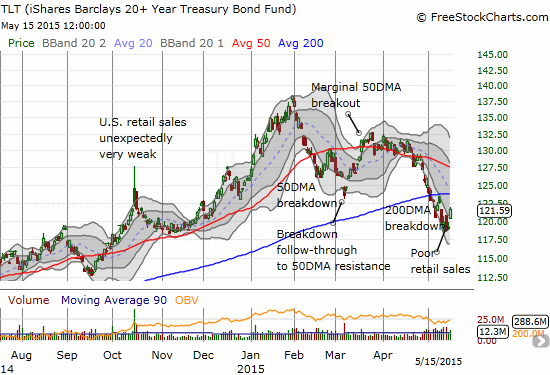
The U. S. dollar is not benefiting from a rise in rates. Surprisingly, the stock market seems not to care about these developments either. The sell-off in bonds is causing a lot of hand-wringing in fixed income circles, but not in equity circles. The 200DMA breakdown for the iShares 20+ Year Treasury Bond (TLT) continues, but TLT is not giving up easily. I am still expecting a rebound to at least the 50DMA – I guess I have just been burned too many times thinking that the rally in bonds has finally ended.
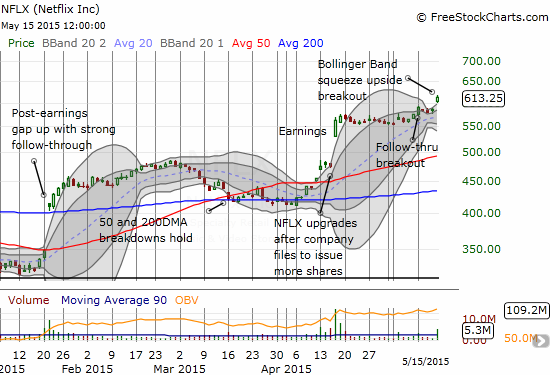
The big trade of the week goes to Netflix (NFLX). As regular readers know, I have been following NFLX closely from a technical standpoint. On Friday, the stock made a major breakout that resolved a Bollinger Band (BB) squeeze to the upside. I only caught this trade by following the stock closely. I sold my call options right at the open. The stock quickly retreated to $600 from there but rewarded new entrants handsomely with a run-up to as high as $615 before the close. NFLX is now up an incredible 80% year-to-date.
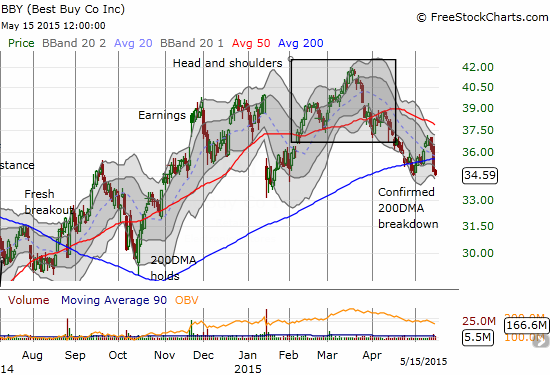
Best Buy (BBY) is moving opposite NFLX. This week, BBY broke down below its 200DMA for the second time in three weeks. This seems to confirm the head and shoulders top shown in the chart below. Earnings are coming up this week. Will they serve as the nail in the coffin? Prospects certainly seem poor with U.S. retail sales disappointing yet again.
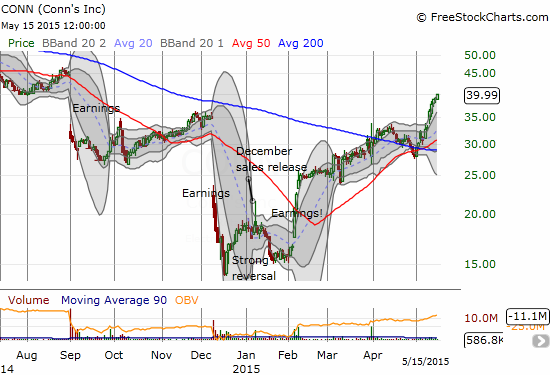
Or maybe money is leaving Best Buy and going to Conns Inc. (CONN)!?!
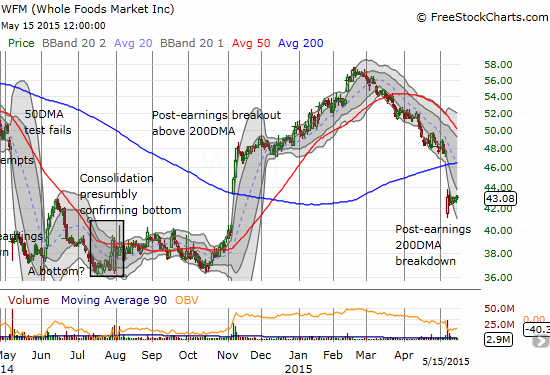
Whole Foods Market is also breaking down. November’s 200DMA breakout is essentially over with WFM’s 200DMA breakdown last week. WFM is now a stock to fade on rallies although astute bears could easily have shorted WFM after it broke down below its 50DMA support in March. Note the orderly decline since then.
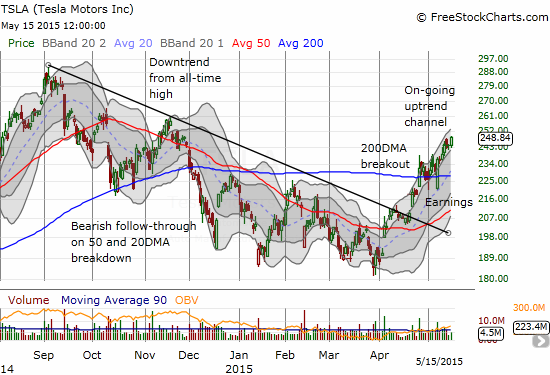
Tesla Motors (TSLA) is throwing bears for a loop all over again.
Coming up on RealMoneyPro -
A Review of Tesla's "CRAP" Earnings
(CRAP – -completely ridiculous accounting principles)
— Douglas Kass (@DougKass) May 8, 2015
TSLA dropped in response to earnings but has not looked back since. TSLA is now up 37% since the late March low. The current uptrend looks strong enough to take the stock back to all-time highs. I do not think I am brave enough to place such a bet though.
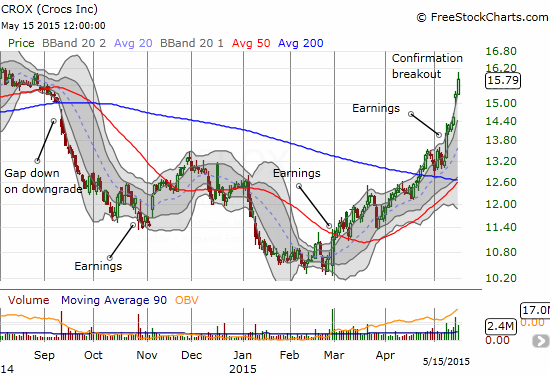
Crocs (CROX) is making a great follow-through to a bullish post-earnings setup I pointed out last week. Unlike NFLX, I was not following closely enough to take the entry when CROX notched a new high on this run-up. In fact, with hindsight, I am seeing I should have bought a half position at THAT time and looked for the entry to complete the tranche. Another lesson learned.
Daily T2108 vs the S&P 500
")
Black line: T2108 (measured on the right); Green line: S&P 500 (for comparative purposes)
Red line: T2108 Overbought (70%); Blue line: T2108 Oversold (20%)
Weekly T2108

*All charts created using freestockcharts.com unless otherwise stated
The T2108 Resource Page
Expanded daily chart of T2108 versus the S&P 500
Expanded weekly chart of T2108
Be careful out there!
Full disclosure: long UVXY call options, short EUR/USD, long TLT call spread