
(T2108 measures the percentage of stocks trading above their respective 40-day moving averages [DMAs]. It helps to identify extremes in market sentiment that are likely to reverse. To learn more about it, see my T2108 Resource Page. You can follow real-time T2108 commentary on twitter using the #T2108 hashtag. T2108-related trades and other trades are sometimes posted on twitter using the #120trade hashtag. T2107 measures the percentage of stocks trading above their respective 200DMAs)
T2108 Status: 40.4% (ended quasi-oversold period with a gain against a predicted 71% odds of a decline)
T2107 Status: 45.4%
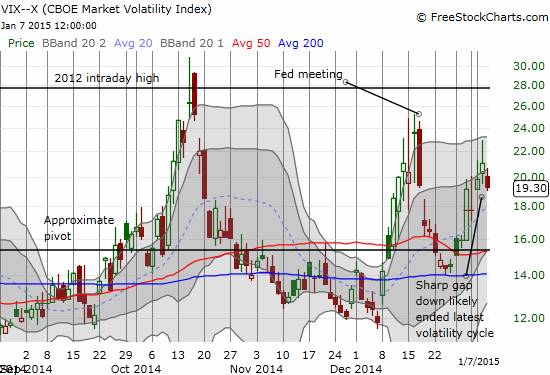
VIX Status: 19.3 (gapped down and lost 8.6%)
General (Short-term) Trading Call: Hold – see caveats below
Active T2108 periods: Day #55 over 20%, Day #14 above 30%, Day #1 above 40% (overperiod), Day #5 under 50%, Day #23 under 60%, Day #125 under 70%
Reference Charts (click for view of last 6 months from Stockcharts.com):
S&P 500 or SPY
SDS (ProShares UltraShort S&P500)
U.S. Dollar Index (volatility index)
EEM (iShares MSCI Emerging Markets)
VIX (volatility index)
VXX (iPath S&P 500 VIX Short-Term Futures ETN)
EWG (iShares MSCI Germany Index Fund)
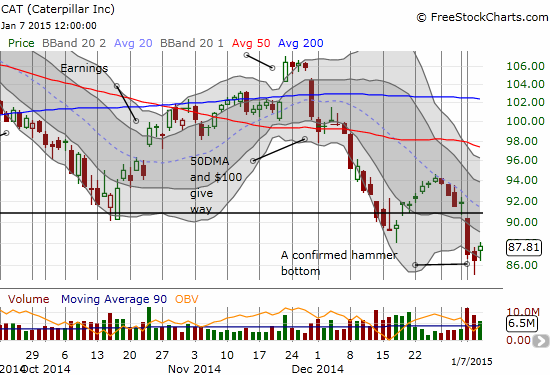
CAT (Caterpillar).
Commentary
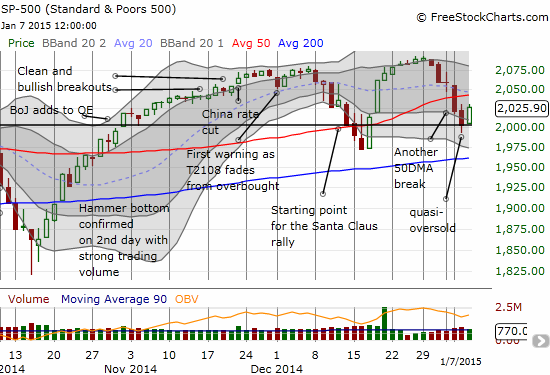
Just as I was bracing for more losses, the stock market of course threw a surprise. The S&P 500 gapped up and gained 1.2% to reverse all of the previous day’s losses while bouncing off “support” from the start of the Santa Claus rally. T2108 surged over the 40% threshold. Perhaps most importantly, the volatility index, the VIX, gapped down for a 8.6% loss. Suddenly, I now have to consider that a bottoming process from the latest pullback may already be underway.
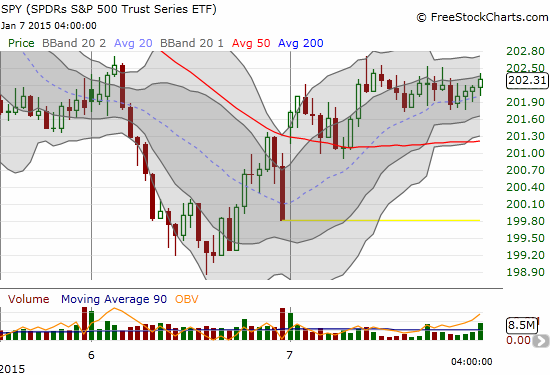
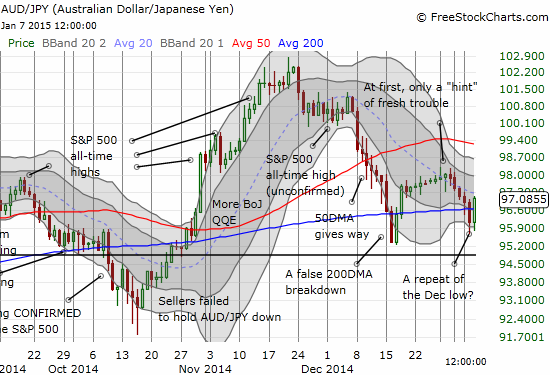
Before I continue, I need to point out something I completely missed from the previous day’s close. I showed how the S&P 500 was rebounding nicely off its lows in tight concert with my favorite indicator from the currency market, the Australian dollar (FXA) versus the Japanese yen (JPY), or AUD/JPY. However, I completely missed the strange nature of the close in the final minutes. As usual, I have to use SPY to make it plain as the open and close on the S&P 500 do not do the trading action any justice.
In the 15-minute chart below, SPY started a sudden reversal at 3:30pm Eastern. Volume surged as it often (usually?) does in the final 15 minutes. I include today’s trading for comparison. Note how the gap up in SPY started trading as if the previous 30 minutes never happened. It was if someone (or some people) were forced out (washed out) into the close. If I had noticed the potential purge, I would have been a little more hopeful for a positive day of trading despite the T2108 Trading Model’s prediction for a down day.
The strongest case for a bottoming comes from AUD/JPY. Note that just like the December low, AUD/JPY broke down below the 200DMA and jumped right back over it the following day.
My favorite stock indicator Caterpillar, Inc. (CAT) is even winking at a bottom. The stock printed a hammer pattern the previous day and confirmed the bottoming pattern opening higher (ever so slightly) and finishing with a gain on high volume. This puts in play at least a fill of Monday’s calamitous gap down and plunge.
Finally, it is interesting to note how the S&P 500 is still “loitering” around the levels it traded when the Bank of Japan pumped up its program of quantitative easing and soon thereafter China cut rates. And now the support line from the Santa Claus rally may even prove important for trading in the near-term.
Since I am expecting an extended period of chop, I am not getting overly excited. Note that the S&P 500 must now contend all over again with overhead resistance at the 50DMA. Bulls have a very clear stop below January’s low. Bears need to look out for yet another downside fake-out.
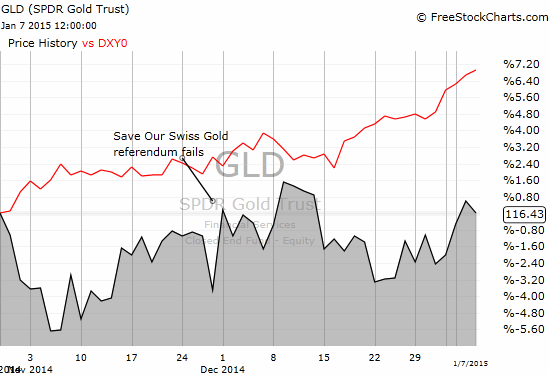
Speaking of bottoms, I have become VERY intrigued by gold’s ability to consolidate in the last two months even as the U.S. dollar index has soared about 7%. I am definitely NOT going to call a bottom in gold, but it is definitely tradeable to the long side here (with stops in place adjusted to risk tolerance of course). If SPDR Gold Trust (GLD) manages to breakout from its 200DMA (another 4% higher), I might even have to turn full out bullish (for the short-term).
Daily T2108 vs the S&P 500
")
Black line: T2108 (measured on the right); Green line: S&P 500 (for comparative purposes)
Red line: T2108 Overbought (70%); Blue line: T2108 Oversold (20%)
Weekly T2108

*All charts created using freestockcharts.com unless otherwise stated
The T2108 Resource Page
Expanded daily chart of T2108 versus the S&P 500
Expanded weekly chart of T2108
Be careful out there!
Full disclosure: long GLD, net short Australian dollar and Japanese yen, net long U.S. dollar, long SVXY, long UVXY put options