
(T2108 measures the percentage of stocks trading above their respective 40-day moving averages [DMAs]. It helps to identify extremes in market sentiment that are likely to reverse. To learn more about it, see my T2108 Resource Page. You can follow real-time T2108 commentary on twitter using the #T2108 hashtag. T2108-related trades and other trades are sometimes posted on twitter using the #120trade hashtag. T2107 measures the percentage of stocks trading above their respective 200DMAs)
T2108 Status: 34.0% (quasi-oversold)
T2107 Status: 44.0%
VIX Status: 21.1 (up 6.0% but second day fading well off high of the day)
General (Short-term) Trading Call: Hold.
Active T2108 periods: Day #54 over 20%, Day #13 above 30% (overperiod), Day #2 under 40%, Day #4 under 50%, Day #22 under 60%, Day #124 under 70%
Reference Charts (click for view of last 6 months from Stockcharts.com):
S&P 500 or SPY
SDS (ProShares UltraShort S&P500)
U.S. Dollar Index (volatility index)
EEM (iShares MSCI Emerging Markets)
VIX (volatility index)
VXX (iPath S&P 500 VIX Short-Term Futures ETN)
EWG (iShares MSCI Germany Index Fund)
CAT (Caterpillar).
Commentary
This T2108 Update is essentially a quick follow-up to the previous day’s T2108 Update. Nothing has changed with my overall assessment of the technical health of the market.
It was another day of selling for the S&P 500 (SPY) with the day ending with the exact loss needed to neatly erase last month’s Santa Claus rally. Yet again, you just cannot make this stuff up.
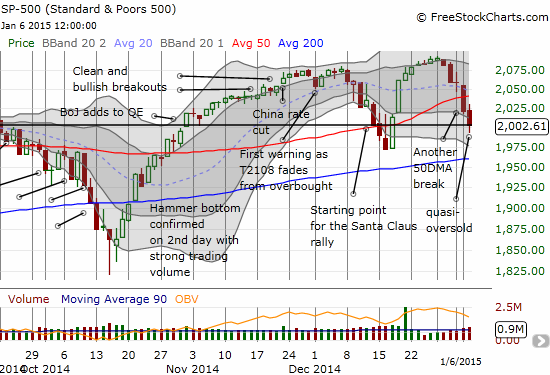
The day’s selling drove T2108 ever closer to oversold trading conditions. The 2-day 33% loss for T2108 qualifies it for quasi-oversold trading conditions. My hope in these cases is that the T2108 Trading Model (TTM) will come up with a strong projection for a bounce. Unfortunately, this time around, the TTM generated a strong projection (71% chance) of a LOSS for tomorrow’s (January 7th) trading on the S&P 500. The classification error is a decent 39% and the historical error is about 25%. (Fore more details on this model and important news of the major update I made recently, see “Preparing for A New Year: Expect Prices to Fluctuate“).
While all this drama effectively kicked off with a historic surge in volatility to end 2014, the VIX has had a hard time increasing in the subsequent days of selling. The S&P 500 lost about 1% when volatility surged 21%. The last two days of selling have featured losses on the S&P 500 of 1.8% and 0.9% while the VIX has “only” increased 12.0% and 6.0%, respectively. Moreover, the VIX has faded well off its highs for the day each time.
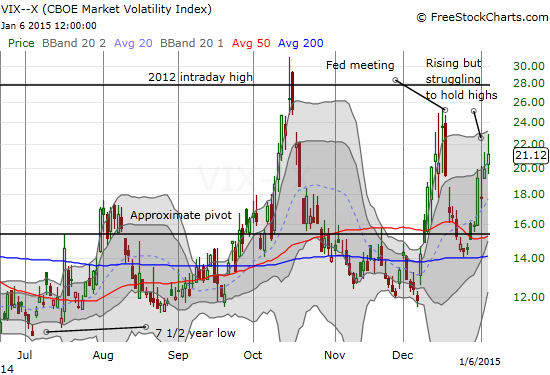
I am not really sure what to make of these contrasts except to say that I think fading volatility will be the ultimate winner here. In the last T2108 Update, I neglected to acknowledge that the approach of earnings season is likely going to keep volatility elevated for a while. So it does not make sense to get aggressive with fades until I see how the market starts reacting to earnings. I am putting on hold any further buys of put options on ProShares Ultra VIX Short-Term Futures (UVXY) and will scale into ProShares Short VIX Short-Term Futures (SVXY) at a slower pace for now. I did add a small amount of shares today simply based on the VIX tagging its upper-Bolling Band at one point and getting “close enough” to the highs of the last peak. Clearly, if the selling continues from here, the VIX could break through this resistance as the S&P 500 breaks down closer to its support at the 200DMA.
January will be a month for staying even more nimble than usual.
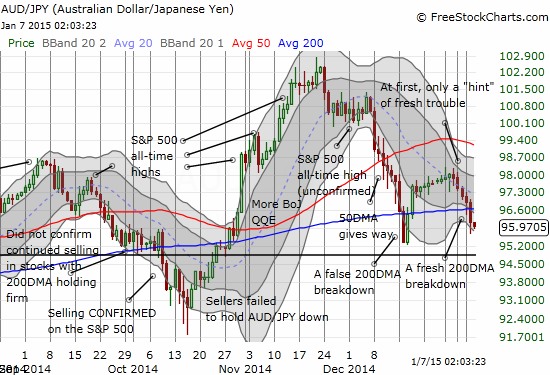
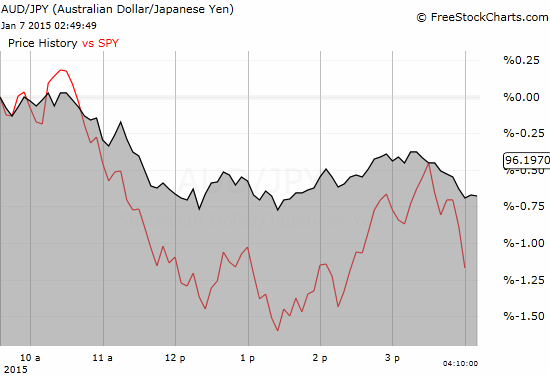
I conclude with this chart of the Australian dollar (FXA) versus the Japanese yen (JPY). I forgot to include it in the last T2108 Update as further emphasis of the growing bearishness. Note that AUD/JPY decisively sliced through its 200DMA and has put the December low into play. This currency pair will be key to watch. For emphasis, I include an intraday comparison between the AUD/JPY and SPY. Note how neatly the two bounced together when buyers made a late attempt to put a good face on the close.
Daily T2108 vs the S&P 500
")
Black line: T2108 (measured on the right); Green line: S&P 500 (for comparative purposes)
Red line: T2108 Overbought (70%); Blue line: T2108 Oversold (20%)
Weekly T2108

*All charts created using freestockcharts.com unless otherwise stated
The T2108 Resource Page
Expanded daily chart of T2108 versus the S&P 500
Expanded weekly chart of T2108
Be careful out there!
Full disclosure: long UVXY puts, long SVXY, short the Australian dollar and net short the Japanese yen
Dr.,
I strongly agree with your conclusion to stay nimble.I have been short
the EURO and will stay in it till the next meeting of the ECB january 22.
The charts back up your assertion to stay nimble,and while I would like to be longer in SVXY than I am. I will keep my positions on the light side.
Rocket Ray
Good job staying short the euro! And thanks for reading.
One addendum sitting here shortly after the market gapped up to open…I am realizing that there was an odd blip in the market into the close. Something strange must have happened because this gap up makes it look like that drawdown never happened into the close. I will have to post a chart on this point for the next update.