
AT40 = 37.1% of stocks are trading above their respective 40-day moving averages (DMAs)
AT200 = 46.7% of stocks are trading above their respective 200DMAs
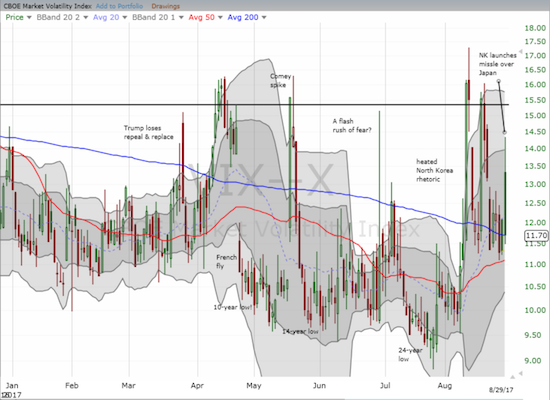
VIX = 11.7 (was as high as 14.3)
Short-term Trading Call: neutral
Commentary
North Korea launched a ballistic missile over northern Japan, bot no fire and fury ensued. What happened instead was more like volatility and fizzle.
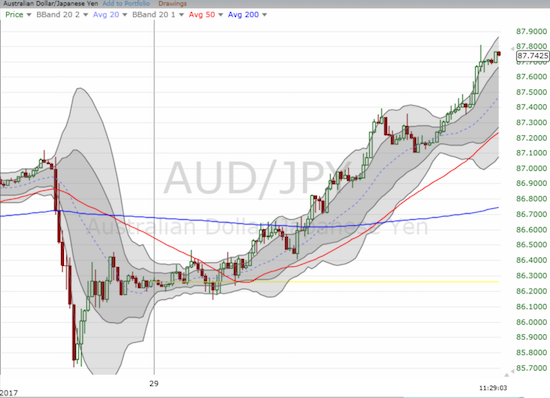
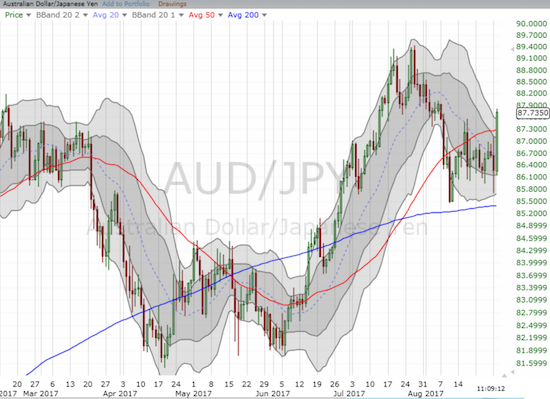
The key tell going into U.S. trading was in the currency market. The Japanese yen (FXY) surged on the North Korea news but weakened throughout Asian and then European trading. For example, AUD/JPY plunged for about 75 minutes and then reversed from there. Indeed, the subsequent reversal and rally was so strong, AUD/JPY tested resistance at its 50-day moving average (DMA) by the close of U.S. trading and burst through after that. This breakout is bullish, but I decided to use AUD/JPY as a hedge by starting a fresh short position.
The yen’s weakness was so pronounced by the time the U.S. opened for trading, I was surprised volatility gapped so high and the stock market gapped as low as it did. The sharp move distracted me from making the “right” trade which was to fade volatility. Instead, I let my long volatility positions that I hold as on-going every-two-weeks hedges fade on the vine.
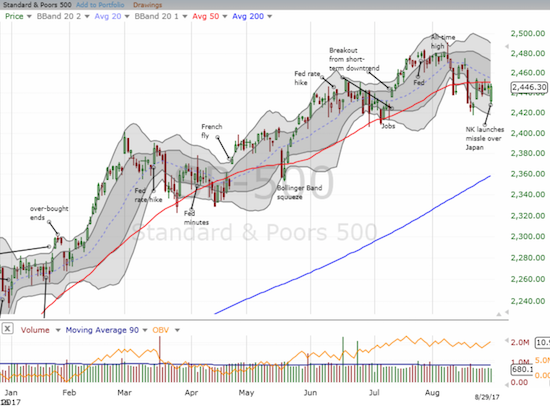
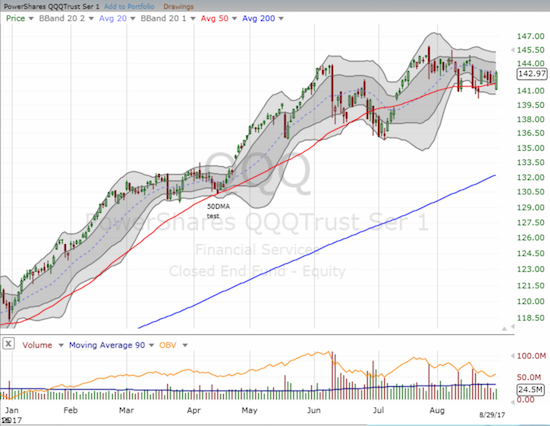
The S&P 500 rallied back to a flat close. The NASDAQ was able to close above its 50DMA and a 10-day high. The PowerShares QQQ Trust (QQQ) rebounded well above its 50DMA yet stopped cold at its declining 20DMA.
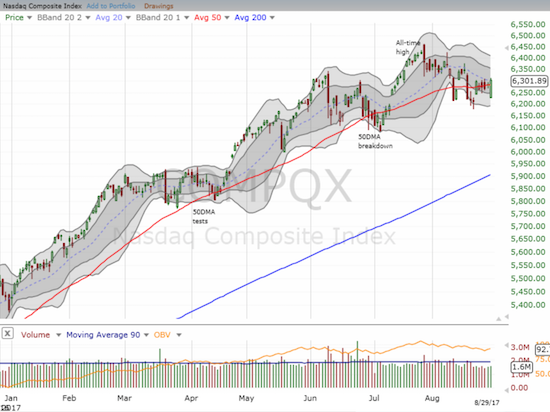
With motivated sellers freshly shaken out of the market, the major indices could post one of those robust reactionary rallies. Yet, AT40 (T2108), the percentage of stocks trading above their respective 40DMAs, is not quite ready to provide a pass. AT40 closed a full point behind Monday’s close which itself represented an end to the preceding 5 days of upward momentum. It is very possible the market will spend the rest of the week in a stalemate as it awaits the storied return of traders after the Labor Day weekend.
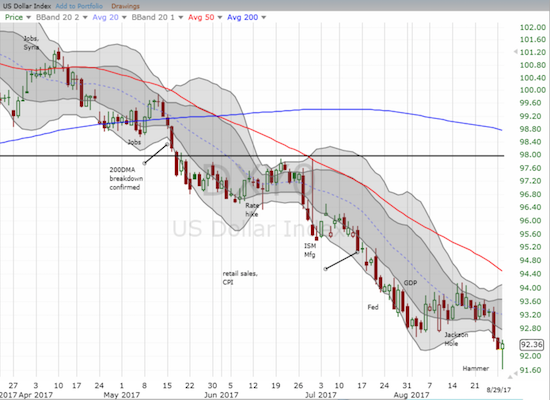
While little changed with the major indices, a change MAY have finally occurred with the U.S. dollar index (DXY0). The dollar sold off at the open as EUR/USD almost (incredibly!) reached the 1.21 level. This plunge was enough to finally bring the dollar buyers back into play as they rallied the index into a hammer close. Given the dollar index traded further below its lower-Bollinger Band (BB) than it has done throughout this entire downtrend, I strongly suspect that the dollar can finally pull off a sustained relief rally.
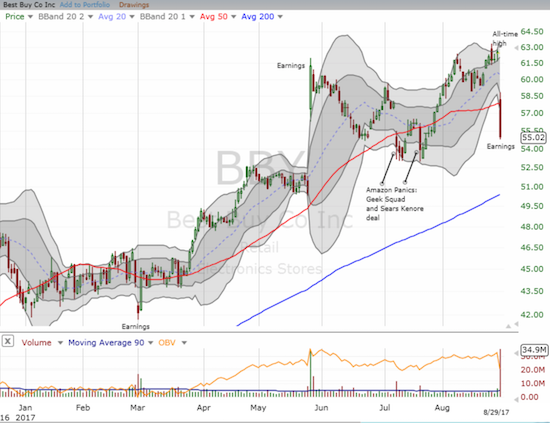
The true calamity of the day was Best Buy (BBY). BBY gapped down to its 50DMA and proceeded to continue selling into a 11.9% loss on the day. I covered my short position and took the profit. Ironically, this position was a market hedge and not a play on earnings. The trade could have gone the other way. As it stands, this is a very bearish move for BBY given it broke down on such large volume from its all-time high. The trading volume of 34.8M shares was the highest down volume since a 14.1% loss on January 15, 2015 when 40.6M shares traded (data from Yahoo Finance).
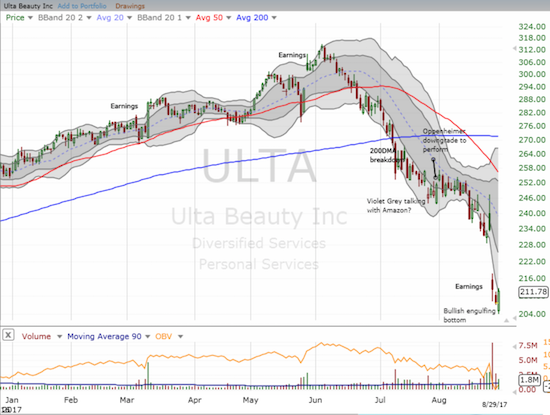
My trade on Ulta Beauty (ULTA) may have been one trading day premature, but the trade just might work out anyway. ULTA gapped down with the market today, but its bounce back turned into what looks like a bullish engulfing bottom. I even like buying shares here with a stop below today’s low.
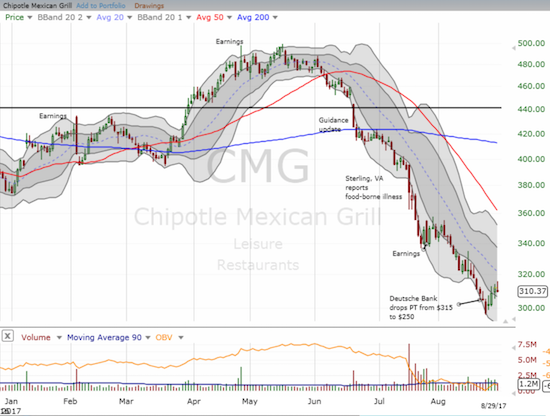
And then there is Chipotle Mexican Grill (CMG). I earlier went back to playing the downtrend. At the time I declared I would not even consider a bottoming in CMG until it managed two closes above the lower-BB band. CMG ALMOST pulled it off today. The stock showed relative strength right from the open by moving from a gap down and into the green in the first 15 minutes. It was mostly downhill from there as CMG quickly reverted to relative under-performance. I have a hedged position on with calls and puts, but I think the trade momentum in either direction is dying down for the week.
In one other trade, I decided to pull the trigger on my between earnings Intel (INTC) trade. I was trying to hold out until September and/or a big market swoon, but I decided to take the plunge here just in case the latest market volatility did indeed fizzle the enthusiasm of the latest round of motivated sellers.
— – —
FOLLOW Dr. Duru’s commentary on financial markets via email, StockTwits, Twitter, and even Instagram!
“Above the 40” uses the percentage of stocks trading above their respective 40-day moving averages (DMAs) to assess the technical health of the stock market and to identify extremes in market sentiment that are likely to reverse. Abbreviated as AT40, Above the 40 is an alternative label for “T2108” which was created by Worden. Learn more about T2108 on my T2108 Resource Page. AT200, or T2107, measures the percentage of stocks trading above their respective 200DMAs.
Active AT40 (T2108) periods: Day #385 over 20%, Day #199 over 30%, Day #7 under 40% (underperiod), Day #16 under 50%, Day #22 under 60%, Day #145 under 70%
Daily AT40 (T2108)
")
Black line: AT40 (T2108) (% measured on the right)
Red line: Overbought threshold (70%); Blue line: Oversold threshold (20%)
Weekly AT40 (T2108)

*All charts created using freestockcharts.com unless otherwise stated
The charts above are my LATEST updates independent of the date of this given AT40 post. For my latest AT40 post click here.
Related links:
The T2108 Resource Page
You can follow real-time T2108 commentary on twitter using the #T2108 or #AT40 hashtags. T2108-related trades and other trades are occasionally posted on twitter using the #120trade hashtag.
Be careful out there!
Full disclosure: long UVXY calls, long SVXY puts, long ULTA call, long CMG calls and puts, long INTC calls, long and short positions on the U.S dollar
*Charting notes: FreeStockCharts.com uses midnight U.S. Eastern time as the close for currencies. Stock prices are not adjusted for dividends.
Friday NFP bingo was a scratch day for me. May have been net down a dollar.
I was thinking about the euro today. The move to 1.20 is not just short squeeze and funding currency hedges being liquidated but also there is the fundamental driver of QE tapering. Anyway, I was mulling over it on the weekend and I thought perhaps I should be getting long euro here. There has been the expected pullback at 1.20 but usually when a currency moves this strongly with a fundamental reason, it keeps powering through. So I am thinking whether it is a buy here for a trade which I will probably pull the trigger on Monday. It is basically the mirror of the euro move before QE. I was thinking the move was overdone but it kept going for a while. Interestingly, it was almost finished by the time they did actually announce QE and I wonder whether the same will occur here (QE tapering).
I am starting to think the dollar could have significantly further to fall. Am leaning bullish on CAD, EUR and Yen. Yen hasn’t had the move EUR has. But Eur could move to 1.25 now in anticipation of QE tapering. Which is really symmetrical with what happened on the way down with anticipation of QE starting.
Glad to hear you are grabbing a hold of the euro higher train! 🙂 I am started re-accumulating EUR/USD long into this much welcome dip. That first run at 1.21 was startling. I agree it had the look of some kind of short-covering. But nothing has changed in the drivers sending euro higher. What surprised me greatly is the appearance of the euro acting like a “safety”currency during the last period of market angst.
CAD is looking VERY bullish. My next article should be on the latest developments.
Indeed, the dollar’s bottoming looks oh so short-lived.