
AT40 = 38.6% of stocks are trading above their respective 40-day moving averages (DMAs)
AT200 = 48.0% of stocks are trading above their respective 200DMAs
VIX = 11.3
Short-term Trading Call: neutral
Commentary
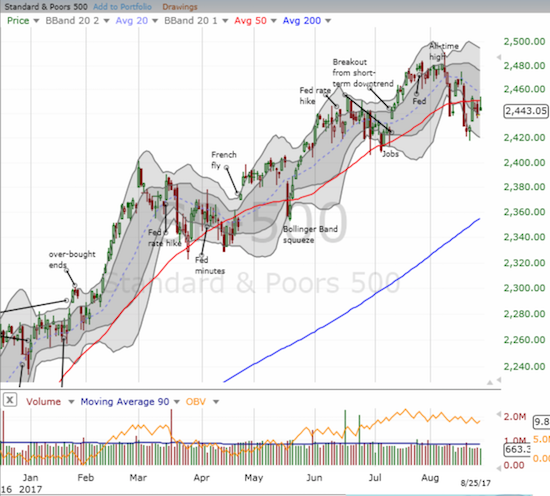
The S&P 500 (SPY) is suddenly struggling at its 50-day moving average (DMA). The big reflex bounce from Tuesday, August 22nd has yet to receive confirmation. On Friday, the index faded from resistance.
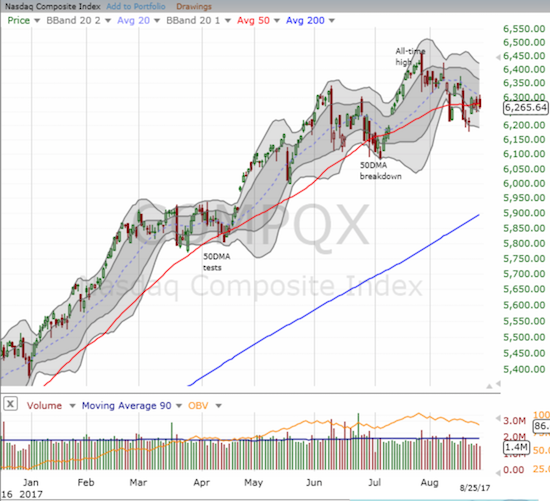
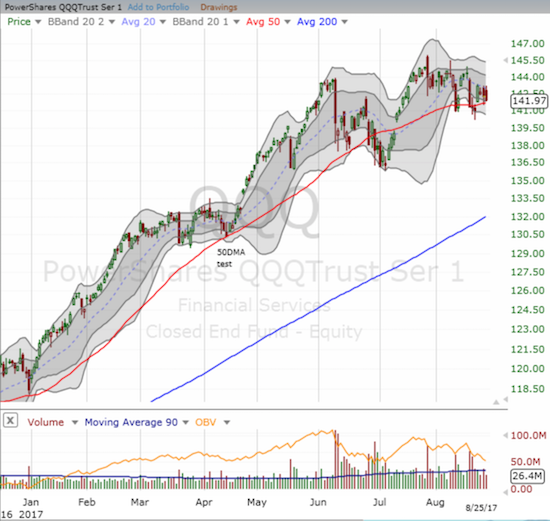
Interestingly, the NASDAQ is struggling with its 50DMA as a pivot while the PowerShares QQQ Trust (QQQ) is bouncing on top of its 50DMA like support and under its downtrending 20DMA as resistance.
In these fuzzy situations, AT40 (T2108), the percentage of stocks trading above their respective 40DMAs, can provide a deciding insight. My favorite technical indicator was a clear bullish sign as it bounced from “close enough” to oversold levels in the low 30%s and avoided a daily loss the entire week. AT40 even at one time nearly reversed its entire loss from the big plunge on August 17th. Still, my short-term trading call stays at neutral as I await definitive confirmation from the S&P 500 with a close above 2,475 (the peak of a topping pattern).
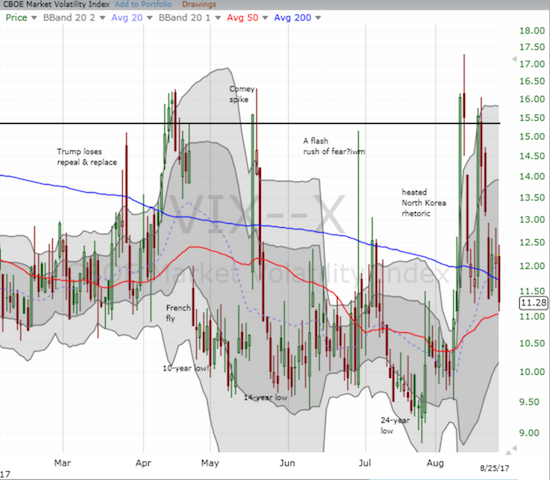
Along with the neutral call comes my hedges in the form of call options on ProShares Ultra VIX Short-Term Futures ETF (UVXY) and put options on ProShares Short VIX Short-Term Futures ETF (SVXY). Both are wasting assets as the volatility index (VIX) rapidly returned to extremely low levels. The VIX closed at 11.3 and confirmed a complete reversal of the North Korea fears from August 10th.
With concerns over North Korea returning to the background, the market may next choose to worry about the growing potential of a government shutdown. I am very skeptical of this latest political drama: the scene seems draped in a big bluff. President Donald Trump simply needs to demonstrate to his base that Congress blocked his effort to build a wall at the U.S.-Mexican border (nevermind that the President’s latest threats would force U.S. taxpayers and not Mexico to pay for the wall). As a result, I will be looking to fade any coming VIX spikes driven by headlines of a government shutdown.
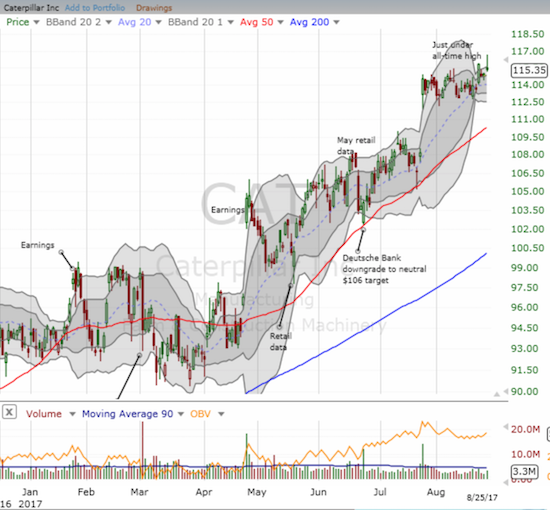
Caterpillar (CAT)
CAT is on the edge of throwing its hat into the ring of bullish confirmation. The stock rests directly below an all-time high. On August 22, CAT came short of the all-time closing high set on February 23, 2012 by a mere 28 cents. To close the week, CAT’s intraday high broke through the all-time high but sellers refused to leave CAT to bask in all-time high glory. Although the fade makes CAT look a bit toppy, the current Bollinger Band (BB) squeeze has resolved to the upside. I would normally look to buy a new all-time high, but I may need CAT for a hedge against bullishness during this seasonally weak period for stocks. I will definitely short CAT upon a close below the current trading range.
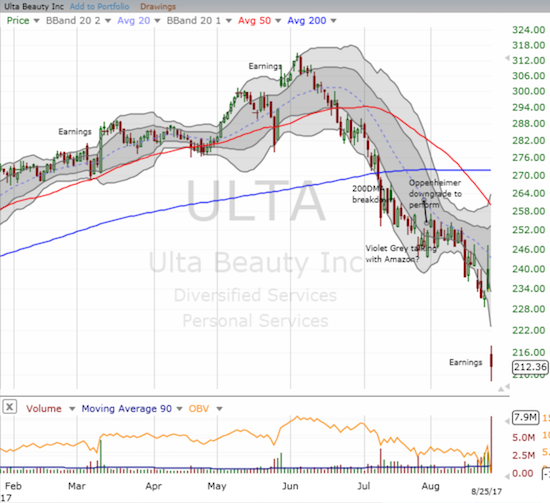
Ulta Beauty (ULTA)
I have posted several warnings about ULTA in previous posts: I concluded that traders and investors were eagerly exiting the stock. Given the expense of options going into earnings, I did not make another short-term bearish bet (I also missed a great fade on the last day of trading before earnings!). I just watched as ULTA cratered to a 9.1% loss. I then turned around and speculated on a call option for a quick bounce given the plunge well below the lower-Bollinger Band (BB).
Surprisingly, short interest is only 4.6% of ULTA’s float. That percentage could rise substantially as the shares short hit a high as ULTA hit an all-time high. Bears have yet to relent since then.
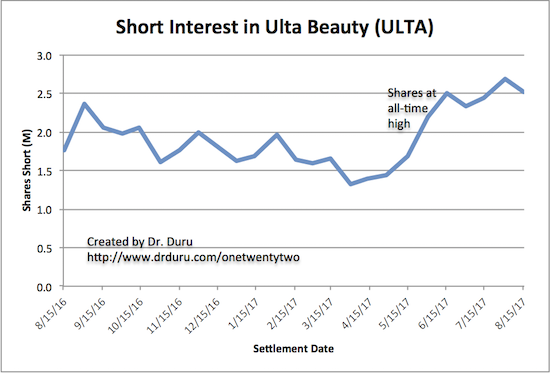
Source: NASDAQ
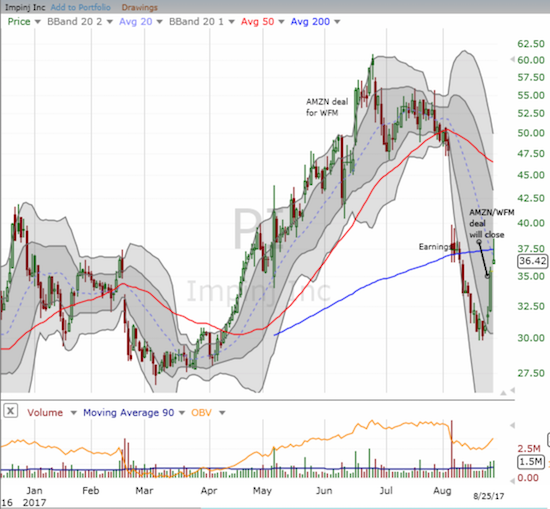
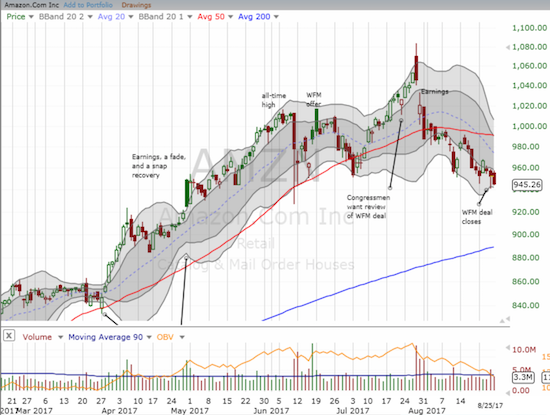
The Amazon Panic
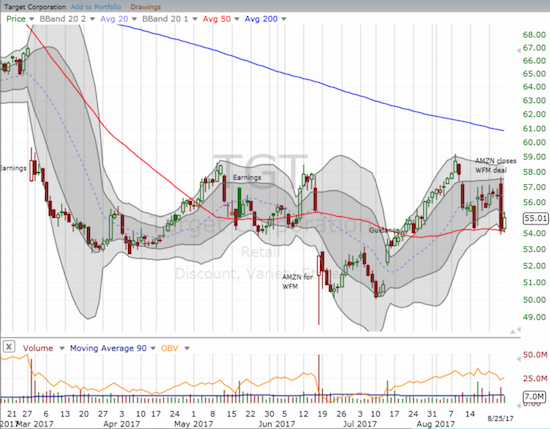
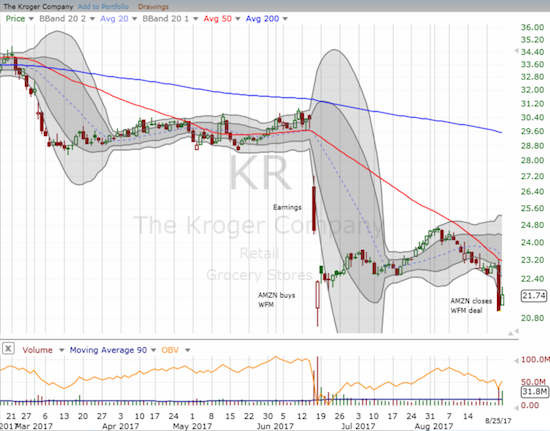
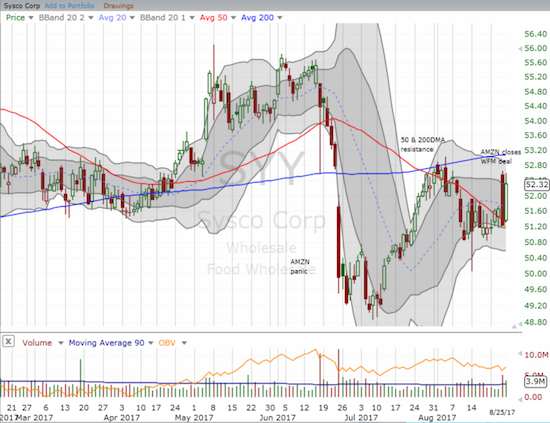
The on-going “Amazon Panic” deserves its own section. Last week, Amazon.com (AMZN) closed its deal to buy Whole Foods Market (WFM). The reaction in the market was surprisingly harsh – as if traders and investors were harboring hopes that the deal would get scuttled. All the usual suspects reacted. EVEN Impinj (PI) popped – a stock I am glad I was skeptical of buying at the time it first popped on the AMZN news. I DID finally buy following a disastrous market reaction to the last earnings report; I also accumulated more shares as the selling continued. I was dismayed until the deal closing sent PI soaring. I also took advantage of this latest AMZN panic to jump back in call options on Target (TGT). An order to buy fresh call options on Kroger (KR) failed to fill, but I will line up more Amazon Panic buys for next week.
Snap Back?
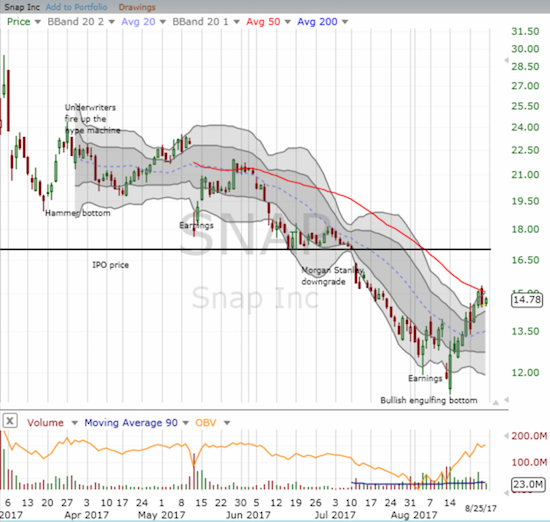
I have not talked about Snap, Inc. (SNAP) in a long time. I essentially ended my bearishness on SNAP as it approached its IPO price. I just assumed that the market would buy and hold that line as support. I even thought that the company would correct its mistakes from the last earnings report. Strike one and strike two. YET, SNAP looks like it finally bottomed. The day after earnings, SNAP printed a powerful bullish engulfing pattern. It shot up like a rocket from there until it hit 50DMA resistance. If SNAP can close above that resistance, it should return to $17 in relatively short order. Note that sentiment on StockTwits on SNAP is now 58% bullish. Short interest weighs heavy on SNAP: 17.8% of float.
— – —
FOLLOW Dr. Duru’s commentary on financial markets via email, StockTwits, Twitter, and even Instagram!
“Above the 40” uses the percentage of stocks trading above their respective 40-day moving averages (DMAs) to assess the technical health of the stock market and to identify extremes in market sentiment that are likely to reverse. Abbreviated as AT40, Above the 40 is an alternative label for “T2108” which was created by Worden. Learn more about T2108 on my T2108 Resource Page. AT200, or T2107, measures the percentage of stocks trading above their respective 200DMAs.
Active AT40 (T2108) periods: Day #385 over 20%, Day #199 over 30%, Day #7 under 40% (underperiod), Day #16 under 50%, Day #22 under 60%, Day #145 under 70%
Daily AT40 (T2108)
")
Black line: AT40 (T2108) (% measured on the right)
Red line: Overbought threshold (70%); Blue line: Oversold threshold (20%)
Weekly AT40 (T2108)

*All charts created using freestockcharts.com unless otherwise stated
The charts above are my LATEST updates independent of the date of this given AT40 post. For my latest AT40 post click here.
Related links:
The T2108 Resource Page
You can follow real-time T2108 commentary on twitter using the #T2108 or #AT40 hashtags. T2108-related trades and other trades are occasionally posted on twitter using the #120trade hashtag.
Be careful out there!
Full disclosure: short put options on SYY and KR, long PI, long SNAP, long UVXY calls, long SVXY puts, long ULTA call
*Charting notes: FreeStockCharts.com uses midnight U.S. Eastern time as the close for currencies.
Hey DD, I think the time has come to short eur.usd ! I put in a full position at 1.204 and stoploss at 1.22. It should be interesting to see if the stop gets hit or eur pulls back around here.
Good luck! I am not that brave yet. I do have a short EUR/AUD going though. I just can’t trust the U.S. dollar with this amazingly vicious downtrend its on. Move quickly! 🙂
I think these countertrend moves can be high probability when a short term exhaustion pattern forms. I covered eur.usd short at 1.194. Not a great risk:reward but still EV positive in my view due to the probability of reversal being better than 80% from my subjective assessment. I suppose with the countertrend trades, averaging down is suicidal, so one has to take ones lump if it keeps moving through.
Not much in forex currently. I am thinking about what the best short candidate might be in the next stock correction. Any ideas DD ? I was thinking of investigating TSLA further.
Great trade! And, surprising to me, EUR/USD continues downward. I guess the euro really did become a “safety” currency for a bit there.
TSLA is a tough one because there are clearly automatic buy programs supporting it. Too many shorts already in it too. I always like CAT for shorting in downturns. Retailers will probably get crushed further. Safest bet is to just go after an index/ETF.
Yes, I was surprised by how far it fell and covered most people f my position about 70 pips too early.
CAD is looking somewhat attractive to go long at current oil prices and I think I will enter a small position here short usd.cad at 1.263.
I really liked your piece on the concrete stock. The forex trading which is less than 1% of my portfolio is unlikely to move the needle much in terms of long term outcome. I do it out of fun and to stay active in markets. What I’m really doing is just biding time to wait for the 10 baggers that come along very irregularly. And some of these stocks bounce amazingly after a good bear market.
I had thought aud.usd and index shorts were
the way to play a bear market, but I am beginning to also investigate shorting overvalued and fundamentally unsound stocks. Something like TSLA in the small or mid cap space might be even better. TLSA could
be better than an SPX short though. It depends too I guess on which sector the next meltdown occurs from. The more obvious candidates would be something FANG related or something China related but it probably will be something else. Maybe a mid cap biotech or tech stock that is overhyped and fundamentally doomed. Harder to find that it is to describe !
I am also tempted by the idea of long conventional retail and short Amzn or long conventional car stocks, short TLSA. But neither the retailers or carmakers have been liquidated enough yet from my reckoning. So it might be better to actually short Amzn or TLSA and buy conventional retail when it reaches a point of maximum pessimism.
I haven’t shorted TLSA in the past but am looking into the idea. It could be a good bellwether to watch in terms of general market condition and may well break down before the general market.
I need to write a piece on the Canadian dollar because I am definitely more bullish on it again after that GDP print. Not to mention the market’s reaction to the GDP print.
Thanks for the kudos on USCR. I have a follow-up due on that given the post hurricane surge. A LOT of concrete will be needed for rebuilding, but I am not sure whether USCR’s supply chain from Dallas will be useful.
For shorting, I say start with the indices. CAT is my favorite next. After that, you might be able to throw darts. Anything China related will get hit hard just because a lot of hot money crowds into those plays.
Just remember that TSLA and AMZN are highly loved stocks. They will be the FIRST bought anytime the market thinks something good is happening or a turn-around is at hand. In other words, stocks like these have automatic bids underneath them. Not the most ideal shorts because you will have to stay on edge all the time. But I agree both would have a long way down in a bear market.
Good points about TSLA and AMZN buy programs.
The CAD move is interesting. Not sure how to play it from here. I actually took profit after Canadian GDP and before NFP.
I just enterered small position long eur.cad. It is probably due for a bounce after 2 big down days.