
AT40 = 45.5% of stocks are trading above their respective 40-day moving averages (DMAs)
AT200 = 53.5% of stocks are trading above their respective 200DMAs
VIX = 11.1 (volatility index)
Short-term Trading Call: neutral (first day of downgrade)
Commentary
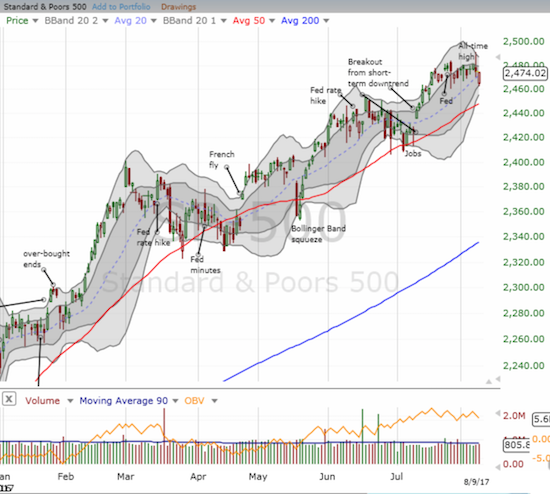
The stock market had a weak open but a strong close. On the heels of ratcheting and heating rhetoric between North Korea and the U.S. (or really between Kim Jung Un and Donald Trump), the S&P 500 (SPY) gapped down close to its low from the July 27th quick swoon. Surprise, surprise – sellers lost interest from there and the index closed near flat on the day.
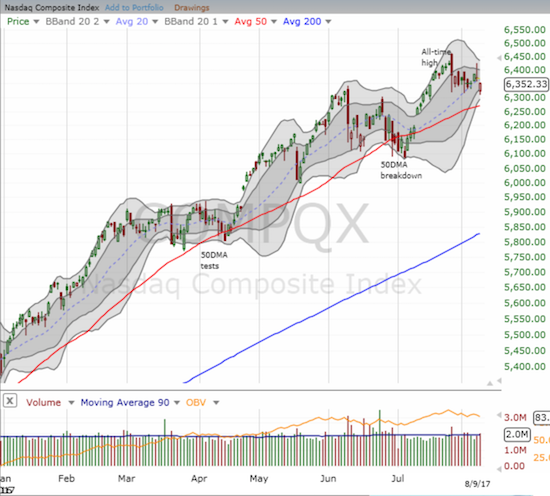
The charts of the NASDAQ and PowerShares QQQ Trust (QQQ) show how the swoon on July 27th brought upward momentum to a screeching halt. In its place has come wide-ranging churn with a Bollinger Band (BB) squeeze slowly forming.
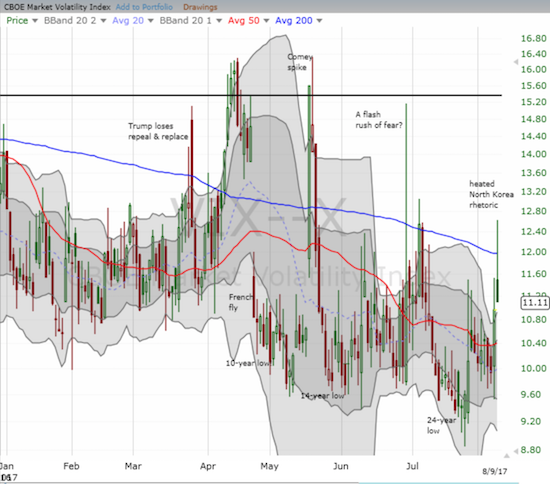
The volatility index, the VIX, reminded us just how hard it remains for sellers to commit to applying pressure to the market. The VIX gapped higher and soared as high as 12.6 before the implosion began. At the close, the VIX traded at its low of the day and barely gained over 1% from the previous day’s close. As I have learned not to trust sellers on these swift moves, I immediately locked in my profit on my single call option on ProShares Ultra VIX Short-Term Futures ETF (UVXY). I was never able to increase my position for cheaper prices. As a reminder, I have a strategy going into the stock market’s seasonally weak period to buy call options on UVXY with expirations every two weeks or so. I was amazed UVXY still closed with a decent 5.2% gain.
AT40 (T2108), the percentage of stocks trading above their respective 40-day moving averages (DMAs), is the kicker in all this. In my last Above the 40 post, I followed up on my explanation of the implications for a bearish divergence between a declining AT40 and a levitating S&P 500. Memories of that post moved me to downgrade my short-term trading call from “cautiously bullish” to “neutral” as I watched AT40 plunge and then fail to recover much with the major indices. As a part of that downgrade, I loaded up on call options on ProShares UltraShort S&P500 (SDS) along with a single call option on ProShares Short VIX Short-Term Futures ETF (SVXY) in case the market just continues going nowhere. If recent history holds, the S&P 500 will have a deeper swoon in the coming week or so for at least a day. I will look to close out the SDS position at that time. Assuming AT40 will be nearing oversold conditions at that time, I will switch to considering the bullish case again.
AT40 dropped from 49.0% to 45.5%. AT200 (T2107), the percentage of stocks trading above their 200DMAs, fell from 55.6% to 53.5%. This is the FOURTH lowest close of the year for AT200. In other words, while the S&P 500 is barely off its all-time highs, the underlying health of the market is once again very poor.
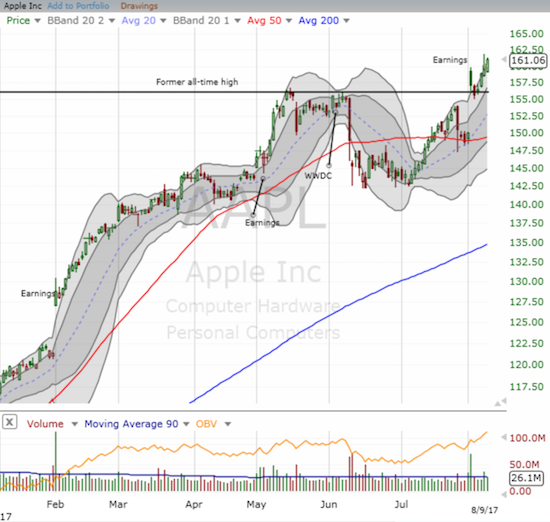
Apple (AAPL) is one of the reasons the major indices are holding up as well as they are. AAPL bucked the trend today and managed a very strong close to a new all-time high. I was so busy basking in the glow of a major win playing AAPL earnings last week that I completely failed to get right back into the ring with call options to play a Monday gain. AAPL has barely slowed down all week and carries a very bullish chart given the bounceback from initial post-earnings selling.
I was also caught off-guard because I assumed the post-earnings selling meant AAPL would return to lagging behind the usual suspects. Instead, most of the usual suspects have struggled mightily since AAPL’s earnings. Ironically, I was quick to jump on four of them for call option trades: Facebook (FB), Alphabet (GOOG), Amazon.com (AMZN), and Netflix (NFLX). Today, I turned on GOOG and NFLX with a put option and shares short respectively. AMZN and GOOG trade below their 50DMAs. The other usual suspect, Nvidia (NVDA), is hitting all-time highs as it goes into its earnings report on Thursday.
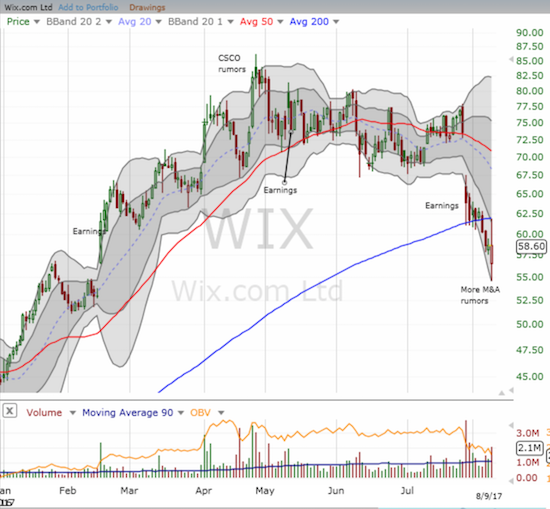
Wix.com (WIX) is an interesting play as its earnings disappointed and the stock went on to confirm a 200DMA breakdown. Given the growing weakness I was not surprised to see WIX gap down and then quickly trade to its lower-BB. Shortly after that, fresh M&A rumors made the round. Conveniently, WIX surged from there and even tapped a picture-perfect test of 200DMA resistance. I was not fast enough to lock in nice profits on my put option. However, I suspect absent more M&A rumors the regularly scheduled programming will return quickly.
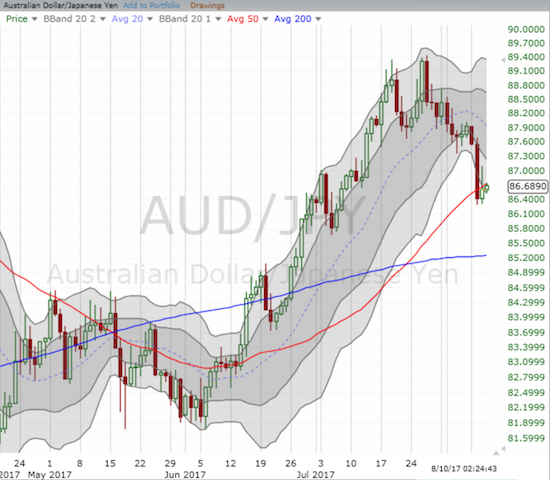
In other trading follow-up: 1) I returned to a bearish bias on Chipotle Mexican Grill (CMG) as sellers have found a comfortable stoop on these shares; 2) I locked in profits on my Best Buy (BBY) call options which were a hedge on my accumulated short on BBY – the stock made a new all-time high on Monday so I clearly stayed on the wrong side of the fence; 3) I locked in profits on my Twilio (TWLO) call option after the stock soared post-earnings – I remain bullish given the CEO’s major purchase near lows in May; 4) I locked in profits on U.S. Steel (X) call options as X completed a picture-perfect bounce off 50DMA support; 5) The Japanese yen strengthened on Monday, and I took the opportunity to lock in profits on my latest short AUD/JPY. AUD/JPY cracked 50DMA support and is confirming underlying market weakness.
— – —
FOLLOW Dr. Duru’s commentary on financial markets via email, StockTwits, Twitter, and even Instagram!
“Above the 40” uses the percentage of stocks trading above their respective 40-day moving averages (DMAs) to assess the technical health of the stock market and to identify extremes in market sentiment that are likely to reverse. Abbreviated as AT40, Above the 40 is an alternative label for “T2108” which was created by Worden. Learn more about T2108 on my T2108 Resource Page. AT200, or T2107, measures the percentage of stocks trading above their respective 200DMAs.
Active AT40 (T2108) periods: Day #374 over 20%, Day #188 over 30%, Day #55 over 40%, Day #5 under 50%, Day #11 under 60%, Day #134 under 70%
Daily AT40 (T2108)
")
Black line: AT40 (T2108) (% measured on the right)
Red line: Overbought threshold (70%); Blue line: Oversold threshold (20%)
Weekly AT40 (T2108)

*All charts created using freestockcharts.com unless otherwise stated
The charts above are my LATEST updates independent of the date of this given AT40 post. For my latest AT40 post click here.
Related links:
The T2108 Resource Page
You can follow real-time T2108 commentary on twitter using the #T2108 or #AT40 hashtags. T2108-related trades and other trades are occasionally posted on twitter using the #120trade hashtag.
Be careful out there!
Full disclosure: long SVXY call, long SDS calls, long FB calls, long GOOG call spread and put option, long AMZN call spread, long NFLX calls and short shares, long WIX put, short BBY shares
*Charting notes: FreeStockCharts.com uses midnight U.S. Eastern time as the close for currencies.