
AT40 = 67.2% of stocks are trading above their respective 40-day moving averages (DMAs)
AT200 = 65.1% of stocks are trading above their respective 200DMAs
VIX = 10.8 (volatility index)
Short-term Trading Call: bullish
Commentary
The French Fly continued apace as financial markets continued to celebrate. In my previous post, I failed to post a chart of the iShares MSCI France (EWQ).
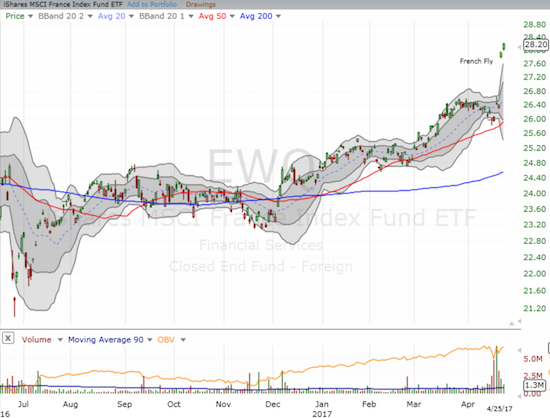
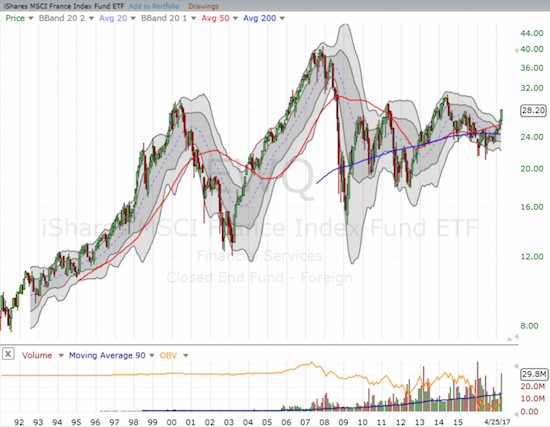
The major relief from the first round of the French Presidential election, what I call the French Fly, pushed EWQ to a major breakout to a near 3-year high. Yet, as I pointed out in my last “Above the 40” in discussing the lack of apparent fear in the euro, EWQ showed very little trepidation about the election. Indeed, going into the election, EWQ bounced near support at its 50-day moving average (DMA) and even at one point traded at a near 3-year high before fading a bit. In other words, I am hard-pressed to find evidence in the expected places that financial markets held authentic fear surrounding events in France. I am even more interested now in the bull story for France, and Europe in general, because of the tremendous upside potential of a growing recovery story.
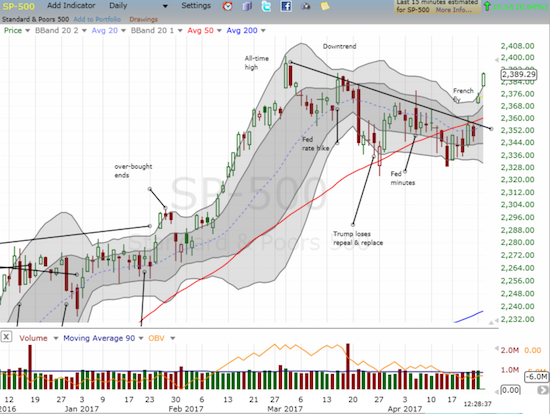
On the other side of the Atlantic, the U.S. market continued its own celebration as it apparently chose to focus on positive U.S. headlines about tax reform and the likely avoidance of a government shutdown.
With S&P 500 trading well above upper-Bollinger Band, sold $SSO shares and calls. Ref: https://t.co/1IY5TvrkiX $SPY pic.twitter.com/H30qRF8wAj
— Dr. Duru (@DrDuru) April 25, 2017
The S&P 500 (SPY) gained 0.6% and closed above its upper-Bollinger Band (BB). At its height, AT40 (T2108), the percentage of stocks trading above their respective 40DMAs, hit 68.6% before settling in at 67.2%. With the index so stretched at the same time that AT40 traded near overbought levels, I decided it was a good time to lock in profits on my ProShares Ultra S&P500 (SSO) shares and call options. Note well that I remain bullish, but I prefer to to buy the next dip with conditions already looking a bit stretched. Also note that AT200 (T2107), the percentage of stocks trading above their respective 200DMAs, closed at a new 6-week high and broke out above a wide trading range.
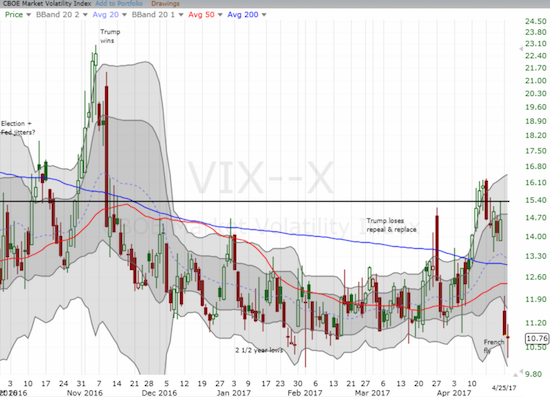
The volatility index, the VIX, apparently also stretched to a limit. At its lowest point, the VIX hit 10.2. A close there would have made a new 10-year closing low. Instead, the VIX matched a near 3-year low as it bounced to close at 10.8. The VIX was so low, I decided to load up on a hedged play on ProShares Ultra VIX Short-Term Futures (UVXY) with put options expiring this week and call options expiring next week.
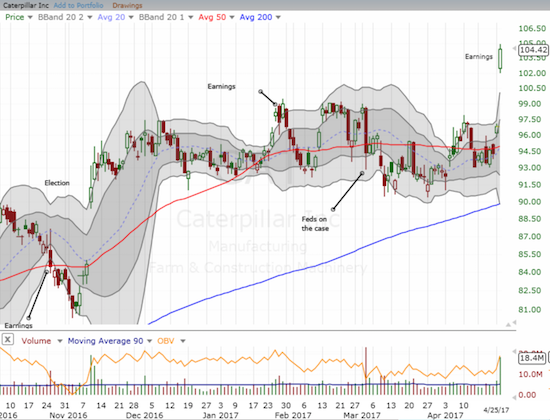
The day was a bullish day for industrial type stocks. Nothing says BULL like a post-earnings gap up from Caterpillar (CAT). CAT gained an amazing 7.9% and closed at a 2 1/2 year high. I was so impressed that I put in a low-ball order to buy call options (they never closed).
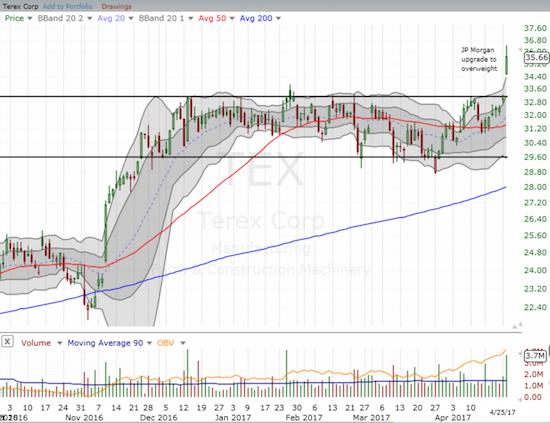
Terex (TEX), the “poor man’s CAT”, printed its own breakout, partially in sympathy with CAT, partially in response to a strong upgrade from JP Morgan. TEX is now on my list to buy on dips.
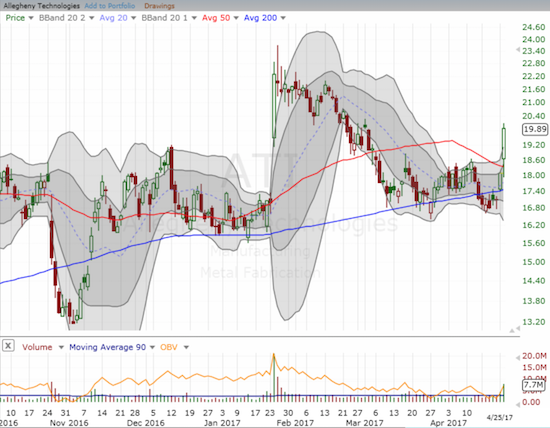
An industrial stock I already own, Allegheny Technologies Incorporated (ATI), made a bullish move breaking out above its 50DMA resistance which also confirmed 200DMA support.
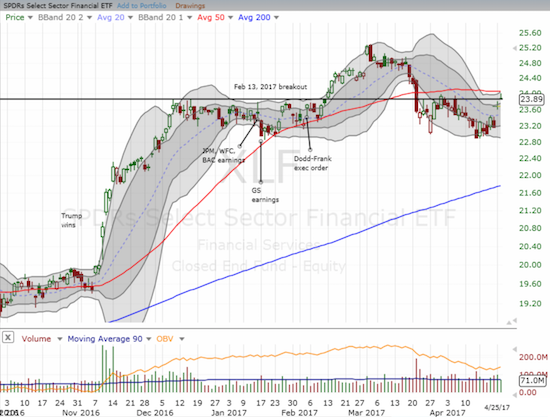
Traders and investors have almost restored financials to a bullish position. The Financial Select Sector SPDR ETF (XLF) rallied right to the mid-February breakout line after failing at its high at 50DMA resistance. This battle is an important one. A close above the 50DMA would confirm the market’s refreshed bullishness.
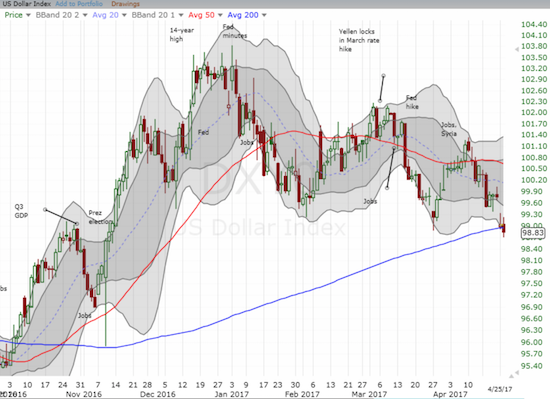
Finally, the U.S. dollar index (DXY0) closed at the edge of a major breakdown. The dollar’s 200DMA support has not been tested since the day after the U.S. Presidential election. The dollar last closed below this critical trendline on October 4th. Follow-through on this crack of support could change the flavor of the market. The premise of a strong U.S. economy and a strong U.S. dollar may get tested here and flip to a new theme of weaker dollar and stronger exports equals yet more gains for U.S. stocks. Stay tuned on that one…
Be careful out there!
— – —
FOLLOW Dr. Duru’s commentary on financial markets via email, StockTwits, Twitter, and even Instagram!
“Above the 40” uses the percentage of stocks trading above their respective 40-day moving averages (DMAs) to assess the technical health of the stock market and to identify extremes in market sentiment that are likely to reverse. Abbreviated as AT40, Above the 40 is an alternative label for “T2108” which was created by Worden. Learn more about T2108 on my T2108 Resource Page. AT200, or T2107, measures the percentage of stocks trading above their respective 200DMAs.
Active AT40 (T2108) periods: Day #297 over 20%, Day #117 over 30%, Day #7 over 40%, Day #4 over 50%, Day #2 over 60% (overperiod), Day #69 under 70%
Daily AT40 (T2108)
")
Black line: AT40 (T2108) (% measured on the right)
Red line: Overbought threshold (70%); Blue line: Oversold threshold (20%)
Weekly AT40 (T2108)

*All charts created using freestockcharts.com unless otherwise stated
The charts above are my LATEST updates independent of the date of this given AT40 post. For my latest AT40 post click here.
Related links:
The T2108 Resource Page
You can follow real-time T2108 commentary on twitter using the #T2108 or #AT40 hashtags. T2108-related trades and other trades are occasionally posted on twitter using the #120trade hashtag.
Be careful out there!
Full disclosure: long ATI, long call and put options on UVXY, long and short positions on the U.S. dollar index
*Note QQQ is used as a proxy for a NASDAQ-related ETF