

The Market Breadth Summary
- The market narrative centered on the SpaceX IPO, but the repeated fade from orbit across tech stocks suggested that short-term enthusiasm peaked.
- However, Sunday news about a deal in the Iran war could reset technicals across the stock market and provide pre-Fed trading momentum.
- Small caps and underlying breadth improved, with the Russell 2000 reaching new highs and the percentage of S&P 500 stocks trading above their 200DMAs confirming a bullish divergence.
- Consumer-facing stocks continued strengthening even as several software and AI-related names deteriorated technically.
- Market breadth held key support levels, leaving the short-term trading call neutral but with the potential for a bullish shift.
- Rotation away from technology and toward consumer-oriented stocks influenced my latest stock accumulation decisions.
The Stock Market Indices
Last week was largely about the SpaceX IPO (SPCX) and the anticipation surrounding the debut. The stock priced at $135 and a $1.75 trillion market cap, opened at $150, traded almost as high as $177, and closed at $160.96 on 521.8M in trading volume. If SPCX eventually breaks above $177, then the launch will be fully successful; every buyer will be in the green. However, the persistent fade from the orbit of the intraday high suggests to me that a lasting short-term top is in place. The $150 opening price is also critical because a break below that level would place everyone who bought after the open underwater and raise the risk of a decline toward the IPO price. If the IPO price fails as a support, SPCX would become a busted IPO and ultimate downside could become substantial given the stock’s stratospheric valuation: trailing price/sales of 26, forward price/sales of 61, trailing enterprise value (EV)/sales of 110, forward EV/sales of 62, price/book of 27, and no profits anywhere on the horizon. I have no interest in investing in SPCX, and, for now, I have no interest in trading it. I am mainly looking for relationships between trading in SPCX and the rest of the stock market, especially tech.
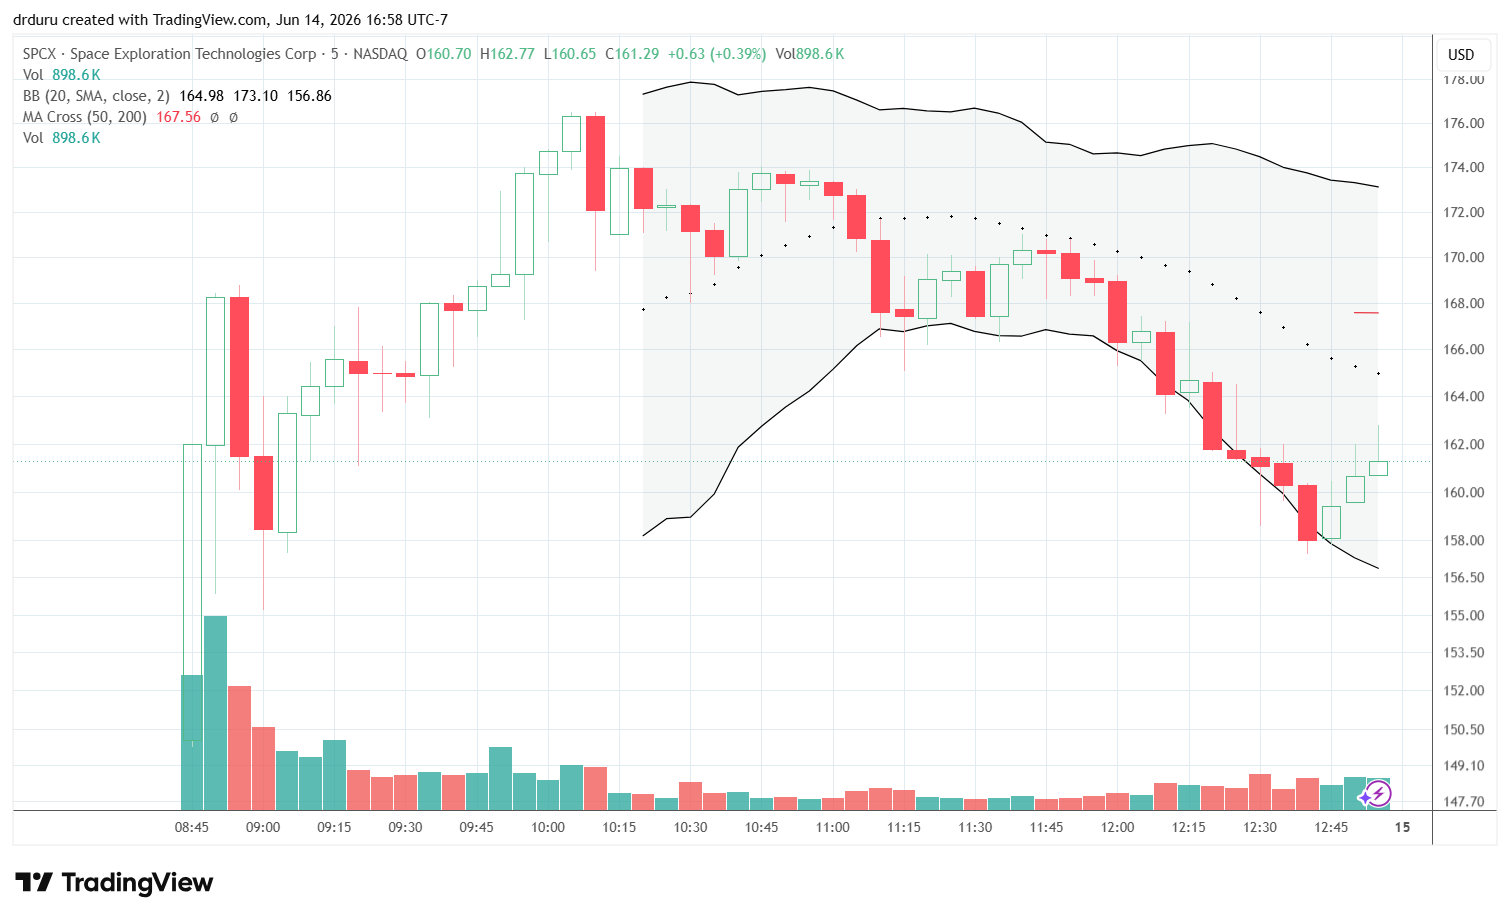
Jim Cramer of CNBC was impressed by the open. He even wants to buy the stock. I agree that the first trading day was well-managed. I was expecting a frenzy to open the stock at a crazy high price, like double the IPO price, and leave a lot of people holding the bag in post-IPO trading.
Meanwhile, I noticed several other fades from orbit across individual stocks in tech. At the same time, consumer-facing names continue to improve. A subtle rotation is ongoing and is pushing me to accumulate non-tech stocks even as the headline focus and excitement is in tech.
At the time of writing (Sunday, June 14, 2026) news headlines announced a deal between the U.S. and Iran to end the war. Futures are soaring in response even though, as usual, no details are forthcoming. For now, the deal reads like a renewed ceasefire. If this latest war development holds into Monday’s open, then the technicals of the stock market could complete and ignite a rally going into a very big and important Federal Reserve meeting on Wednesday. This meeting features the highly anticipated debut of Kevin Warsh as the new head of the Fed. For monetary policy wonks, this press conference will be even bigger than the SPCX debut.
S&P 500 (SPY)
The S&P 500 (SPY) bounced successfully away from 50DMA support, a bullish move. However, the index faded from orbit as it failed to break through 20DMA resistance. SPY remains below the former double top, leaving the technical picture in limbo. Perhaps the celebration of another announced deal in the war against Iran will push the S&P 500 through resistance from the former double top.
")
NASDAQ (COMPQ)
The NASDAQ (COMPQ) tested 50DMA support three times last week and survived each test. That trading action was bullish. However, COMPQ remained well below 20DMA resistance. Perhaps the celebrations over the deal news will hurdle the tech-laden index over this resistance.
")
iShares Russell 2000 ETF (IWM)
IWM returned to relative technical leadership and even reached new all-time highs on Friday. Small-cap strength also helped prop up market breadth. Still, the ETF of small caps faded from orbit with a 3-point retreat from its intraday all-time high.
")
The Short-Term Trading Call With A Fade from Orbit
- AT50 (MMFI) = 56.6% of stocks are trading above their respective 50-day moving averages
- AT200 (MMTH) = 55.4% of stocks are trading above their respective 200-day moving averages
- Short-term Trading Call: neutral
AT50 (MMFI), the percentage of stocks trading above their respective 50DMAs, closed the week at 56.6%, a 7-point jump from the previous week’s close right at support. My favorite technical indicator never fell below support, but it also tantalizingly faded from orbit at its persistent downtrend. Thus, my short-term trading call remains neutral. I fully expect a Monday celebration over a deal in the Iran war to produce a market breadth breakout.
")
AT200 (MMTH), the percentage of stocks trading above their respective 200DMAs, also failed to clear a major pivot level dating back to early 2025. Thus this indicator of the longer-term health of market breadth remains stuck in neutral.
")
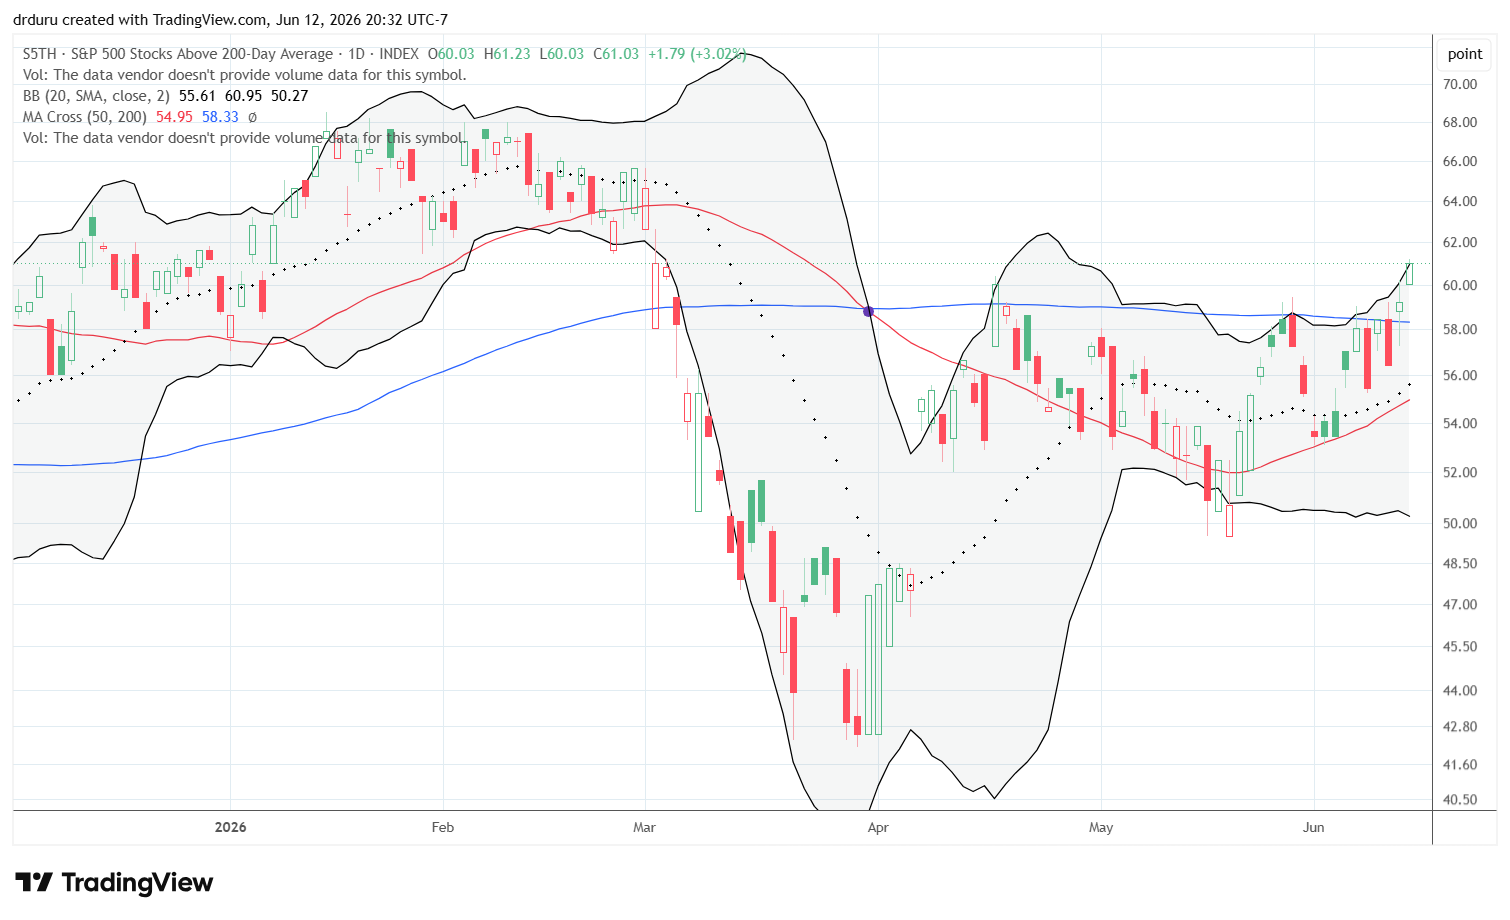
Once again, the percentage of S&P 500 stocks trading above their 200DMAs (S5TH) caught my attention. A week ago, I noted how S5TH provided further evidence of a positive divergence in the underlying technicals of the market. Last week, S5TH confirmed the bullish divergence with a definitive and confirmed breakout. Thus, I fully expect to flip bullish at some point next week.
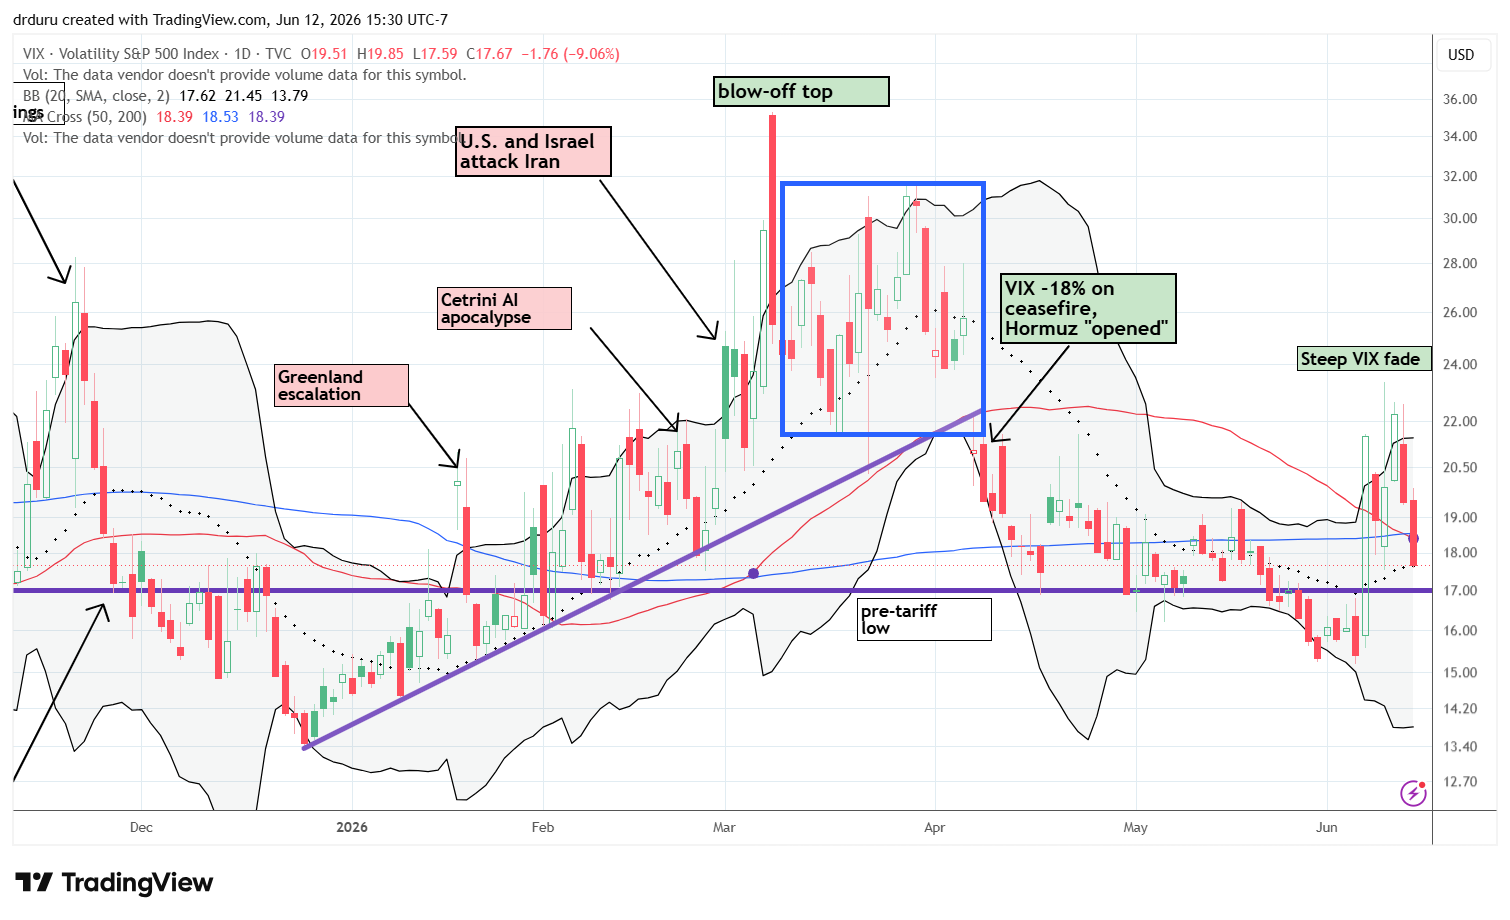
The volatility index (VIX) spent much of last week fading from orbit. While the VIX stopped short of fully reversing its 39.7% surge from a week ago, momentum points to a fresh breakdown below the pre-tariff low (the purple line below) and a return to confirming bullishness.
In case you missed it…
On Tuesday, June 9, I pointed how the resilience in market breadth delivered bullish implications for the broader stock market.
The Equities
Roundhill Space and Technology ETF (MARS)
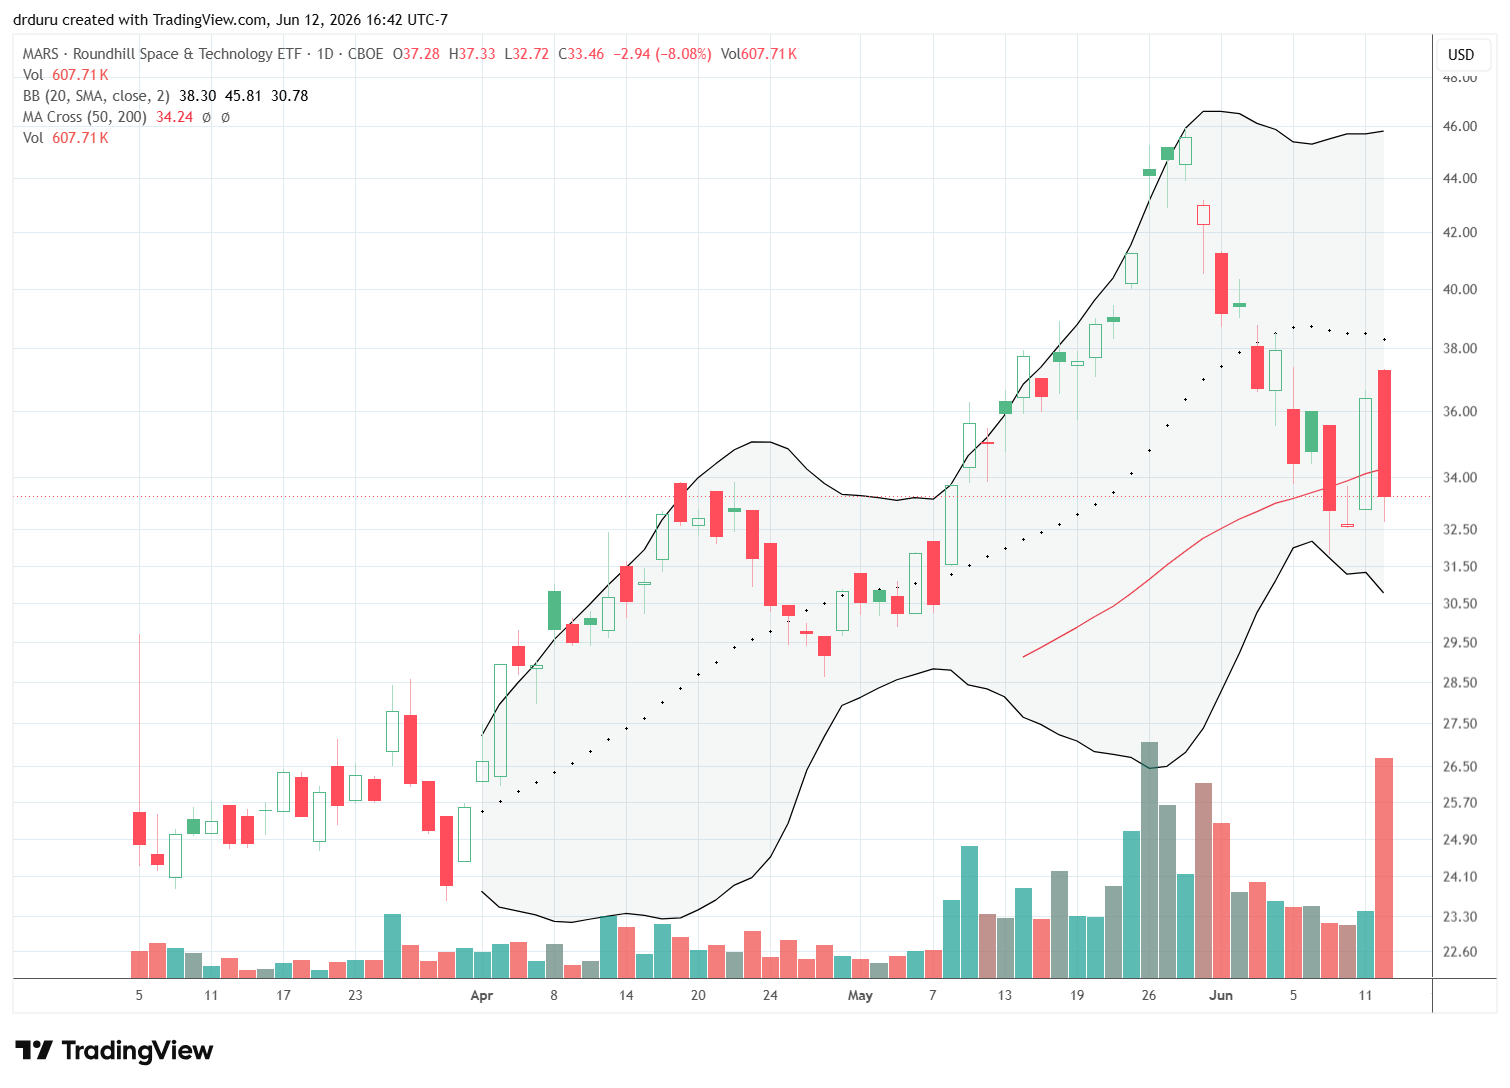
Description: Roundhill Space and Technology ETF seeks exposure to companies involved in space exploration and related technologies.
Technical status: Roundhill Space and Technology ETF (MARS) is trying to hold support at its 50DMA after giving back gains associated with SpaceX IPO excitement.
Trade commentary: I liked the way MARS pivoted around 50DMA support. I bought shares just above the 50DMA and intend to treat the position as a long-term hold. If space becomes the next major investment theme (after AI), I want to have at least a small piece of the theme without taking on individual stock risk, especially given the sky-high valuations in the sector.
iShares Expanded Tech-Software Sector ETF (IGV)
Description: iShares Expanded Tech-Software Sector ETF provides exposure to U.S. software companies.
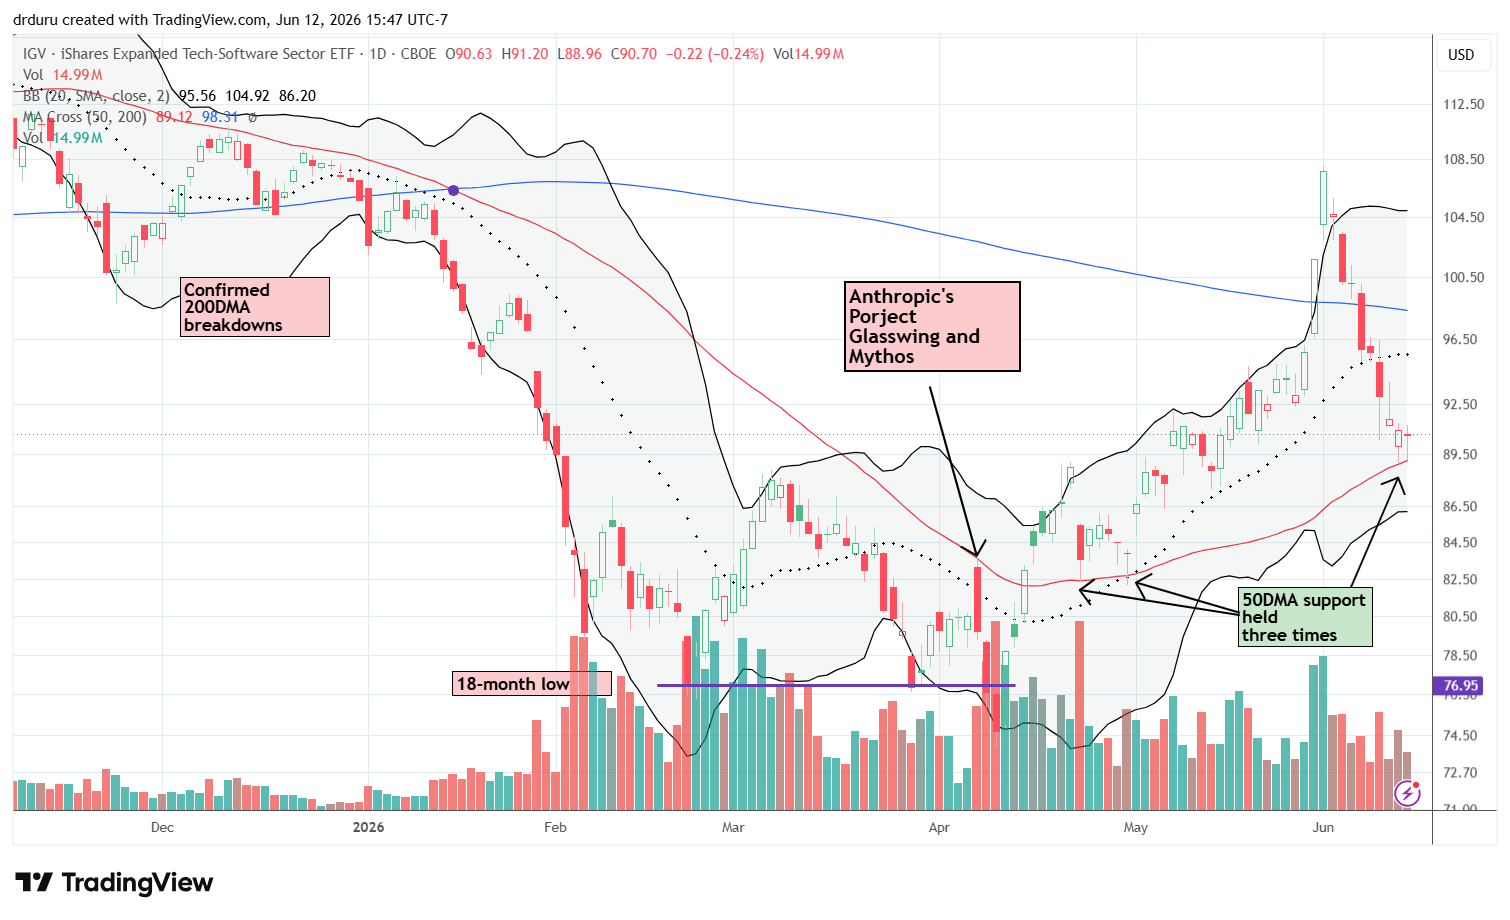
Technical status: The iShares Expanded Tech-Software Sector ETF (IGV) broke below 200DMA support but held support at its 50DMA.
Trade commentary: I found the support at the 50DMA very encouraging and bought IGV shares on Thursday. Unlike other core investing and trading themes, I am holding individual software stocks as core and trading around them with IGV. IGV is yet one more example of the collapse that awaits the other side of a parabolic move. After IGV surged well above its upper Bollinger Band to start the month of June with a 5.9% gain, sellers took the ETF straight down. The selling only paused at 50DMA support.
Microsoft Corporation (MSFT)
Description: Microsoft develops software, cloud services, devices, and productivity applications.
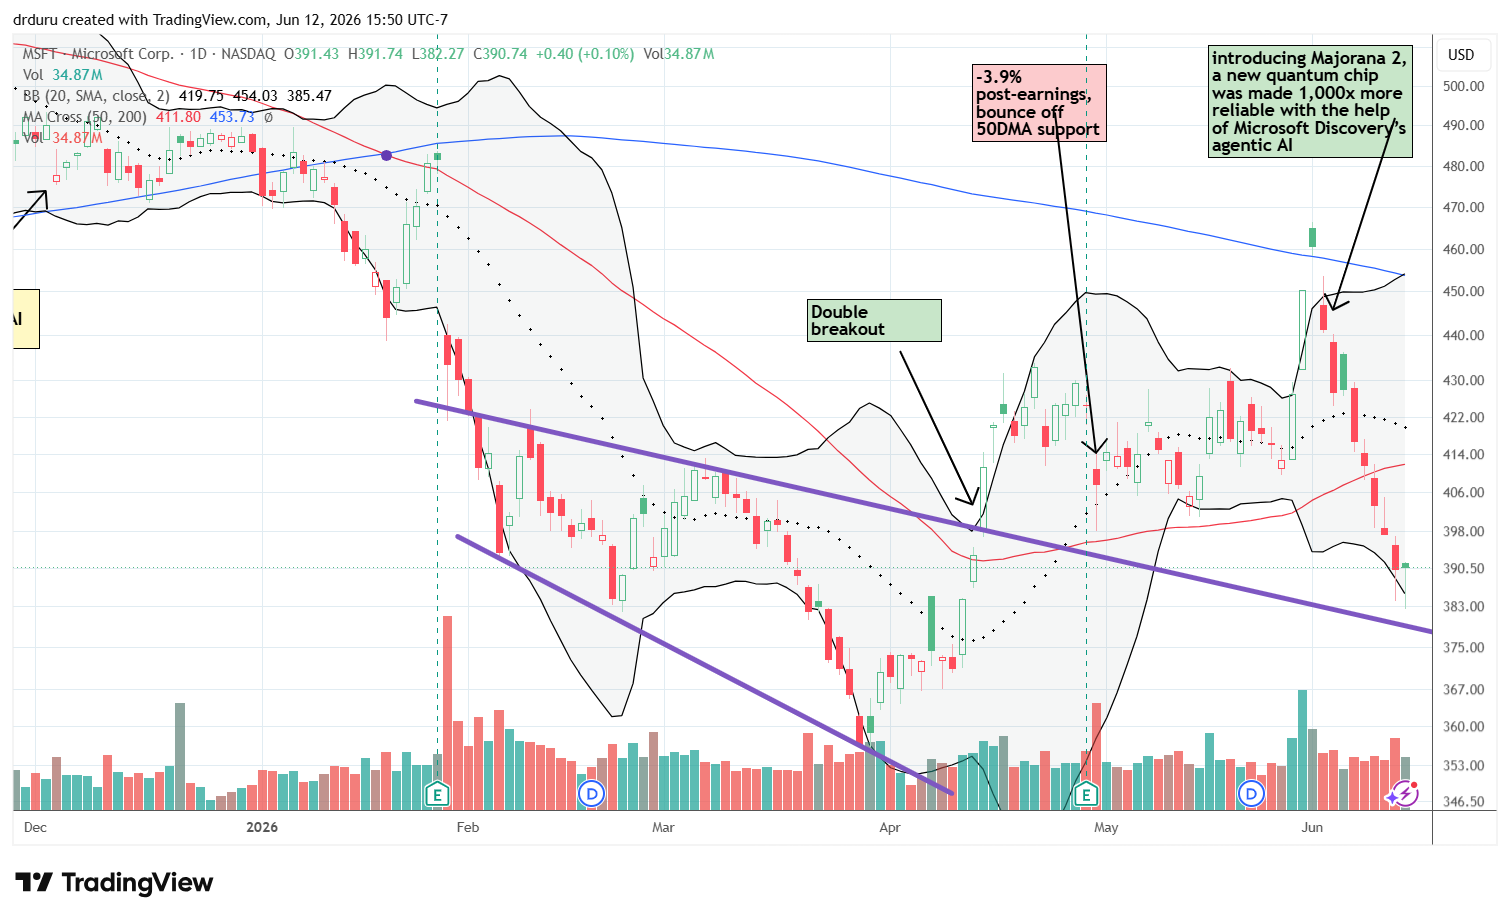
Technical status: Microsoft Corporation (MSFT) turned bearish after breaking below its 50DMA and attempted to hold a final support zone formed from its first breakout from bearish territory.
Trade commentary: At the same time IGV experienced a blow-off top, MSFT printed an abandoned baby top above 200DMA resistance. The topping action was a double whammy given it included a false 200DMA breakout. Like IGV, sellers relentlessly took MSFT down from the top and just barely paused above critical support. MSFT’s next firm support comes from the top of a downward trend that also marked an important breakout for MSFT in April.
Palantir Technologies Inc. (PLTR)
Description: Palantir develops software platforms for data analytics and artificial intelligence applications.
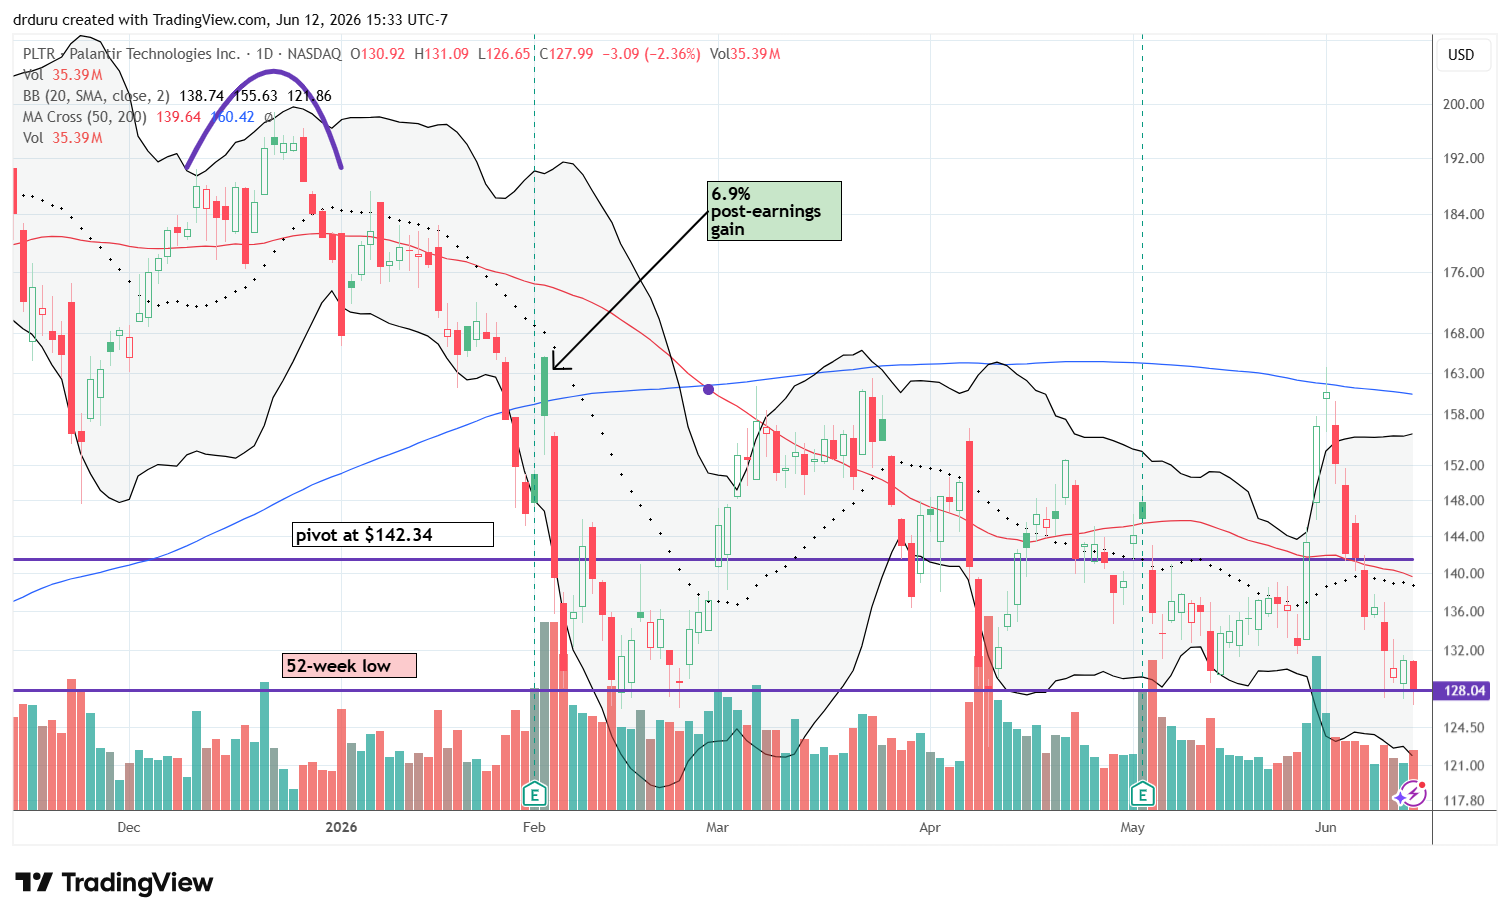
Technical status: Palantir Technologies Inc. (PLTR) hit a 52-week low and is in danger of a major breakdown.
Trade commentary: I cannot imagine technology returning to truly bullish form while PLTR continues selling off. I have my eye on this fall from orbit because the stock is in a very precarious position at a 52-week low. Note how the 200DMA has kept a tight lid over the stock since February, and the $142.34 level continues to serve as an important pivot point.
Oracle Corporation (ORCL)
Description: Oracle provides enterprise software, cloud infrastructure, and database management solutions.
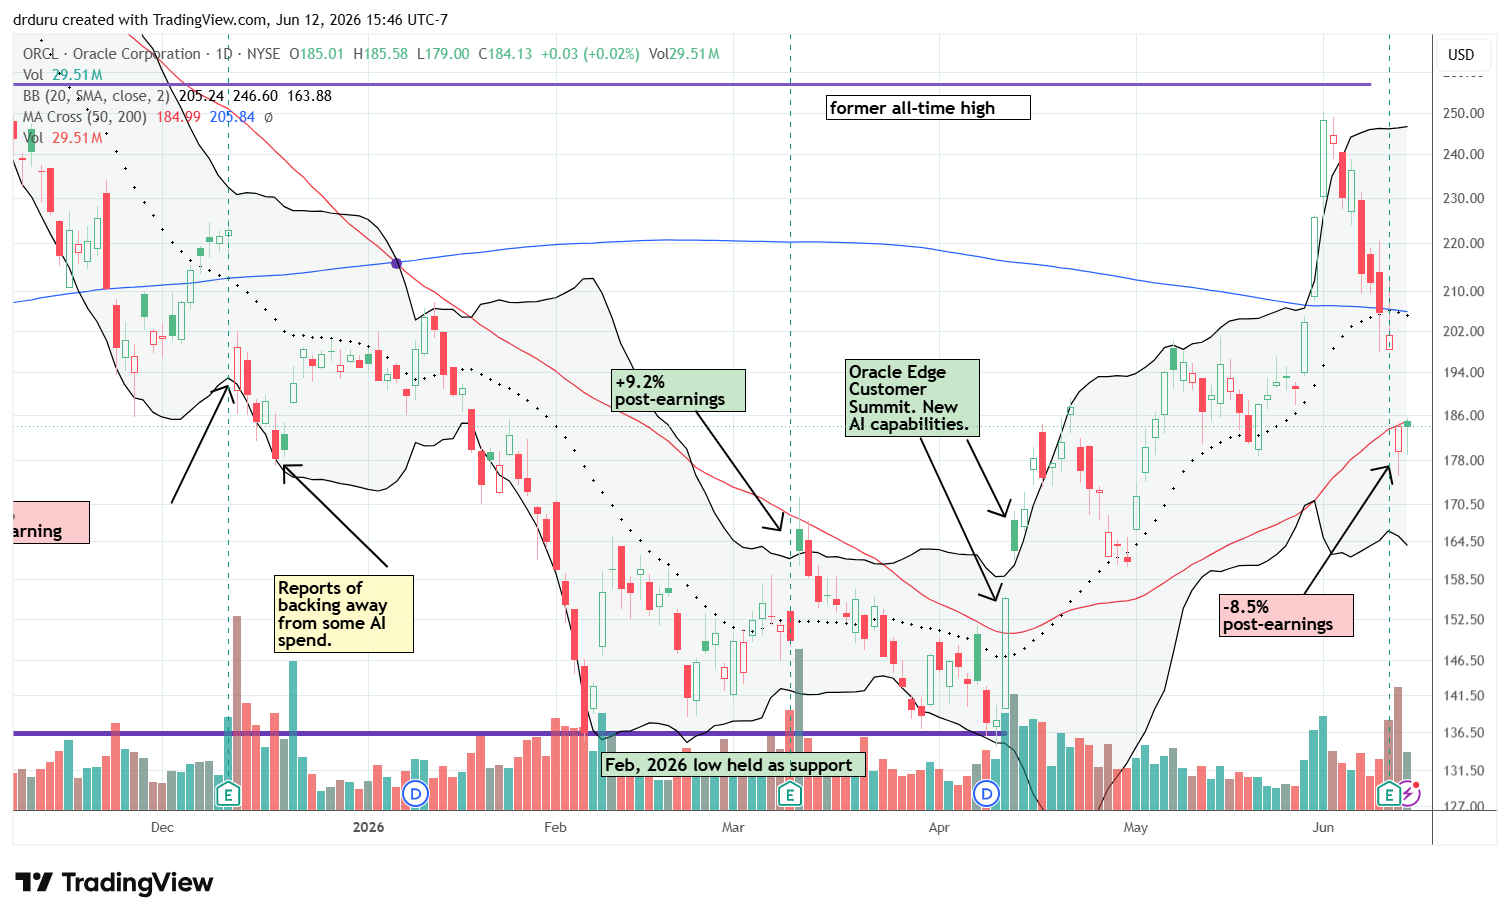
Technical status: Oracle Corporation (ORCL) stalled below its previous all-time high and sliced below its 50DMA after an 8.5% post-earnings loss.
Trade commentary: I would love to buy ORCL again if it regains the 200DMA and confirms another bullish breakout. Until then, I consider the stock bearish with this latest 50DMA breakdown. The stock continues to suffer from a significant period of sobering from last September’s excessive exuberance over a major deal with OpenAI. This latest post-earnings drop looks like it is part of a final shakeout of motivated sellers as ORCL seems to be working hard to correct its AI-driven narrative. However, upside looks capped for now with analysts increasing price targets to $225 through $250 after earnings. For context, ORCL topped out at $345 intraday last year.
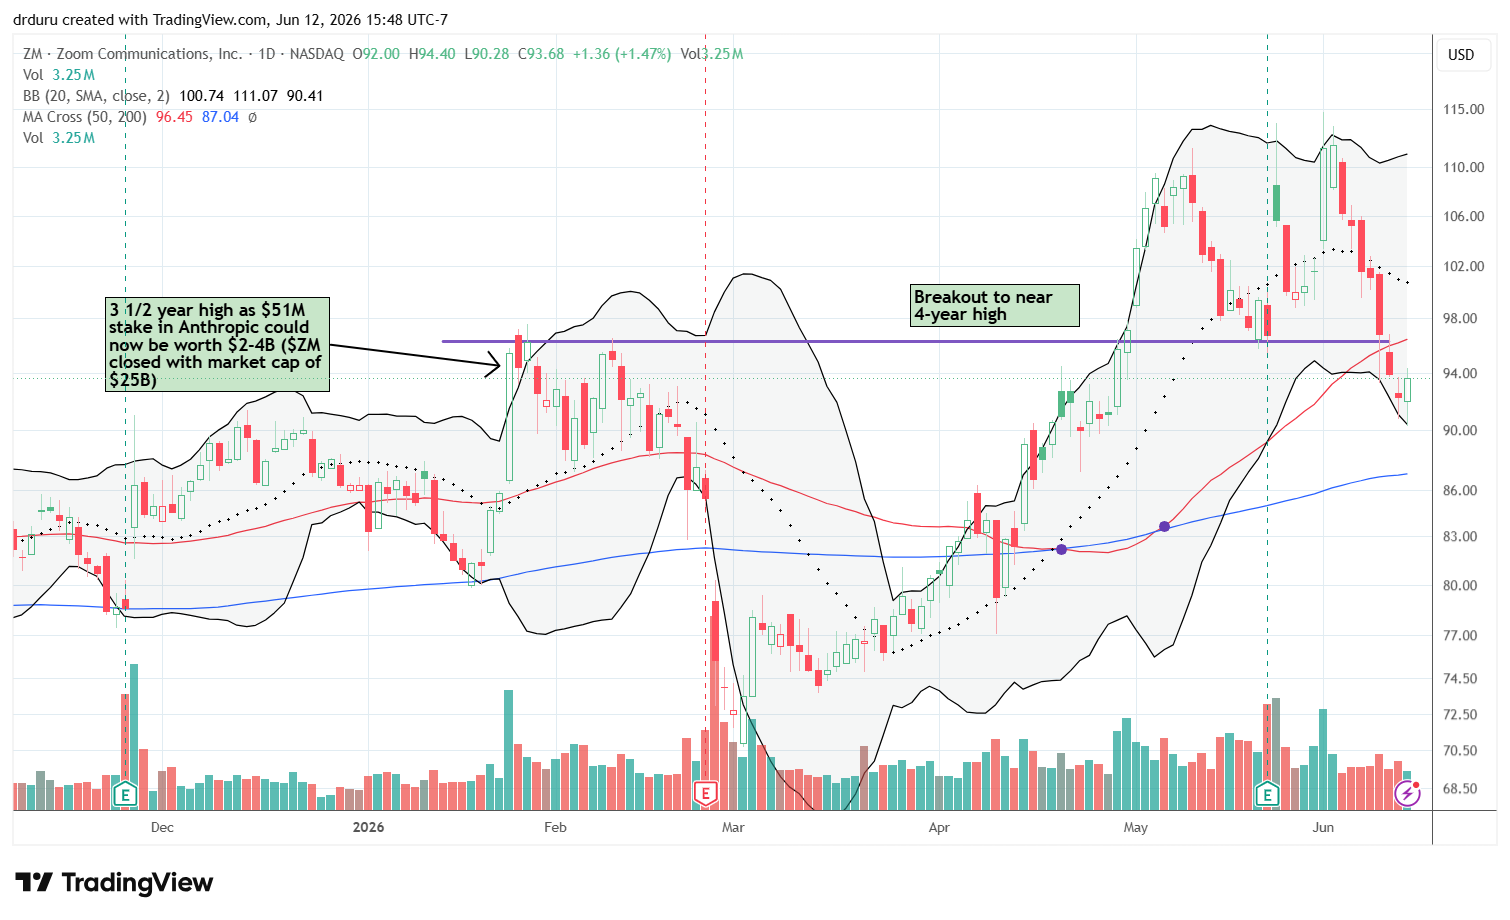
Zoom Communications Inc. (ZM)
Description: Zoom provides video communications and collaboration software services.
Technical status: Zoom Communications Inc. (ZM) lost support from its previous 4-year breakout and fell below its 50DMA to further add to topping technicals.
Trade commentary: I continue to watch ZM closely. If the stock can break out above its 50DMA, I will buy aggressively under the assumption that this time the rally will stay sustained. For now, the stock is back in bearish territory.
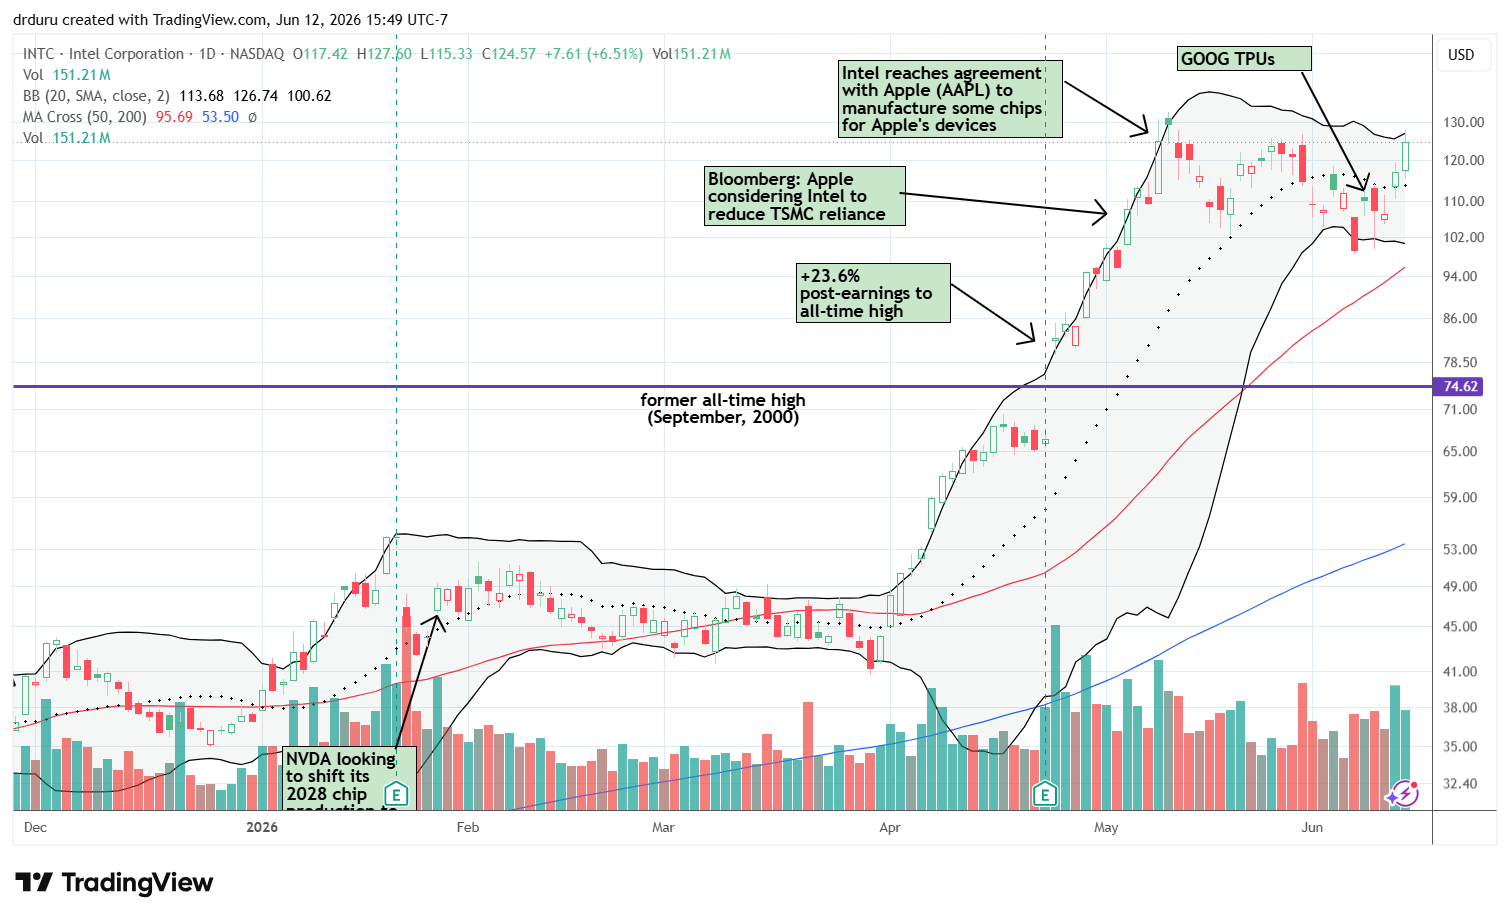
Intel Corporation (INTC)
Description: Intel designs and manufactures semiconductor products and computing technologies.
Technical status: Intel Corporation (INTC) resumed climbing on good news flow and now approaches new highs.
Trade commentary: I have been trading INTC successfully by paying close attention to the news flow and technicals. On Friday, I took profits on a June 110/120 call spread. These trades are like catch-up to my 2026 bullish thesis that found me missing most of the April to May run-up.
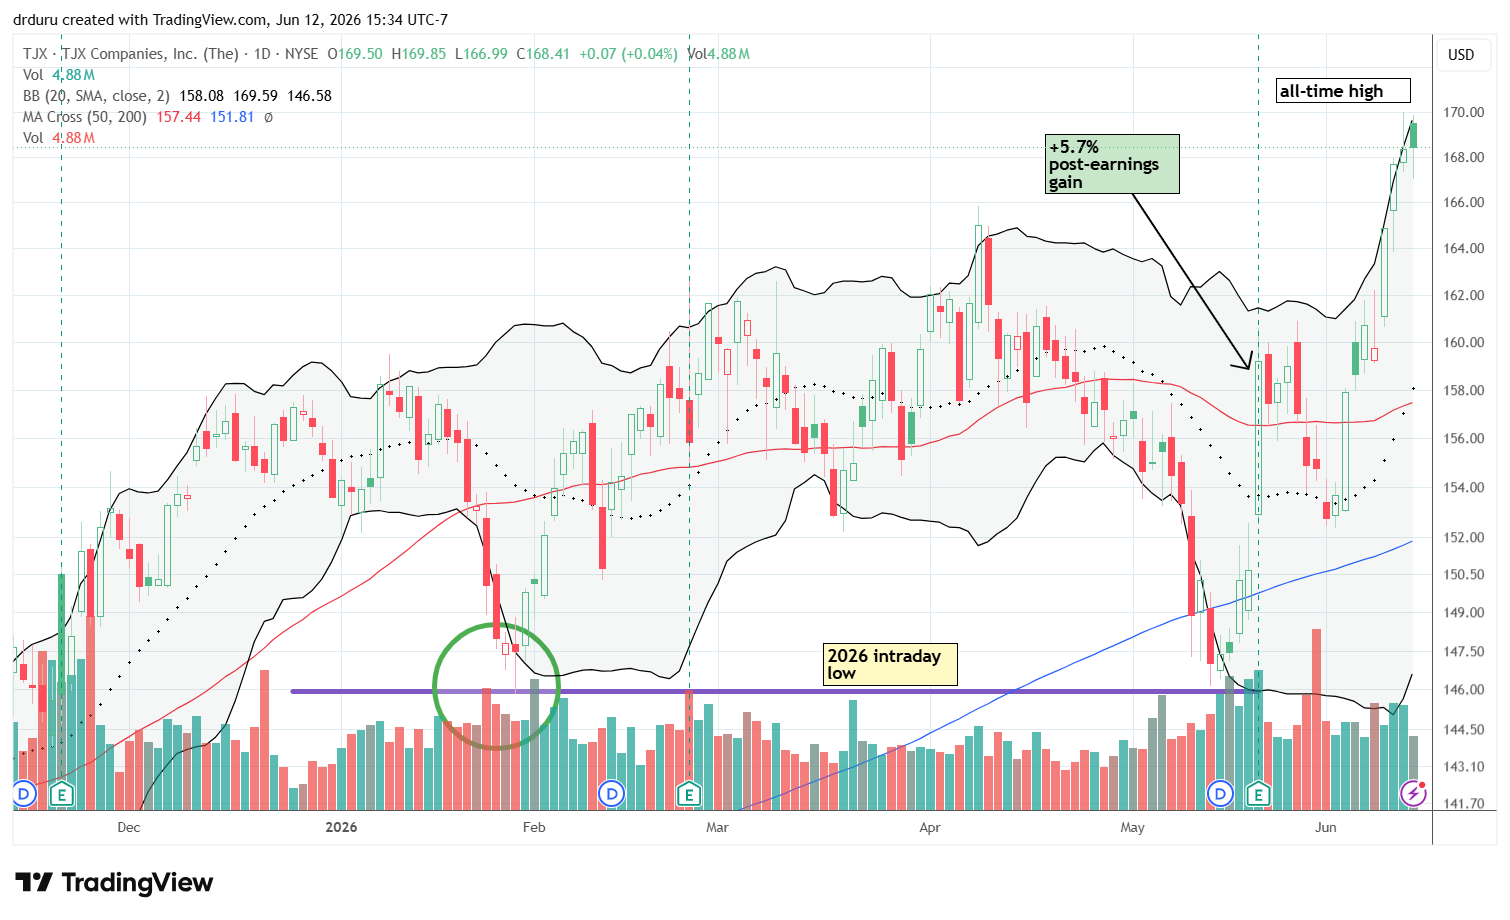
TJX Companies, Inc. (TJX)
Description: TJX operates off-price retail stores including TJ Maxx and HomeGoods.
Technical status: TJX Companies, Inc. (TJX) continued its post-earnings momentum with new all-time highs.
Trade commentary: I view TJX as an important retail indicator. Strong performance from TJX can help lift the broader retail sector. The 5.7% post-earnings gain was a strong signal, and I should have bought stock on the pullback to 20DMA support and prepared to buy more at 200DMA support. TJX has barely looked back since bouncing from 20DMA support. My next target is a pullback to around $166, the former intraday all-time high.
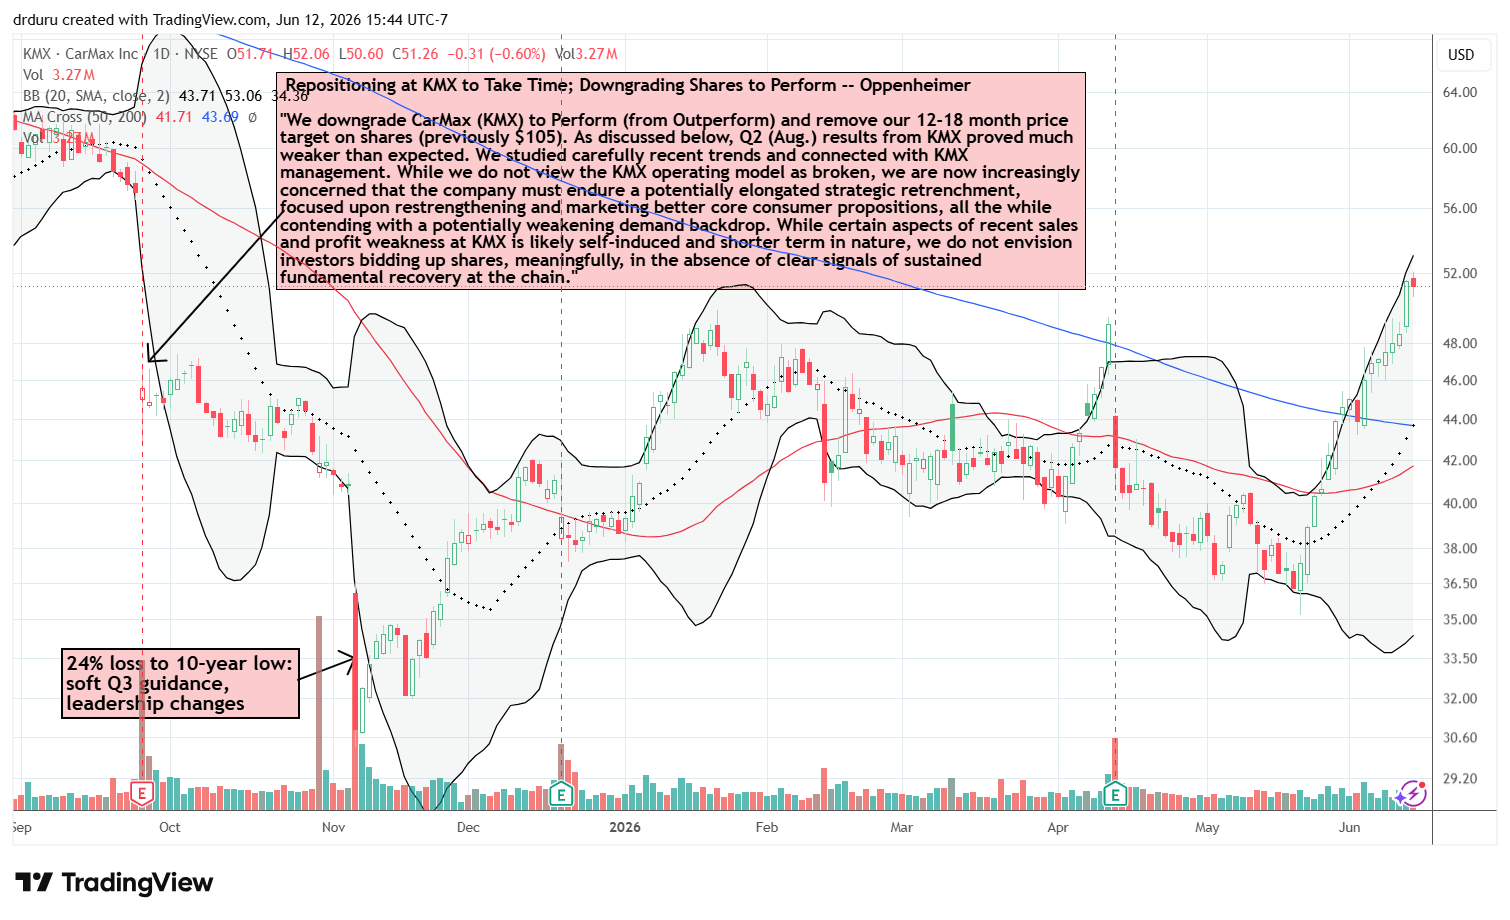
CarMax, Inc. (KMX)
Description: CarMax operates used vehicle retail stores and related automotive services.
Technical status: CarMax, Inc. (KMX) continued making incremental technical improvements with the last 200DMA breakout leading to a 9-month high.
Trade commentary: KMX has been quietly recovering. I want to start accumulating shares because I think the stock can continue grinding higher from its 200DMA breakout. I am good to accumulate down to $44 where KMX’s 20DMA and 200DMA are converging. The captions in the chart below provide context for the stock’s previous collapse.
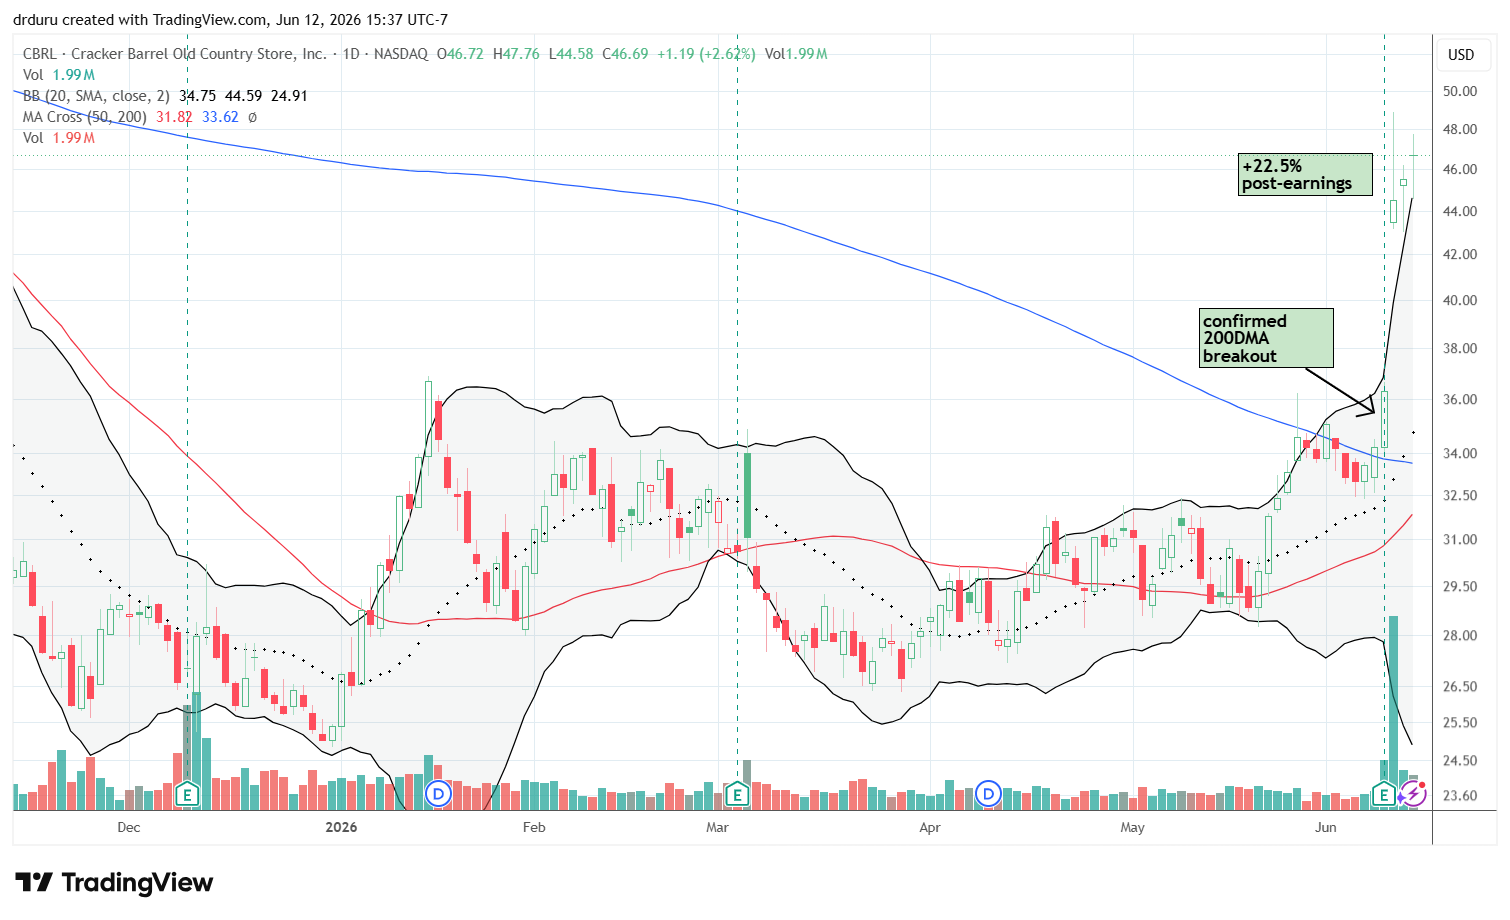
Cracker Barrel Old Country Store, Inc. (CBRL)
Description: Cracker Barrel operates restaurants and retail stores across the United States.
Technical status: Cracker Barrel Old Country Store, Inc. (CBRL) completed a confirmed breakout above its 200DMA following a 22.5% post-earnings gain.
Trade commentary: I missed the pre-earnings confirmed 200DMA breakout but made a no-regret buy post-earnings at $45. I want to aggressively accumulate stock to as low as $40 or so if the market delivers the opportunity. CBRL is in the middle of a classic bearish to bullish reversal as the old wounds from the logo drama fade further and further into the market’s memories.
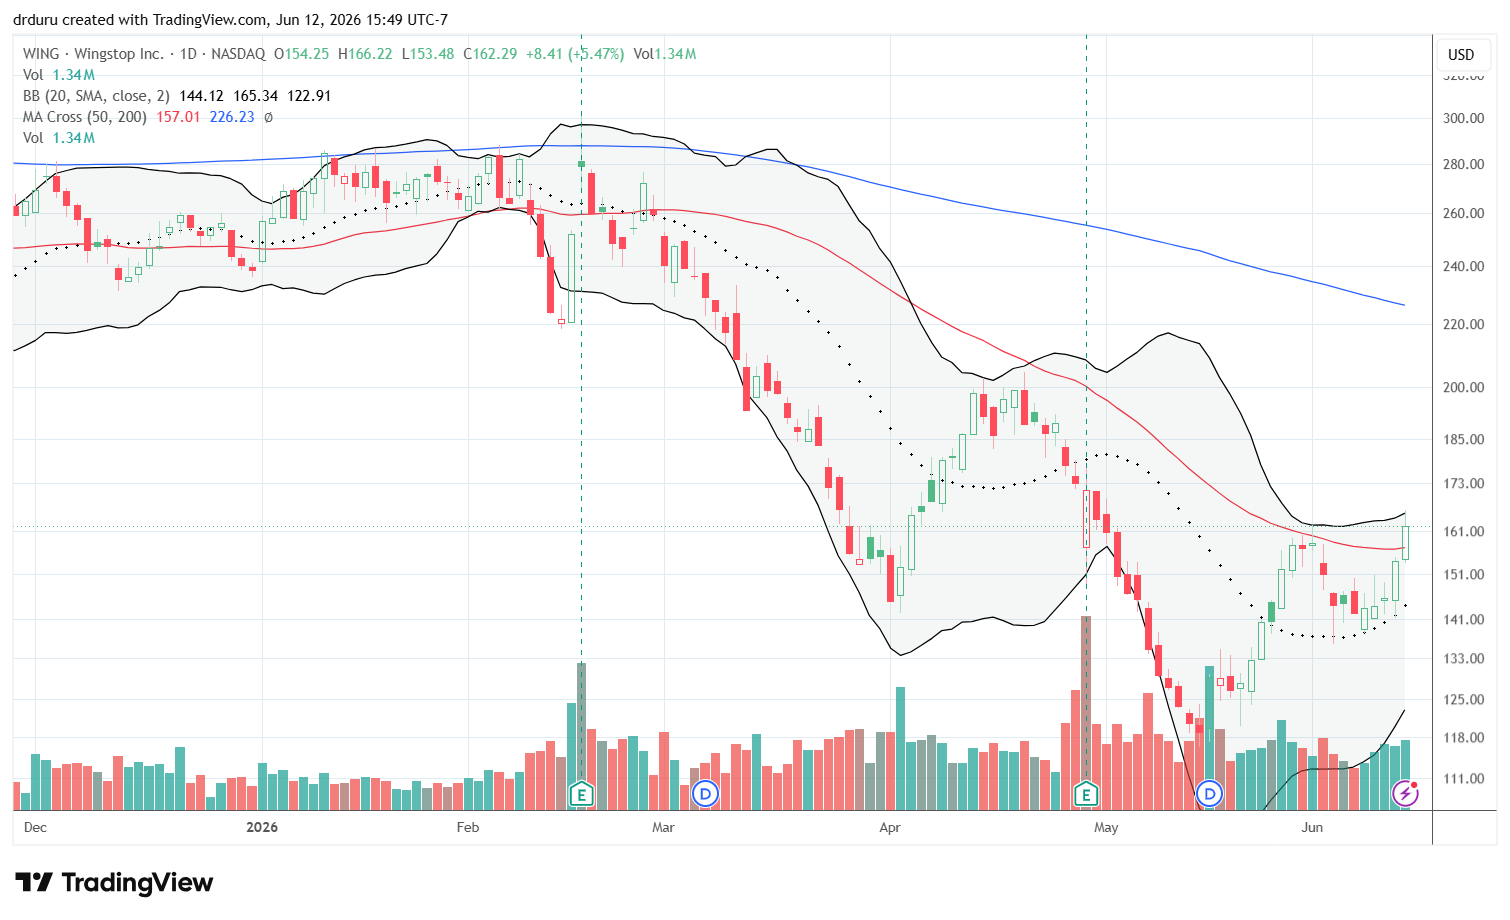
Wingstop Inc. (WING)
Description: Wingstop franchises and operates restaurants specializing in chicken wings.
Technical status: Wingstop Inc. (WING) broke above 50DMA resistance for the first time in 4 months. An uptrending 20DMA supports a sustained push higher.
Trade commentary: If WING delivers another gain from Friday’s close, I will start buying the stock. I have noticed the market rotating into beaten-down consumer-facing names, and WING appears to be participating in that trend. I am targeting upside to 200DMA resistance.
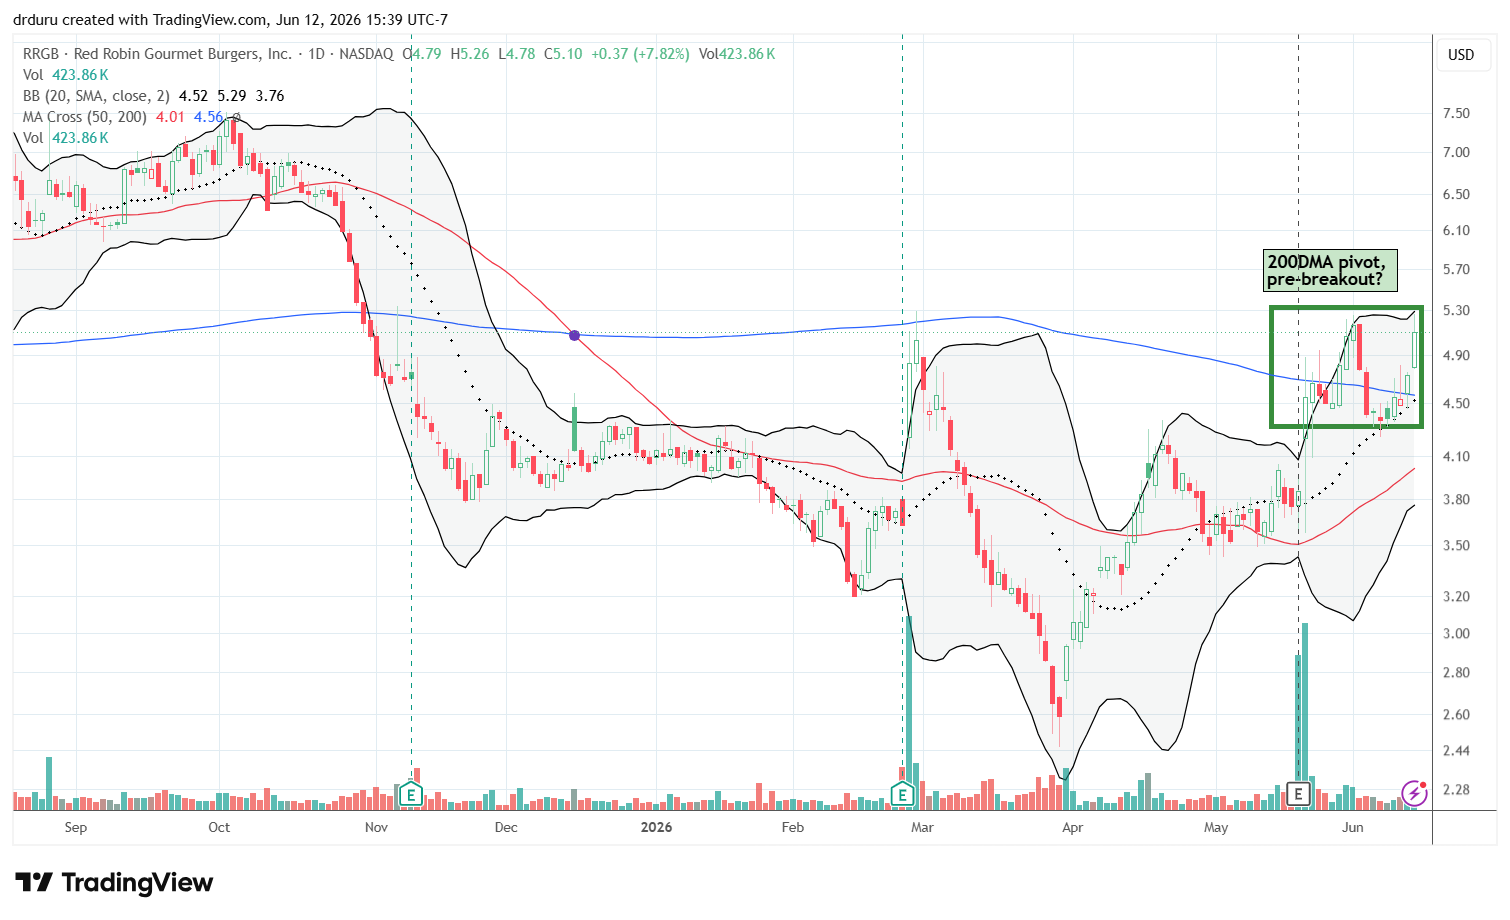
Red Robin Gourmet Burgers, Inc. (RRGB)
Description: Red Robin operates casual dining restaurants focused on burgers and related menu offerings.
Technical status: Red Robin Gourmet Burgers, Inc. (RRGB) pivoted around its 200DMA and appears ready to break out.
Trade commentary: I have watched RRGB more closely ever since its first 200DMA breakout in late May. I believe RRGB could have significant upside if the recovery continues. Thus, I started buying on Friday’s confirmation of a second 200DMA breakout. Note the stock has already rebounded significantly from all-time lows and faded from the previous peak, so I expect a choppy path ahead.
Footnotes
Subscribe for free to get email notifications of future posts!
“Above the 50” (AT50) uses the percentage of stocks trading above their respective 50-day moving averages (DMAs) to measure breadth in the stock market. Breadth defines the distribution of participation in a rally or sell-off. As a result, AT50 identifies extremes in market sentiment that are likely to reverse. Above the 50 is my alternative name for “MMFI” which is a symbol TradingView.com and other chart vendors use for this breadth indicator. Learn more about AT50 on my Market Breadth Resource Page. AT200, or MMTH, measures the percentage of stocks trading above their respective 200DMAs.
Active AT50 (MMFI) periods: Day #224 over 20%, Day #51 over 30%, Day #47 over 40%, Day #2 over 50% (overperiod), Day #24 under 60%, Day #197 under 75%
Source for charts unless otherwise noted: TradingView.com
Full disclosure: long IWM shares, long IGV, long MARS, long CBRL
FOLLOW Dr. Duru’s commentary on financial markets via StockTwits, BlueSky, and even Instagram!
*Charting notes: Stock prices are not adjusted for dividends. Candlestick charts use hollow bodies: open candles indicate a close higher than the open, filled candles indicate an open higher than the close.
* Blog notes: this blog was partially written based on the heavily edited transcript of the following video that includes a live review of the stock charts featured in this post. I used ChatGPT to process the transcript.