

The Market Breadth Summary
- AI infrastructure stocks power away from bearish market breadth as the S&P 500 and NASDAQ hit fresh all-time highs.
- Market breadth remains bearish, with AT50 fading below overbought territory and AT200 still moving sideways.
- Semiconductor, AI infrastructure, and select AI-related software stocks drive momentum while consumer-facing and financial stocks lag.
- The trading call remains neutral because index strength is powerful but breadth, volatility, and sector divergence still warn of imminent risk.
Stock Market Commentary
The dynamics of this stock market are simple. AI infrastructure stocks are soaring well ahead of the competition and their peers. The rest of the market is getting left behind. Market breadth is going nowhere and remains in bearish territory, but the indices are being powered higher by the AI narrative all over again. There is no point in trying to predict the ending to what has become a fresh mania for AI infrastructure stocks. Momentum is a friend as AI infrastructure stocks power away from bearish market breadth.
There are all kinds of macroeconomic and geopolitical developments happening, but the AI infrastructure narrative is drowning out almost everything else. Friday’s jobs report was generally positive with a steady unemployment rate and the creation of 109K jobs. The report seemed good enough to send the S&P 500 and the NASDAQ to fresh all-time highs. The war against Iran has receded even further into the background. Oil prices remain elevated, but I am not seeing the market react to war headlines. Thus, the main message from the market is to follow the momentum as long as it lasts.
The Stock Market Indices
S&P 500 (SPY)
In the last Market Breadth, I pointed out how the S&P 500’s fade that Friday could turn bearish: “A gap down on Monday would make Friday look like a blow-off. Even a lower close could create such a pattern.” The index did not gap down, but it still lost 0.4%. I was ready to trade on a blow-off top, but buyers rushed back into the S&P 500 the next day with a gap higher, a 0.8% gain, and an all-time high. Talk about trapping the sellers and the bears! That mini-episode served as a handy reminder of the aggressiveness of the market’s buyers.
The insatiable buying only paused because the market closed on time on Friday. The S&P 500 ended the week with an all-time high and 2.3% gain for the week. Given the strong momentum, the index’s close at its upper Bollinger Band (BB) (the black line below) could signal the start of an accelerated ramp. I find it hard to accept that the index still has sufficient buying power to ramp higher from here, but mid-April’s sprint along the upper-BB is recent proof of what remains possible in this market.
")
NASDAQ (COMPQ)
Tech stocks are a significant driver of the S&P 500’s ability to power away from bearish market breadth. The NASDAQ continued powering higher and remained even stronger than the S&P 500. It pushed above its upper-BB and closed the week with an impressive 4.5% gain for the week. While the tech-laden index looks extended, I defer to the bullish price action which is in a mode of relentless momentum. However, this week I am targeting a pairs trade with QQQ puts and SPY calls as a bet on a big move up or down in the coming two weeks. A bearish change in sentiment at these levels could generate abrupt and sharp selling pressure.
")
iShares Russell 2000 ETF (IWM)
IWM hit an all-time high during the week, but the rally stalled abruptly after a sharp 1.6% pullback on Thursday. I saw no news to explain the sudden under-performance, so I am assuming profit-taking snowballed. Despite the complete reversal of the previous day’s gap higher, I jumped into a fresh call option trade on IWM. The short side of my weekly $290 calendar call spread expired. I also used the dip to buy shares. It is already time to go back to accumulation mode. From here, I will add more shares on a test of 20DMA and 50DMA support.

The Short-Term Trading Call As AI Stocks Power Away
- AT50 (MMFI) = 63.1% of stocks are trading above their respective 50-day moving averages
- AT200 (MMTH) = 56.3% of stocks are trading above their respective 200-day moving averages
- Short-term Trading Call: neutral
AT50 (MMFI), the percentage of stocks trading above their respective 50DMAs, closed the week at 63.1%. My favorite technical indicator remained below the overbought threshold of 70% and faded after briefly reaching approximately 67%. This second fade underneath the overbought threshold created a signal of exhaustion for AT50. Thus, I am on alert for imminent market weakness (one reason for my interest in the short QQQ vs long SPY pairs trade).
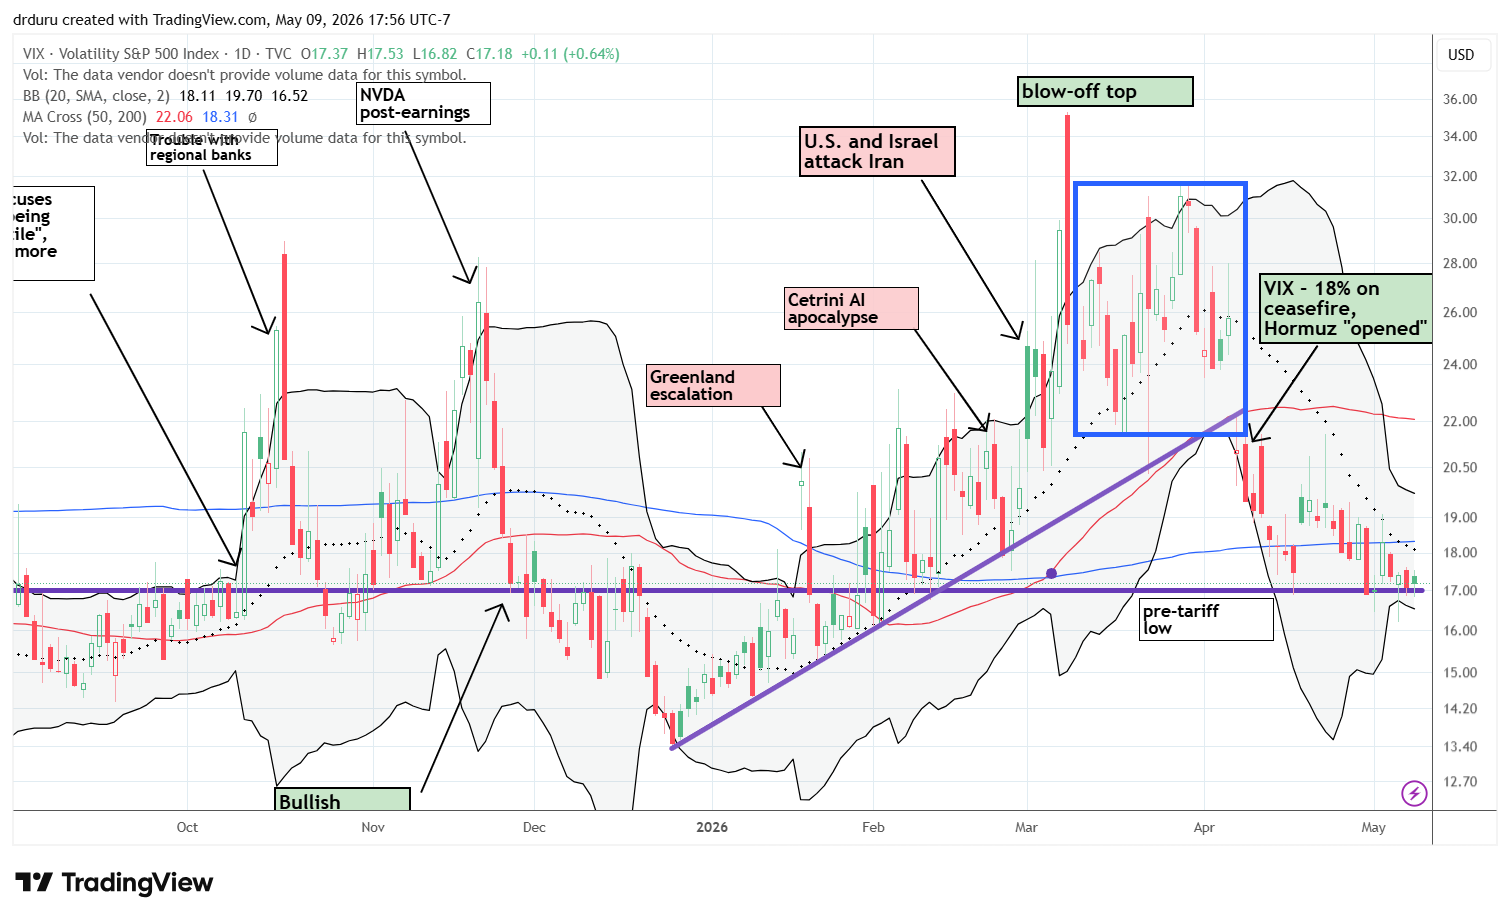
Remember how AT50’s double fade from the overbought threshold in January was part of the topping action in the S&P 500 and the NASDAQ. The U.S. and Israel war against Iran was the catalyst that unleashed the motivated sellers. This time is different in that the sellers look too weak to constrain the upward pressure in prices in the indices. AI infrastructure stocks in particular are relentlessly climbing fears of capacity constraints and helping to feed bullish price action in the NASDAQ and the S&P 500.
")
AT200, the percentage of stocks trading above their respective 200DMAs, continued its sideways trading. This indicator of the long-term health in market breadth is stuck in neutral, just like my short-term trading call.
")
The volatility index (VIX) is displaying its own form of stubbornness. The line marking the VIX’s level right before last year’s tariff drama, trauma, and noise continues to hold as firm support. Despite the relentless rise in the major indices, the VIX never once closed below this line. The VIX is acting like one of the few parts of the financial market keeping an eye on developments in the Middle East. This resilience in the VIX gives me yet one more reason to try a short QQQ vs long SPY pairs trade. A move from this line could be explosive….to the upside or the downside.
In case you missed it…
Intel Corporation (INTC) caught my attention all week. I started with a review of the positive news flow that led to INTC’s breakout to its first all-time high in 26 years. I next made a case for INTC rallying even higher from current levels based on the potential for analysts racing to catch up the company’s bullish news flow. In the meantime, I am STILL waiting for good risk/reward entry. INTC is one of the many AI-related stocks powering away from bearish market breadth.
The Stocks and ETFs
VanEck Semiconductor ETF (SMH)
Description: VanEck Semiconductor ETF (SMH) is an exchange-traded fund that tracks companies involved in semiconductor production and equipment.
Technical status: VanEck Semiconductor ETF (SMH) persistently rose upwards throughout the weeks, hitting all-time highs along the way.
Trade commentary: SMH completely captured the AI infrastructure narrative last week. Semiconductor stocks have become the stars of the market and are powering the indices higher. The move has been so strong that traders almost have to jump straight into momentum because there have been very few pullbacks.
")
SanDisk Corporation (SNDK)
Description: SanDisk Corporation (SNDK) develops and manufactures flash storage and memory technology products.
Technical status: SanDisk Corp (SNDK) closed out the week with a 16.6% jump, continuing its gradual uptrend and reaching new all-time highs.
Trade commentary: SNDK has become one of the clearest examples of the mania surrounding AI infrastructure. The stock rallied 16.6% on Friday alone after posting additional huge gains earlier in the week. Capacity constraints and a scramble for supply are driving incredible momentum in these AI-related infrastructure names.
")
Advanced Micro Devices (AMD)
Description: Advanced Micro Devices (AMD) designs semiconductors and computing processors for data centers, personal computers, gaming, and embedded systems.
Technical status: Advanced Micro Devices Inc (AMD) surged 18.6% post-earnings and gained another 11.4% to close out the week at an all-time high.
Trade commentary: AMD has entered what I consider rip territory. The OpenAI deal from October 2025 once looked overly ambitious when AMD traded around $213, but now the market has finally embraced the story. AMD has doubled since then and is now just a 31% gain away from hitting the final vesting target of $600. Thus, OpenAI should be able to start selling AMD shares under the terms of the partnership deal. I will be looking for a sudden increase in selling volume as a potential indicator that OpenAI decided to lock in some of its profits.
In the meantime, I can only marvel at the run-up since April’s breakout to a new all-time high….and lament that 1) the market shook me out of my sizable position with November’s 50DMA breakdown, and 2) I did not reload on the successful test of 200DMA support in March. I should have even bought the breakout.
")
Akamai Technologies (AKAM)
Description: Akamai Technologies (AKAM) provides cloud services, cybersecurity solutions, and content delivery network infrastructure.
Technical status: Akamai Technologies Inc (AKAM) exploded higher following earnings and news of a major computing deal with Anthropic, surging to levels not seen since the dot-com era.
Trade commentary: AKAM made a massive move that few traders could have predicted after the weakness earlier in April when AKAM got caught up in the AI Panic of the moment, the release of Anthropic’s Mythos under Project Glasswing. Akamai’s CEO appeared on CNBC and talked up the bullish prospects for the company. Most importantly, he observed that the company has been undervalued for a long time. I agree.
")
Fastly (FSLY)
Description: Fastly (FSLY) provides edge cloud computing and content delivery network services.
Technical status: Fastly Inc (FSLY) broke down below its 50DMA after a 38% post-earnings tumble, dropping down to its lower Bollinger Band.
Trade commentary: FSLY enjoyed an impressive resurgence after its 72% post-earnings again in February. I first bought shares on February 24th fully intending to accumulate more shares on further weakness. The stock continued higher from there, and I took profits when the stock stalled on March 4. From there I watched in amazement as buyers ramped the stock throughout the month despite market concerns about the Iran war. When the AI Panic about Mythos took FSLY down to its 50DMA support, I bought after support was confirmed with two higher closes. I took profits as FSLY surged 17.7% a day before earnings. I did not want to risk the profits.
FSLY’s post-earnings drop to a 2-month low makes it vulnerable to a test of 200DMA support. I will be a buyer on a successful test of that support level.
")
Datadog (DDOG)
Description: Datadog (DDOG) provides cloud monitoring and analytics software for developers and information technology operations teams.
Technical status: Datadog Inc (DDOG) soared 31% post-earnings and tested its previous high with an extension far above the upper Bollinger Band.
Trade commentary: On May 1st, DDOG delivered the exact kind of 200DMA breakout I normally love to buy, but upcoming earnings kept me from taking the trade. I now consider DDOG a buy-the-dip stock from here rather than a chase candidate. The stock market seems to be appreciating a wider range of companies that are important to AI infrastructure. In its earnings conference call, Datadog noted “Our AI native customers cohort continue [sic] to grow and diversify rapidly, both in the number of customers we serve and the scale of those customers. In this quarter, including new land deals with 2 of the world’s biggest AI research teams, helping them improve and optimize their training workflows.”
DDOG’s surge is quite the 180-degree contrast to the double sell-offs the stock suffered during the AI Panics in February and April.
")
iShares Expanded Tech-Software Sector ETF (IGV)
Description: iShares Expanded Tech-Software Sector ETF (IGV) tracks U.S. software and technology companies.
Technical status: The iShares Expanded Tech-Software Sector ETF (IGV) confirmed converged 20DMA and 50DMA support, rising back to its upper Bollinger Band.
Trade commentary: IGV is beginning a classic bearish-to-bullish reversal. I remain a major contrarian on software stocks, and last week strongly supported that thesis as buyers pushed into IGV all week on strong volume.
")
JFrog Ltd. (FROG)
Description: JFrog Ltd. (FROG) provides software supply chain and DevOps platform tools for enterprise software development.
Technical status: JFrog Ltd (FROG) surged 23.7% post-earnings after recovering from a major selloff earlier in the year, reaching its highest point since 2022.
Trade commentary: FROG was a major victim of a major AI Panic related to Claude Code Security on February 20. The sell-off made zero sense to me, so I sold a put option. The stock’s push higher from there demonstrated I was not aggressive enough in my contrarian attitude to the stampeding panic. The company announced a $300M stock repurchase program a few days later and essentially never looked back from there.
Like DDOG, FROG generated a bullish 200DMA breakout that I love to buy, but upcoming earnings kept me on the sidelines. Now, I can only wait for the next dip…or AI Panic. However, I doubt another severe panic will occur anytime soon. The company noted in its earnings conference call that its software is critical AI infrastructure. The surge in AI-generated code is good for business: “Our customers tell us they are accelerating software development and generating more binaries through the JFrog platform. As AI adoptions expand, JFrog provides a unified system of record to secure, govern and manage AI-generated open source or legacy binaries in one place. Our customers’ adoption, Q1 results, sales pipeline and future road map innovation are aligned with these observations. Looking ahead, we expect security to remain a key growth driver for JFrog.”
")
Palo Alto Networks (PANW)
Description: Palo Alto Networks (PANW) provides cybersecurity platforms and cloud security services.
Technical status: Palo Alto Networks Inc (PANW) broke out above its 200DMA, surging toward its previous highs.
Trade commentary: The sell-off in cybersecurity stocks from the Mythos AI Panic was yet another episode that bewildered me. However, the pullback was a golden moment for demonstrating the power of my PAIROS analytical framework and for loading up on PANW shares. The stock’s 200DMA breakout last week was the latest confirmation that the selling in PANW was overdone.
")
Cloudflare (NET)
Description: Cloudflare (NET) provides cloud networking, cybersecurity, and internet performance services.
Technical status: Cloudflare Inc (NET) rose to a new high for the year before crashing below its 50DMA and 200DMA post earnings, suffering a 23.6% drop.
Trade commentary: Like FSLY, NET was one of the infrastructure software stocks that fared poorly last week. I remain skeptical of companies publicly celebrating AI-driven layoffs, so I was intrigued by the punishment NET took after reporting earnings and a 20% reduction in workforce largely driven by AI efficiencies. I believe AI will ultimately augment businesses rather than simply eliminate workers.
The stock is in a precarious place thanks to this major setback. NET is stuck in a near year-long trading range and closed below its former all-time high of $212 from November, 2021. The technicals and price action suggest traders are growing increasingly skeptical and/or wary. NET is quite expensive trading at 29x sales, 165x forward non-GAAP earnings, and a 4.2 PEG ratio (non-GAAP). So, I expect the stock to remain stuck for quite some time despite its promising business in forcing AI-driven scrapers to pay for access to content.
")
CDW Corporation (CDW)
Description: CDW Corporation (CDW) provides information technology hardware, software, and services for businesses, government agencies, and healthcare organizations.
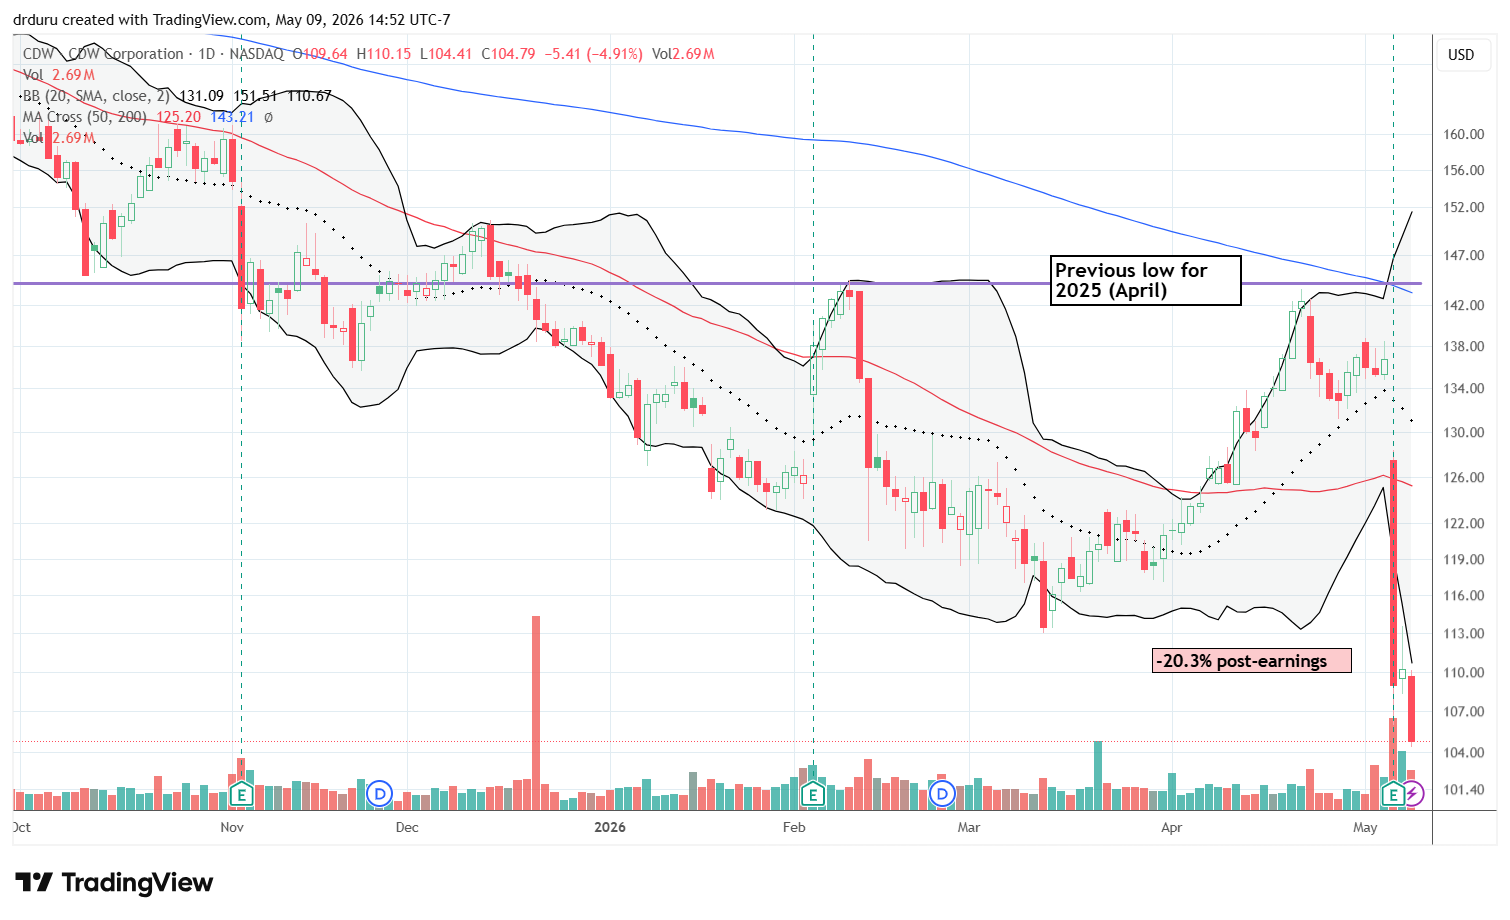
Technical status: CDW Corporation (CDW) continued a long-term downtrend after collapsing 20.3% on earnings and extending losses with a 4.9% loss on Friday to a 6-year low.
Trade commentary: CDW highlighted the widening divergence in this market between tech winners and losers. I have never found a low-risk short setup here, but the stock continues grinding lower. Ironically, CDW tried to position themselves as a beneficiary of investment in AI infrastructure: “Excellent top line performance reflected agility both in securing supply and capturing demand for AI investment and ongoing infrastructure modernization.” I used Gemini to review the earnings transcript and help me identify why investors reacted once again so poorly to CDW’s report (ChatGPT had an unexplained bug at the time of writing that prevented me from doing the analysis). I asked for a concise explanation:
“While CDW reported top-line growth, the market’s severe reaction was likely driven by a combination of margin compression, shifting demand toward lower-profitability hardware, and a cautious outlook for the latter half of 2026.
Significant Margin Contraction
The primary concern was the erosion of profitability despite higher sales:
- Gross Margin Decline: Gross margin fell 60 basis points to 21%. This was largely due to a lower mix of “netted down revenues” (high-margin items like SaaS, cloud, and warranties).
- Operating Margin Pressure: Non-GAAP operating income margin dropped 50 basis points to 8%.
- Rising Expenses: Non-GAAP SG&A expenses surged 8.8% year-over-year. Management noted this was due to seasonal patterns and investments in AI tools and training.
The “AI Hardware” Trap
While AI is a massive buzzword, for CDW, it currently translates to a less profitable product mix:
- Low-Margin Volume: Customers prioritized infrastructure hardware (networking, servers, and storage) to secure supply and beat price increases in memory.
- Slowing Cloud & Services: Higher-margin software assurance and warranties became lower priorities. Cloud spend growth, though still healthy, slowed as customers diverted budgets to hardware.
- Shipment Delays: Despite strong demand, shipment delays and supply friction resulted in an elevated backlog entering the second quarter.
Future Uncertainty and Restructuring Costs
The report introduced new variables that may have signaled instability to investors:
- Back-Half Caution: Management maintained a “prudent view of uncertainty” for the second half of 2026, citing potential “wildcards” like recessionary conditions or geopolitical risks.
- “Geared for Growth” Initiative: CDW announced a multi-year restructuring program to rewire its operating model. While it targets $100 million to $200 million in savings by 2027-2028, it requires significant near-term investment and adds execution risk.
The Geared for Growth Initiative caught my attention. If the company can execute then this latest sell-off could mark the final purge of motivated sellers. I have set a price alert on the stock at $115. I will consider buying the stock above that level given it would mark the beginnings of fresh interest with the stock above a former multi-year low.
Yelp Inc. (YELP)
Description: Yelp Inc. (YELP) operates an online platform for local business reviews and advertising services.
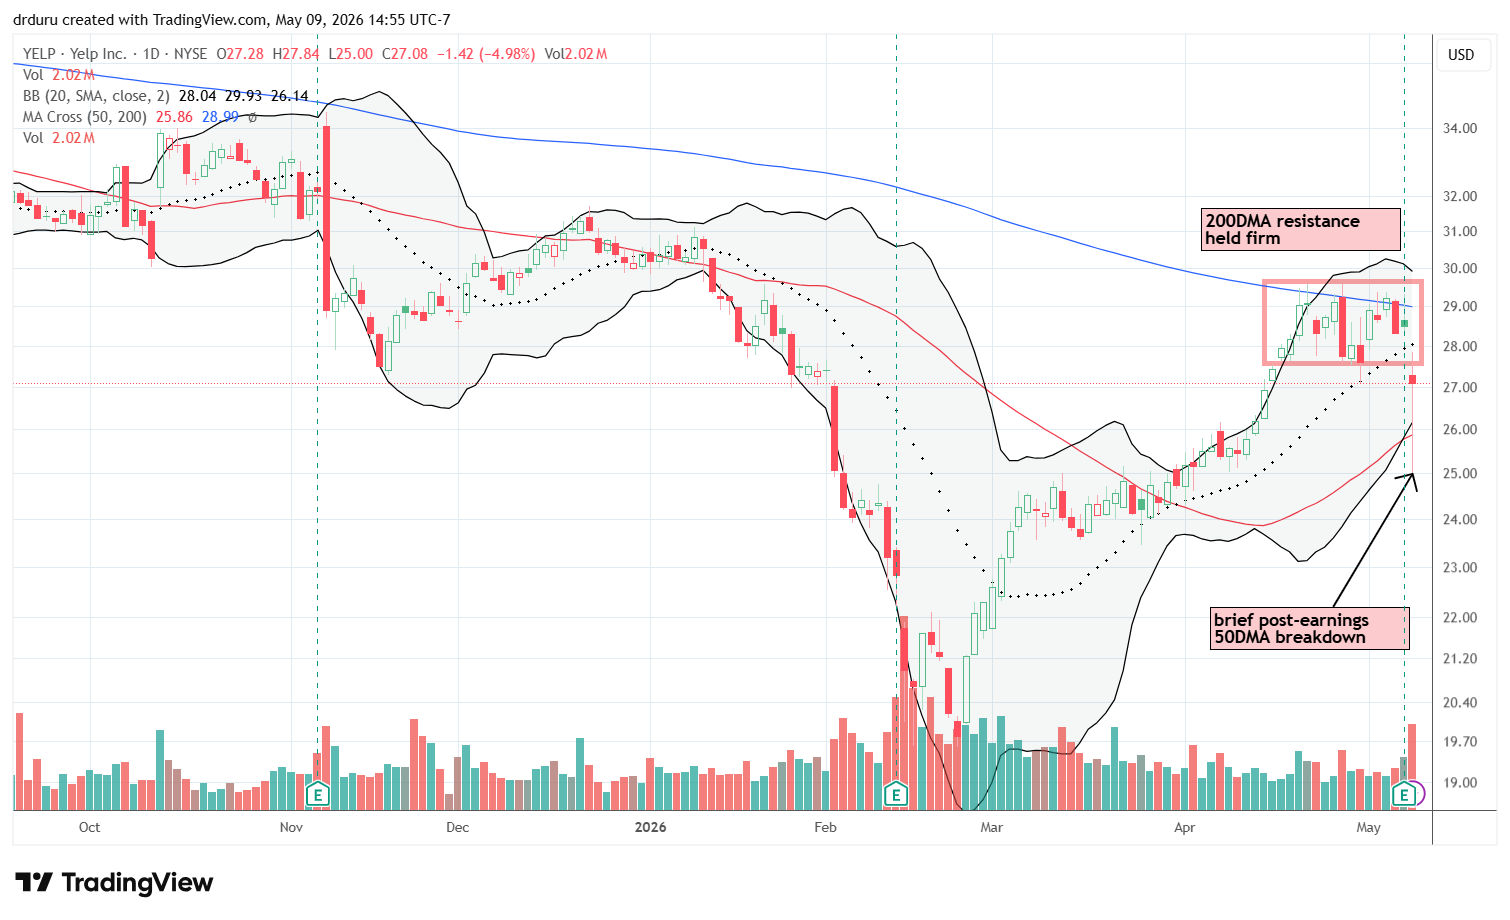
Technical status: Yelp Inc. (YELP) failed at resistance near the 200DMA and then fell 5.0% post-earnings after recovering from a 50DMA breakdown.
Trade commentary: YELP remains on my buy list. If the stock can recover its post-earnings losses and close above its 200DMA, I will consider it to be in the middle of a major recovery.
Toast, Inc. (TOST)
Description: Toast, Inc. (TOST) provides cloud-based restaurant management and payment processing software.
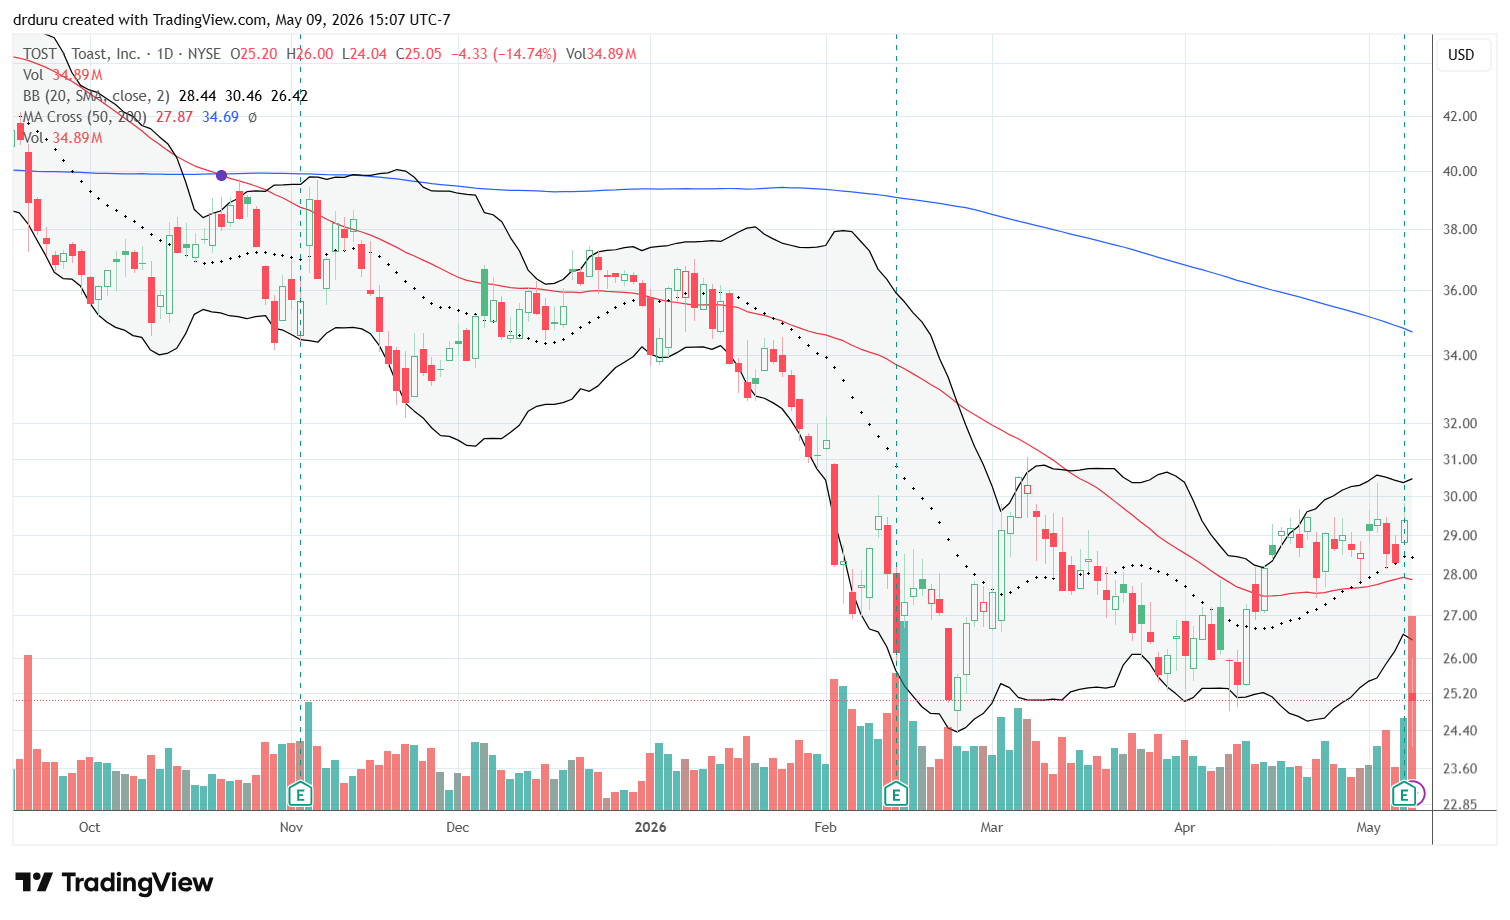
Technical status: Toast, Inc. (TOST) dropped 14.7% after earnings. The stock has gone nowhere in 4 years.
Trade commentary: TOST reflected the growing weakness in consumer-facing discretionary stocks, especially companies tied to restaurant spending. I have no interest in buying this stock, even for speculation.
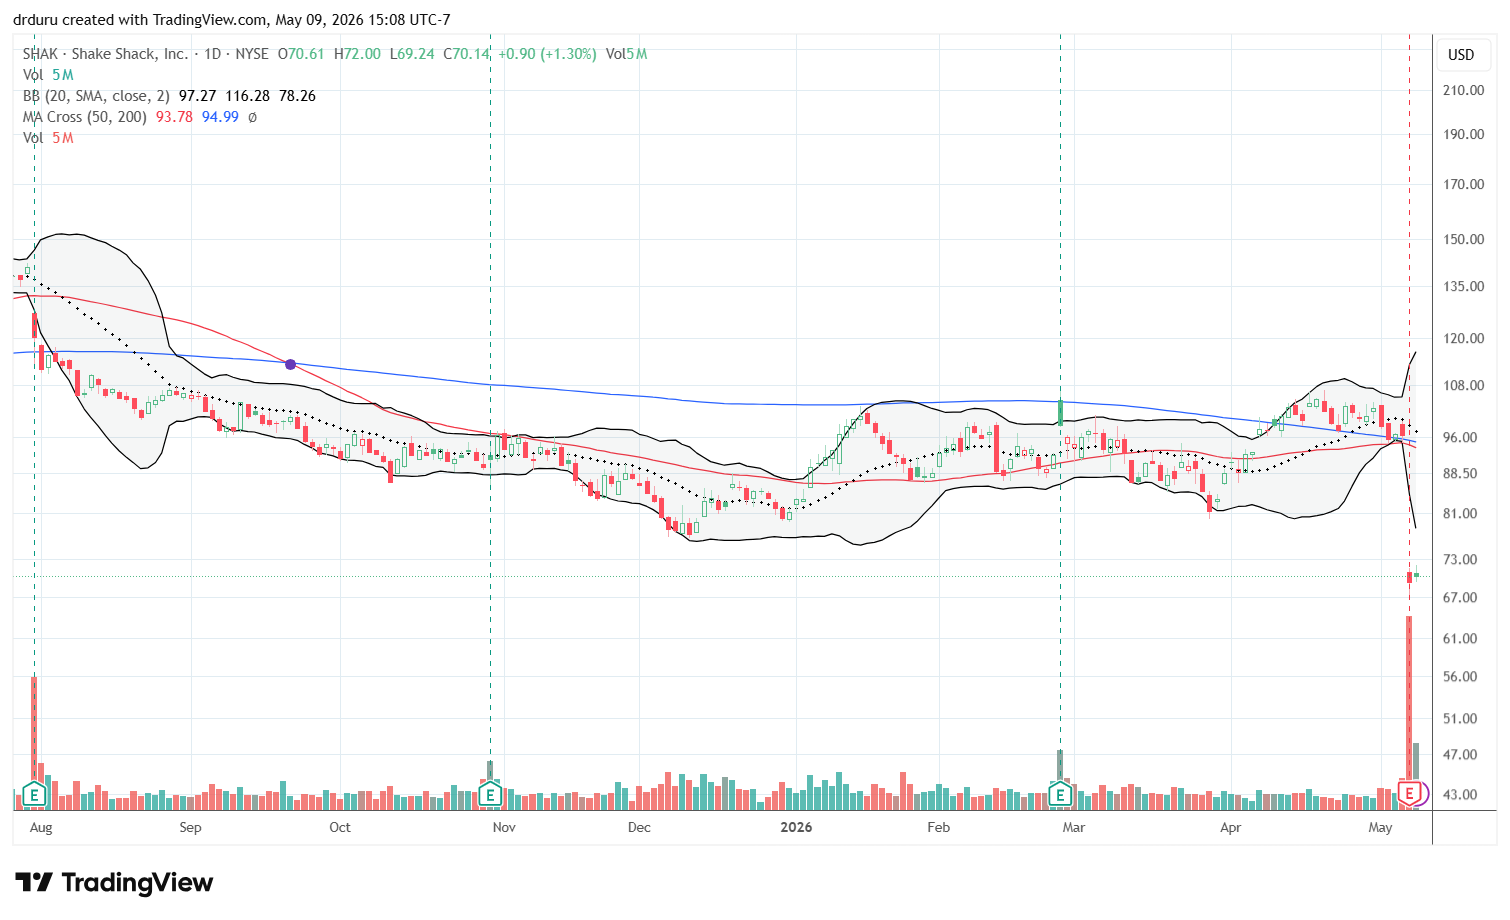
Shake Shack Inc. (SHAK)
Description: Shake Shack Inc. (SHAK) operates fast-casual hamburger restaurants.
Technical status: Shake Shack Inc. (SHAK) collapsed 28% post-earnings and broke below major trading range support. SHAK is now at a 2+ year low.
Trade commentary: SHAK completely failed after what initially looked like a constructive breakout setup on a 200DMA breakout. I expect bears to target rebounds toward the $75 area. I will even consider shorting the stock there. SHAK is now one of the stocks weighing on market breadth through AT50.
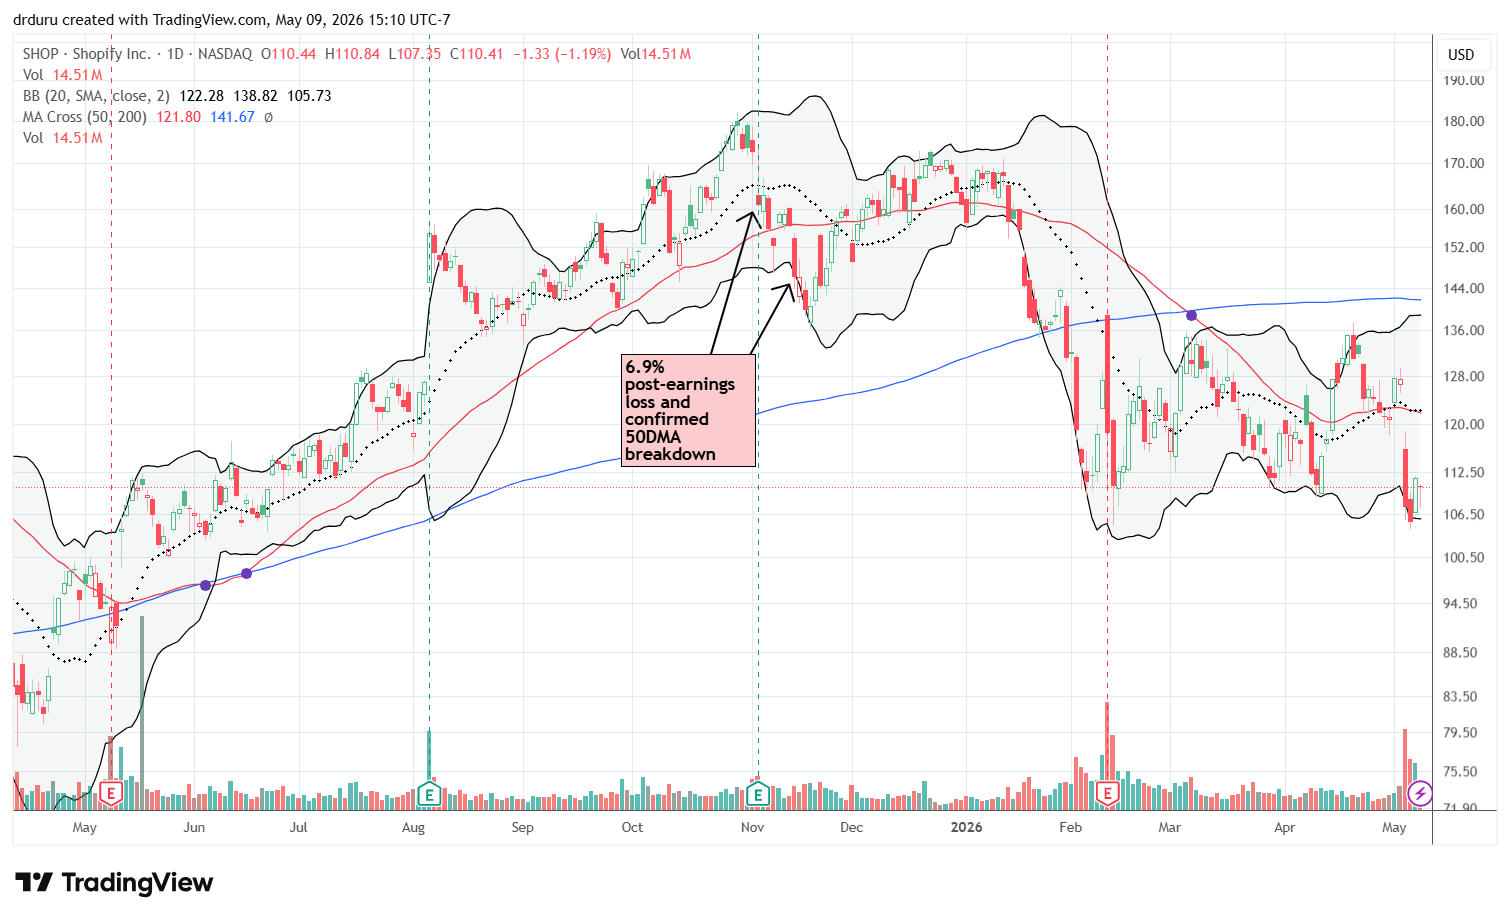
Shopify Inc. (SHOP)
Description: Shopify Inc. (SHOP) provides e-commerce software and online store management tools.
Technical status: Shopify Inc. (SHOP) fell 15.6% after earnings and further confirmed its bearish positioning below 200DMA resistance.
Trade commentary: I have wanted to get bullish on SHOP for quite some time, but the stock simply cannot sustain upside momentum. I have abandoned my bullish bias for now given the growing weakness in consumer-facing stocks and SHOP’s breakdown to a new low for the year.
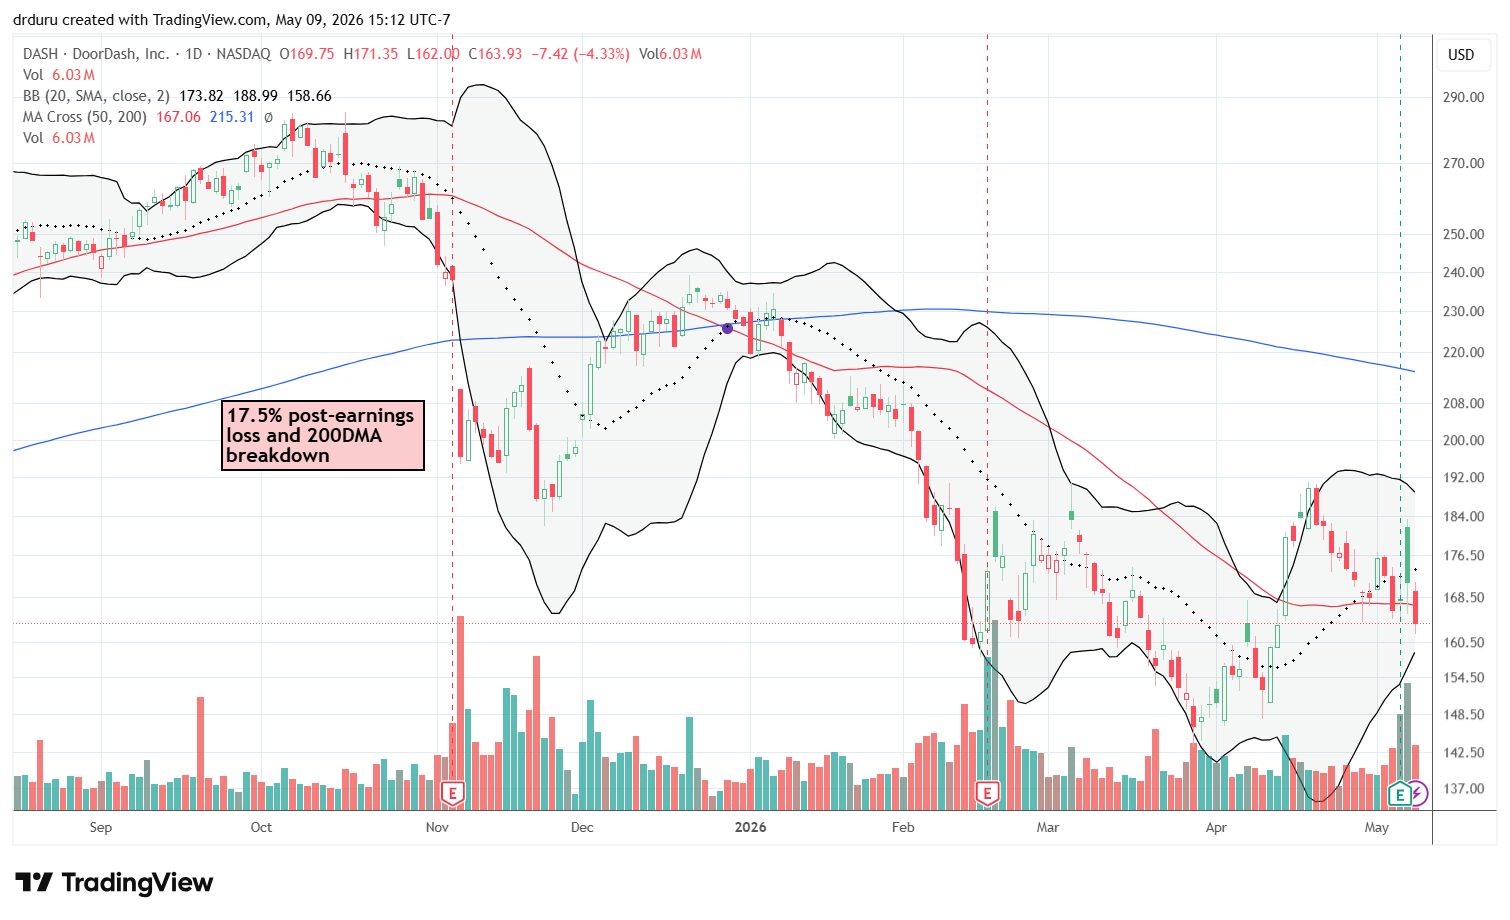
DoorDash, Inc. (DASH)
Description: DoorDash, Inc. (DASH) operates an online food delivery and local commerce platform.
Technical status: DoorDash, Inc. (DASH) faded sharply after an initial post-earnings gain and broke below its 50DMA.
Trade commentary: DASH fooled me because I initially thought the stock was beginning a rebound thanks to earnings. I bought a small position, but I will stop out if the stock makes another low for the year.
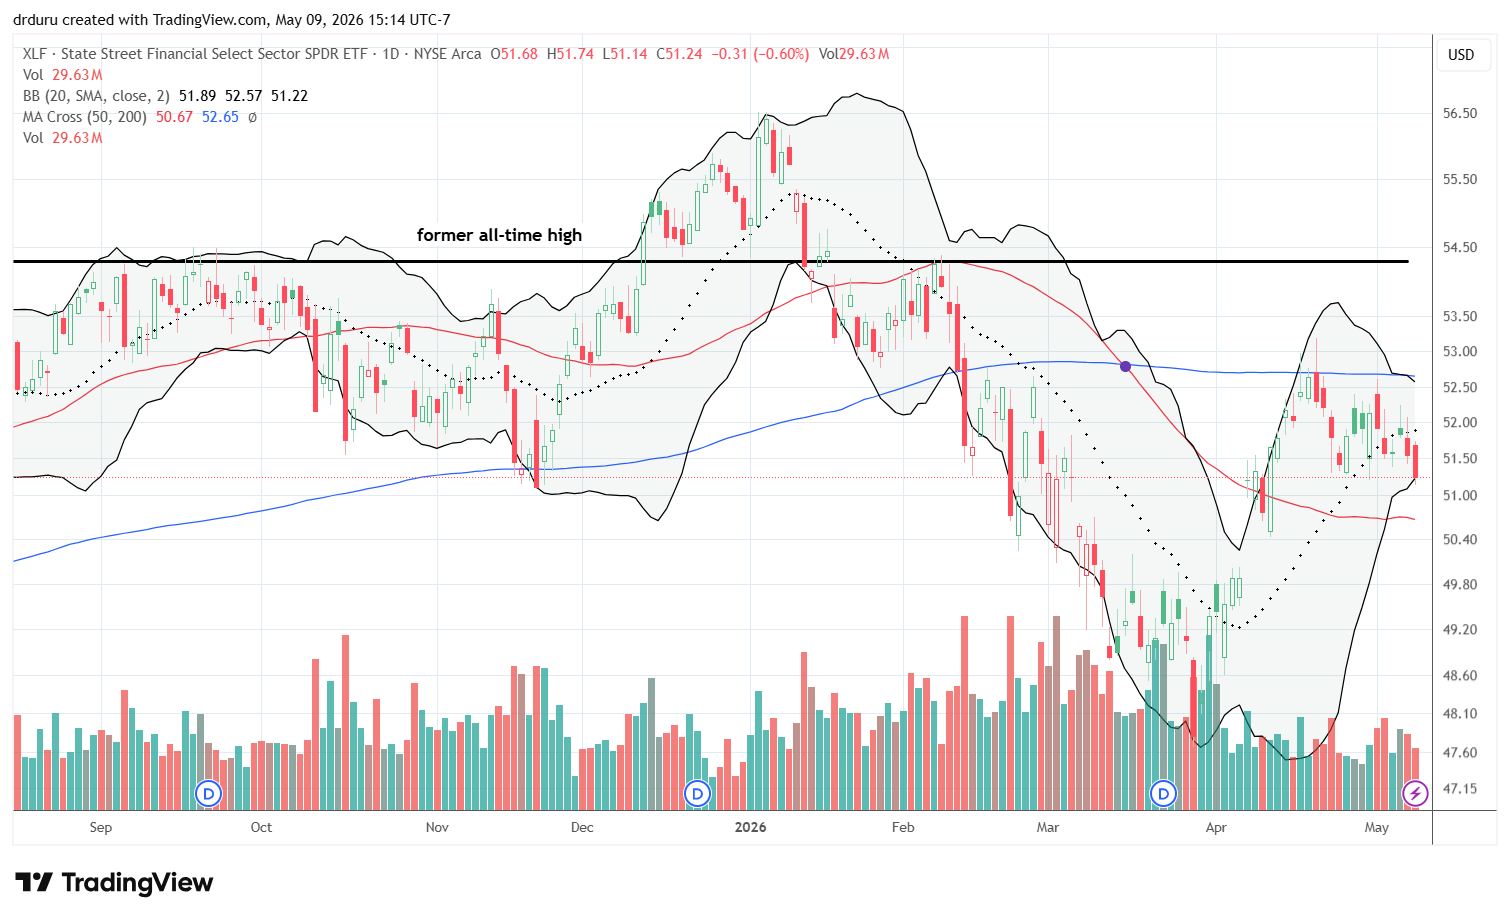
Financial Select Sector SPDR Fund (XLF)
Description: Financial Select Sector SPDR Fund (XLF) is an exchange-traded fund that tracks large U.S. financial companies.
Technical status: Financial Select Sector SPDR Fund (XLF) failed repeatedly at 200DMA resistance and now appears vulnerable to a test of its 50DMA.
Trade commentary: Financials are a major concern for market breadth and the stock market in general. Typically, the market needs strong financials, but the S&P 500 and the NASDAQ have been able to power away from financials since XLF stalled at 200DMA resistance in late April. A 50DMA breakdown would make me more inclined to get bearish on the stock market.
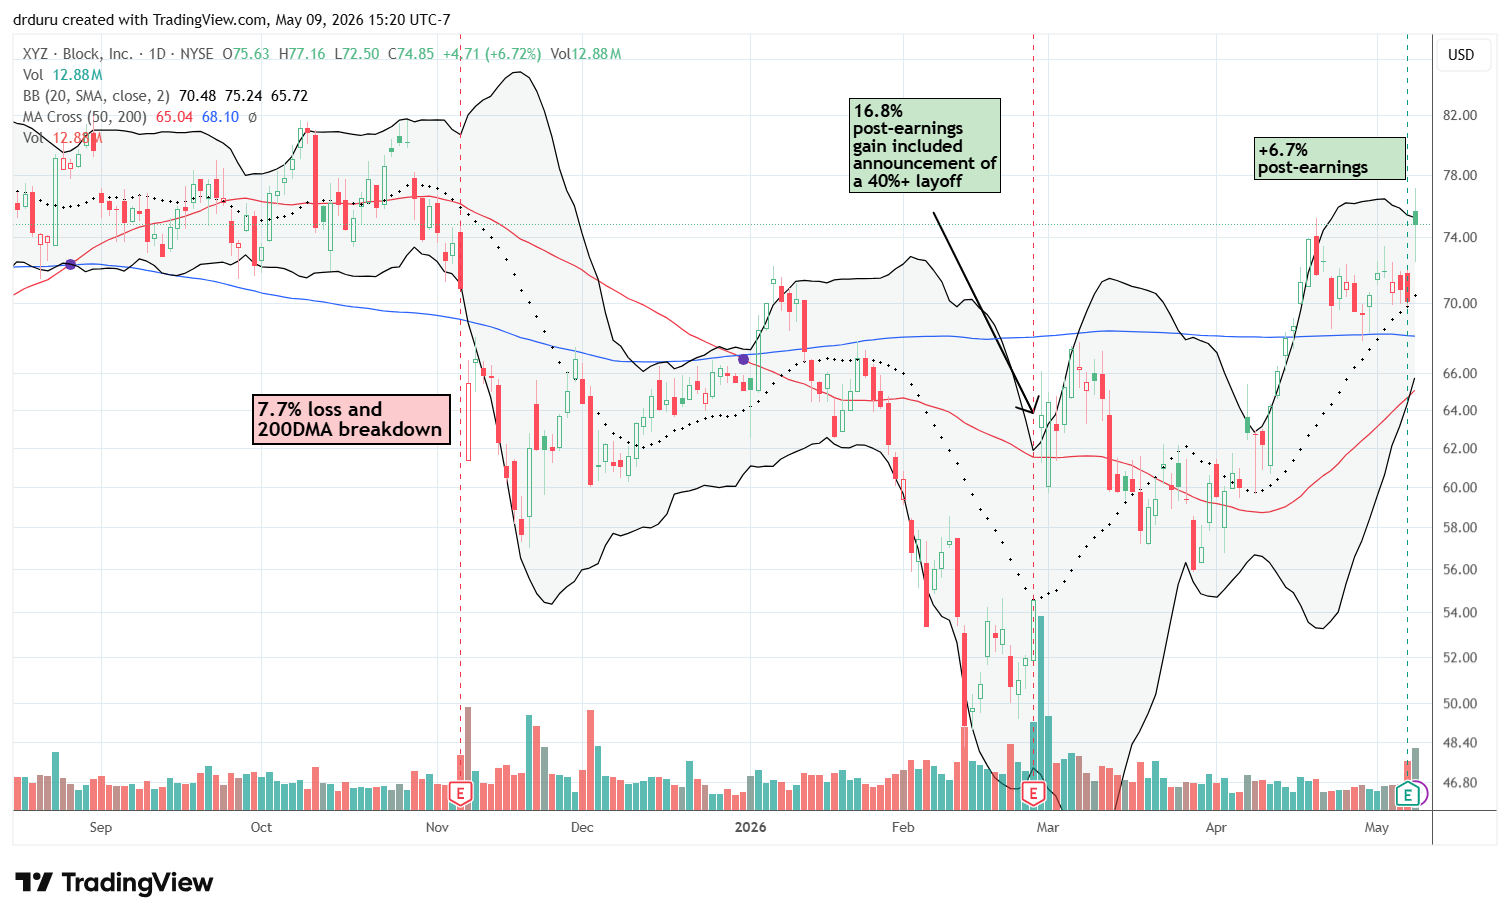
Block, Inc. (XYZ)
Description: Block, Inc. (XYZ) provides financial technology services, digital payments, and commerce tools.
Technical status: Block, Inc. (XYZ) confirmed support at its 200DMA with a 6.7% post-earnings gain.
Trade commentary: I was wrong on XYZ. I interpreted the AI-driven layoff as a warning sign. My bearish puts initially worked but completely failed after the recovery. The earnings gain confirms the 200DMA breakout. The setup on XYZ is bullish for traders even though the stock remains trapped inside a very large long-term range. Still, I am not buying and instead chose to reserve the “right” to short the stock again on a drop below its 50DMA.
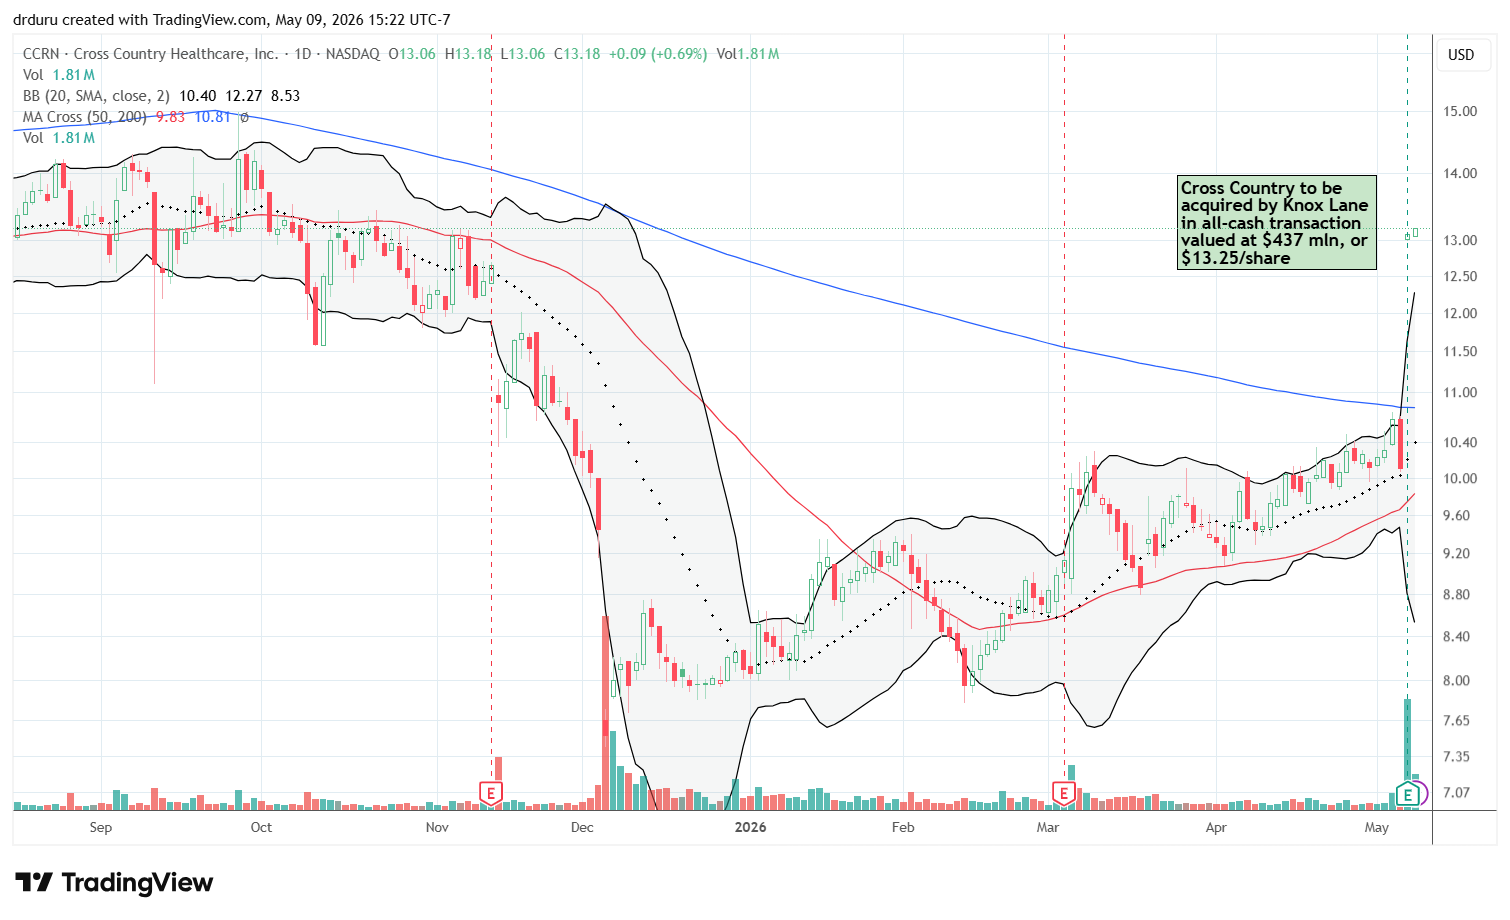
Cross Country Healthcare, Inc. (CCRN)
Description: Cross Country Healthcare, Inc. (CCRN) provides healthcare staffing and workforce solutions services.
Technical status: Cross Country Healthcare, Inc. (CCRN) surged 29.5% after a buyout announcement.
Trade commentary: CCRN became one of my biggest wins last week. I stubbornly stayed with the stock through painful declines and added aggressively after the December 2025 collapse. The buyout offer from Kane for $13.25 validates my stubbornness about the upside case for CCRN. I need to tap into that stubbornness in many more cases!
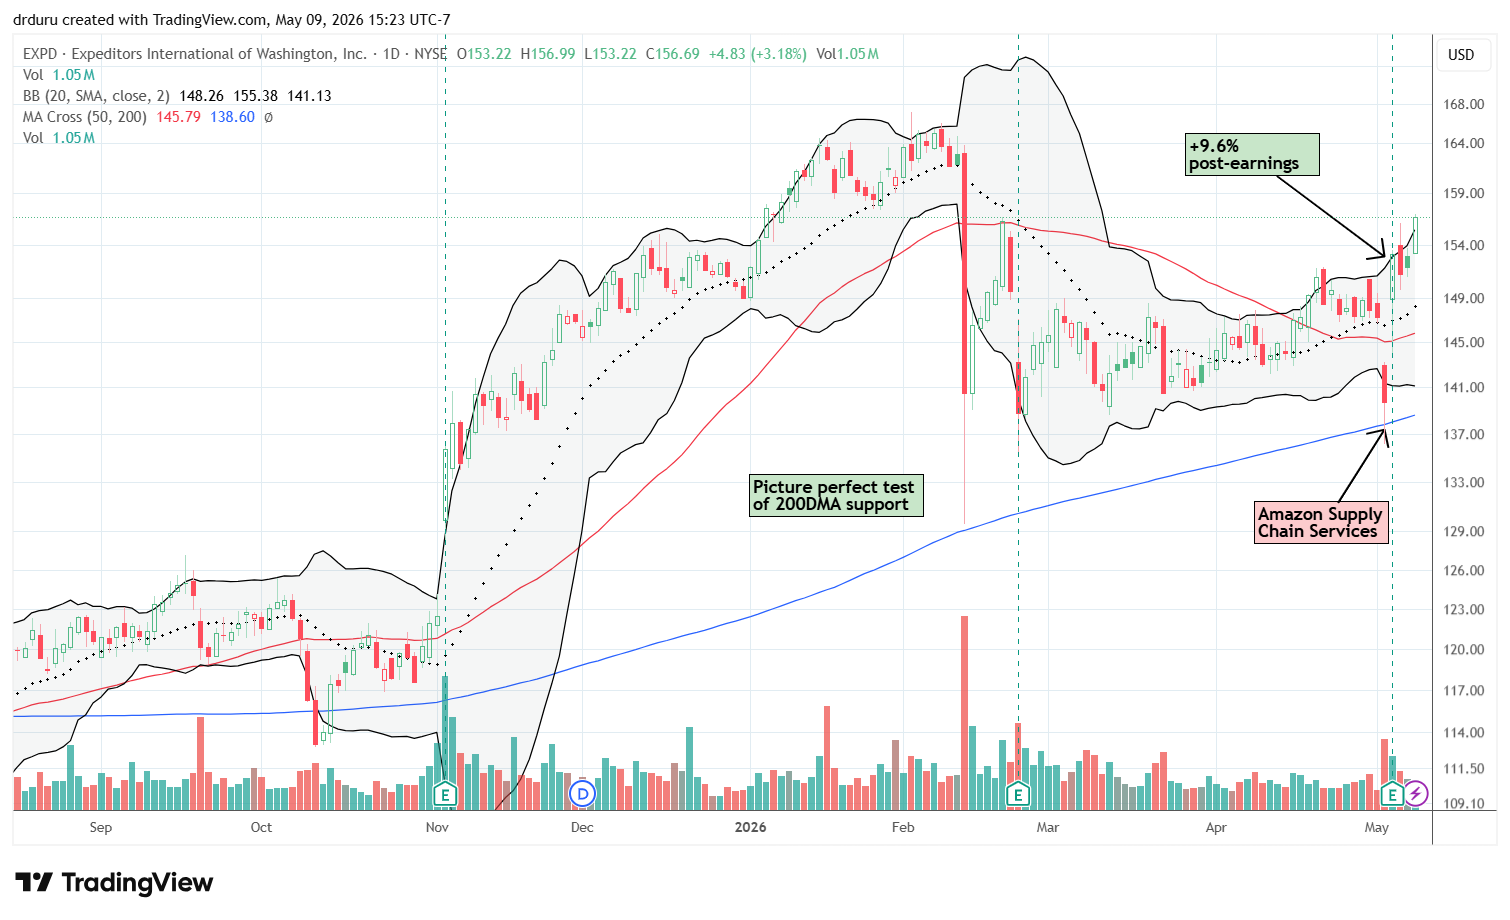
Expeditors International of Washington, Inc. (EXPD)
Description: Expeditors International of Washington, Inc. (EXPD) provides global logistics, freight forwarding, and supply chain services.
Technical status: Expeditors International of Washington, Inc. (EXPD) recovered from earlier breakdowns and regained bullish momentum after a 9.6% post-earnings gain.
Trade commentary: An AI Panic hit trucking and logistics stock in February. The narrative was hard to believe, and I had no problem getting contrarian against this AI Panic. I have already taken profits on all my related trades, but I continue to monitor the sector for the next opportunities. The next opportunity came in the form of the latest Amazon Panic with Amazon.com (AMZN) announcing Supply Chain Services. While I picked a pairs trade pitting FedEx (FDX) short versus long United Parcel Service (UPS), I wanted to buy trucking stocks like EXPD. EXPD bounced perfectly off 200DMA support, but I did not buy given the risk of earnings the next day.
The stock’s 9.6% post-earnings jump confirms the stock’s bullishness. I have EXPD on my buy list for the coming week.
Be careful out there!
Footnotes
Subscribe for free to get email notifications of future posts!
“Above the 50” (AT50) uses the percentage of stocks trading above their respective 50-day moving averages (DMAs) to measure breadth in the stock market. Breadth defines the distribution of participation in a rally or sell-off. As a result, AT50 identifies extremes in market sentiment that are likely to reverse. Above the 50 is my alternative name for “MMFI” which is a symbol TradingView.com and other chart vendors use for this breadth indicator. Learn more about AT50 on my Market Breadth Resource Page. AT200, or MMTH, measures the percentage of stocks trading above their respective 200DMAs.
Active AT50 (MMFI) periods: Day #200 over 20%, Day #27 over 30%, Day #23 over 40%, Day #22 over 50%, Day #7 over 60% (overperiod), Day #173 under 70% (underperiod)
Source for charts unless otherwise noted: TradingView.com
Full disclosure: long SPY put spread, long IWM shares and call, long PANW, long DASH, long FDX put spread, long UPS calls
FOLLOW Dr. Duru’s commentary on financial markets via StockTwits, BlueSky, and even Instagram!
*Charting notes: Stock prices are not adjusted for dividends. Candlestick charts use hollow bodies: open candles indicate a close higher than the open, filled candles indicate an open higher than the close.
* Blog notes: this blog was partially written based on the heavily edited transcript of the following video that includes a live review of the stock charts featured in this post. I used ChatGPT to process the transcript.