
The Market Breadth Summary
- Market fears expanded as geopolitical conflict, surging oil prices, and a sharp downside surprise in the jobs report pressured equity markets and increased volatility.
- Rising crude prices linked to conflict with Iran drove energy markets sharply higher and contributed to declines in travel-related sectors such as airlines.
- Semiconductor stocks weakened and key technical support levels broke, suggesting the AI-driven rally may be reaching a near-term topping phase.
- Market breadth deteriorated as the percentage of stocks trading above their 50-day and 200-day moving averages both declined into bearish territory.
- U.S. Treasury bonds failed to attract safe-haven demand despite weak labor market data.
- Sector rotation intensified, with software stocks staging a sharp rebound while the rest of the stock market experienced broad weakness.
- Technical conditions suggest a potential short-term rebound due to volatility extremes, though geopolitical risk, tariffs, and weakening employment may limit upside.
Stock Market Commentary
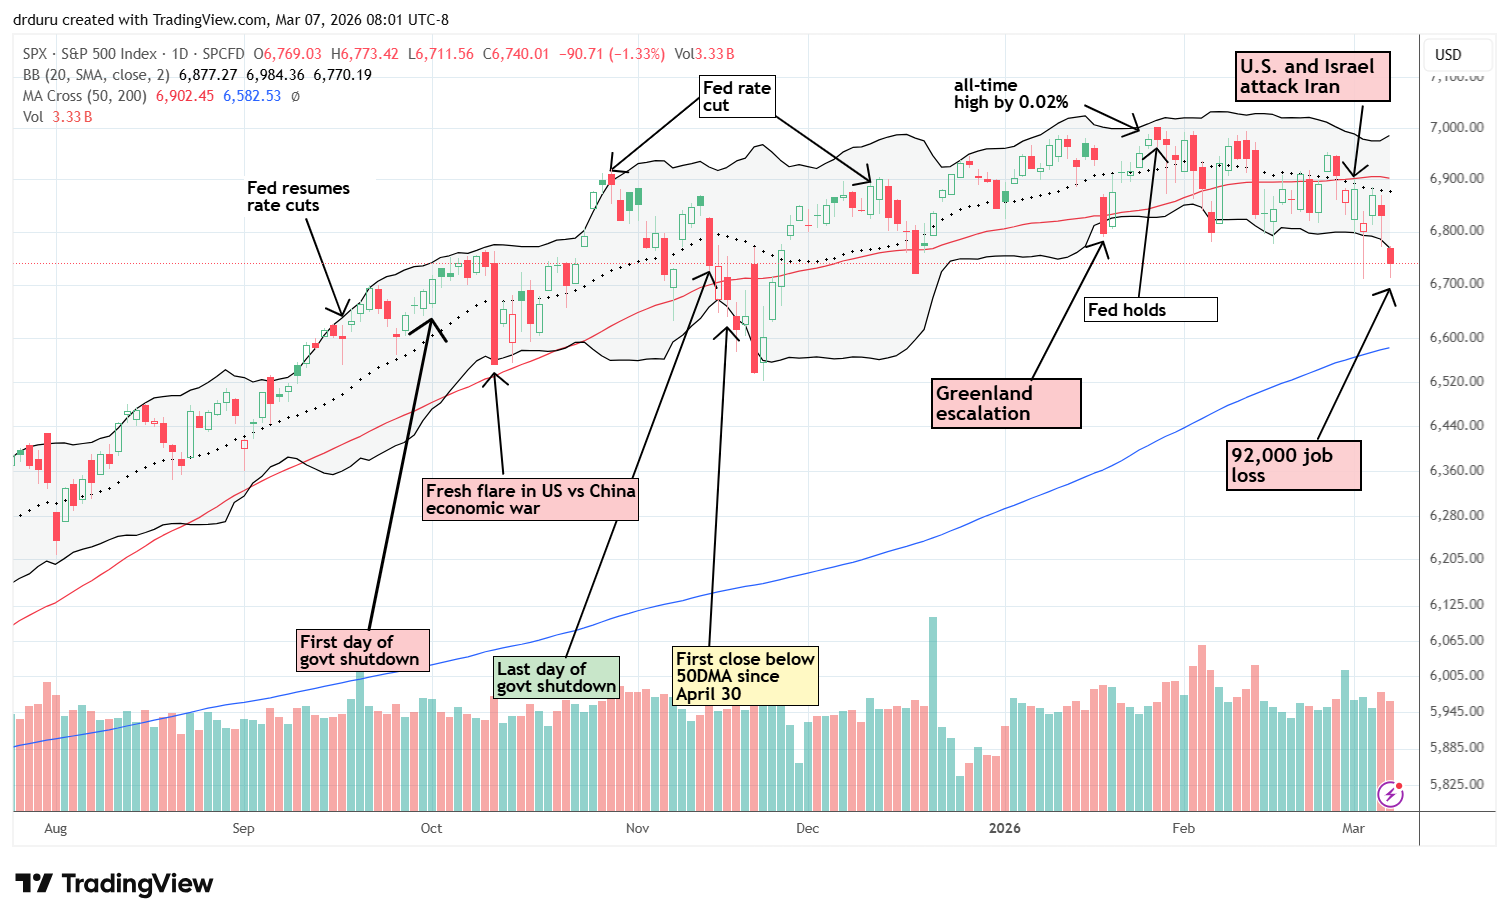
Market fears expanded last week as converging headwinds took their toll on a market that insists on buying every dip. The best example of buying persistence came with the market’s first regular trading session after the U.S. and Israel attacked Iran. The S&P 500 gapped down at Monday’s open, but buyers returned the index to a flat performance to end the day. The trading action was one of the more complacent responses I can remember to a dramatic and tragic geopolitical shock. The next day, war jitters and soaring oil sent the stock market tumbling again. This time, sellers not only gapped the market down but also knocked the market lower from the open. Buyers took the baton from the intraday lows and returned prices close to their opening levels – a second consecutive display of insistent dip buying. Wednesday delivered a full day of relief as buyers took the market to near flat for the week. Alas, sellers took over the last two days as damage from the war worsened and oil continued a parabolic climb. A very negative downside surprise on the February jobs report, a loss of 92,000 jobs, proved too much for buyers and sealed the deal on a negative week.
In the midst of the expanding fears, the AI trade seemed to top out with semiconductors breaking important support, and with OpenAI and Oracle deciding to allocate resources away from the massive Stargate project in Texas. Ironically, a big winner of the week was software which completed an impressive V-recovery from the recent AI-panicked lows of the SaaSpocalypse.
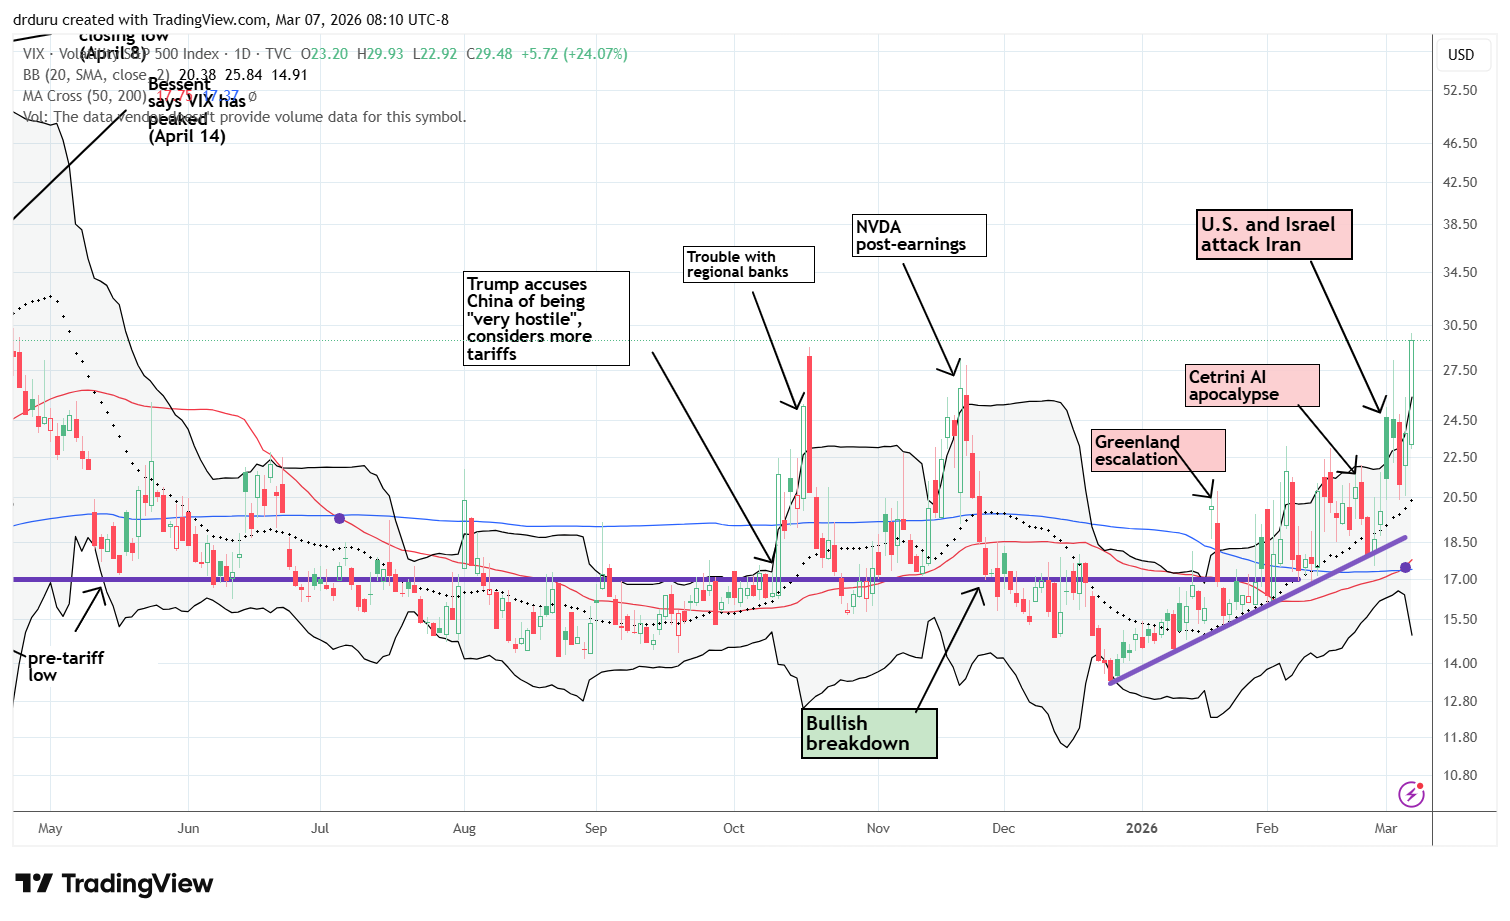
This chaotic market churn and rotation helped to drive the volatility index to new heights delivering the most direct confirmation of expanded fears in the stock market. And yet, the overall stock market is still not oversold. While a bounce from current levels looks likely given the extremes in volatility, war conditions, ongoing tariff tensions, and weakening employment collectively increase the likelihood that any near-term rally could attract fresh profit-taking. Moreover, all the major indices are still close to all-time highs and nowhere close to correction territory (10% below the all-time high).
The Stock Market Indices
S&P 500 (SPY)
The S&P 500 finally confirmed its breakdown below support at its 50-day moving average (DMA) and is thus firmly bearish. Friday’s 1.3% loss in the wake of a weak jobs report closed the index at a 3-month closing low. However, the recent pattern remains of buyers stepping into the S&P 500 as soon as it drops below the lower Bollinger Band (the black lines enveloping 95% of the price action). So I fully expect a rebound on Monday. The lack of a rebound will tell volumes of just how far market fears have expanded as a result of war, soaring oil, a weakening labor market, and a topping in the AI trade. Regardless, a test of 200DMA support (blue line) is in play.
NASDAQ (COMPQ)
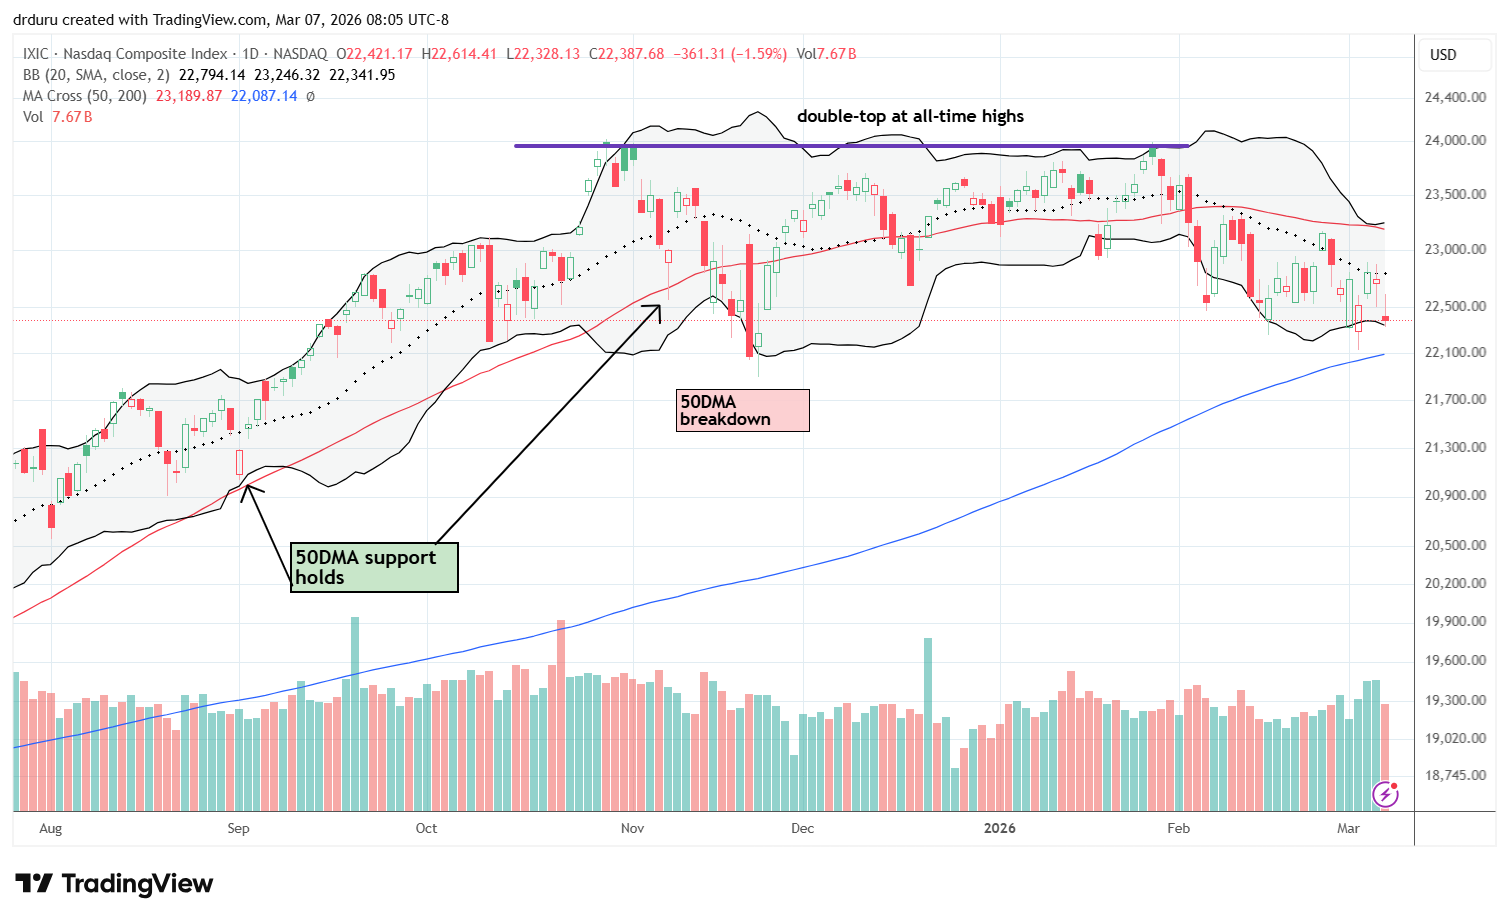
The NASDAQ has stayed bearish since the beginning of February. Last week’s trading established the 20DMA (the dashed line) as stiffer overhead resistance. Yet, the tech-laden index managed to avoid closing below two intraday lows for the week. The S&P 500 closed the week below its war-driven Monday open while the NASDAQ closed the week slightly above its Monday open. Thus, in a very subtle way, the NASDAQ performed relatively better than the S&P 500. Still, a test of 200DMA support looms around the corner even if this long-term trend line pushes into the NASDAQ’s trading action.
iShares Russell 2000 ETF (IWM)
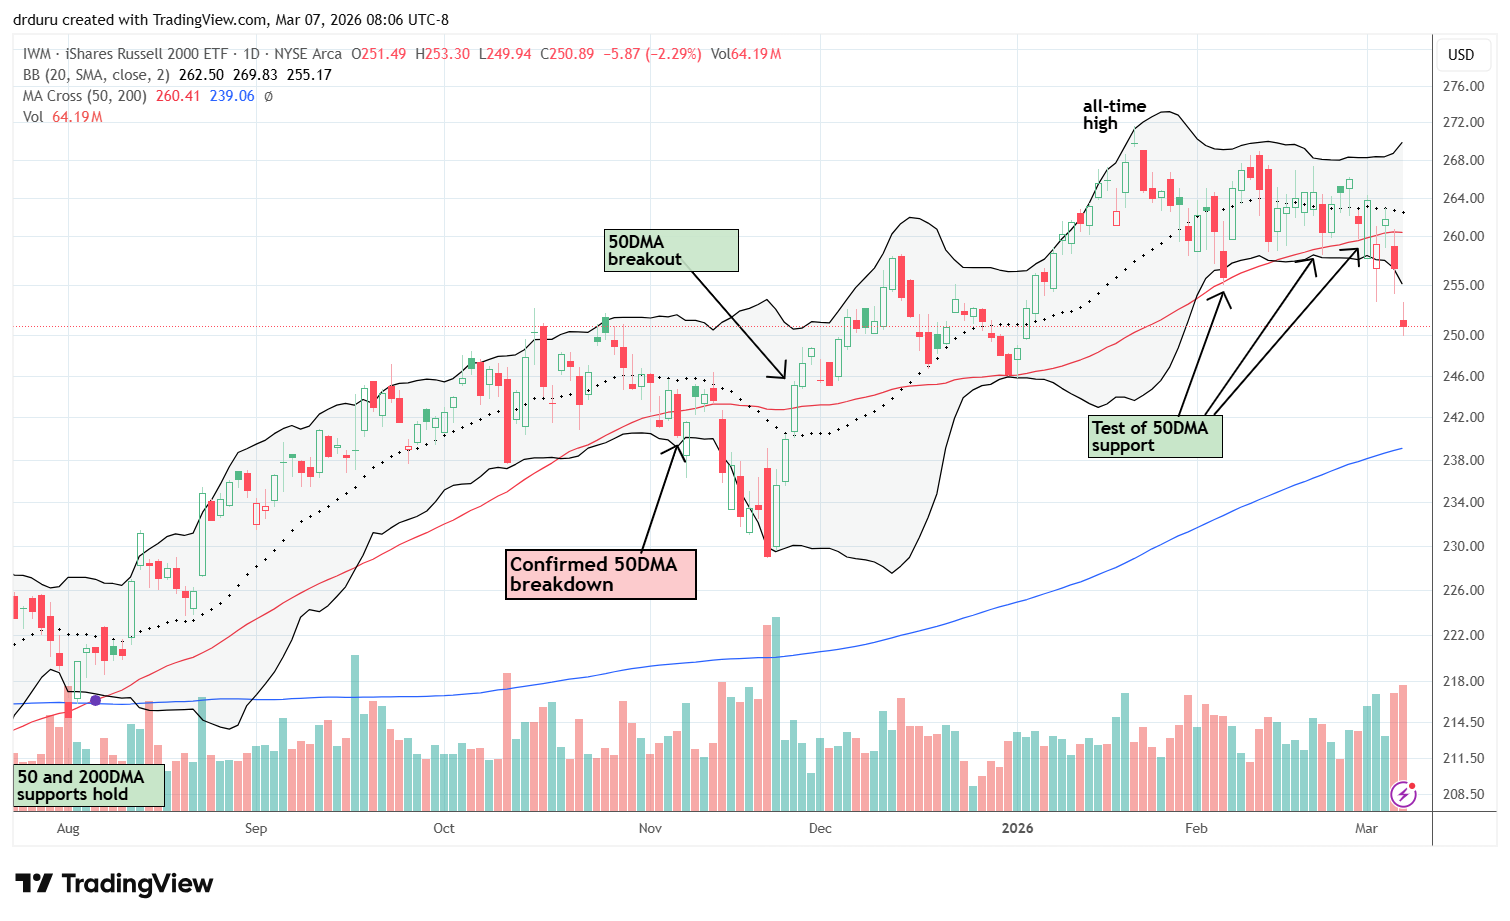
The relative outperformance of the IWM came to a crashing end last week. The ETF of small caps confirmed 50DMA resistance and plunged on Friday well below its lower Bollinger Band for a 4.0% loss on the week. IWM is even more over-extended than the S&P 500, so the odds are high for some kind of rebound. Thus, I opened a fresh weekly calendar call trade even after over-confidence ruined my last one; IWM gained 0.9% on Monday and looked even more resilient to the war against Iran than the rest of the market. Now, IWM has joined the other two major indices in bearish trading territory. As a part of risk management, I will likely sell my core shares into the next rebound. I will next look to buy back into IWM at or close to 200DMA support.
The Short-Term Trading Call With Market Fears
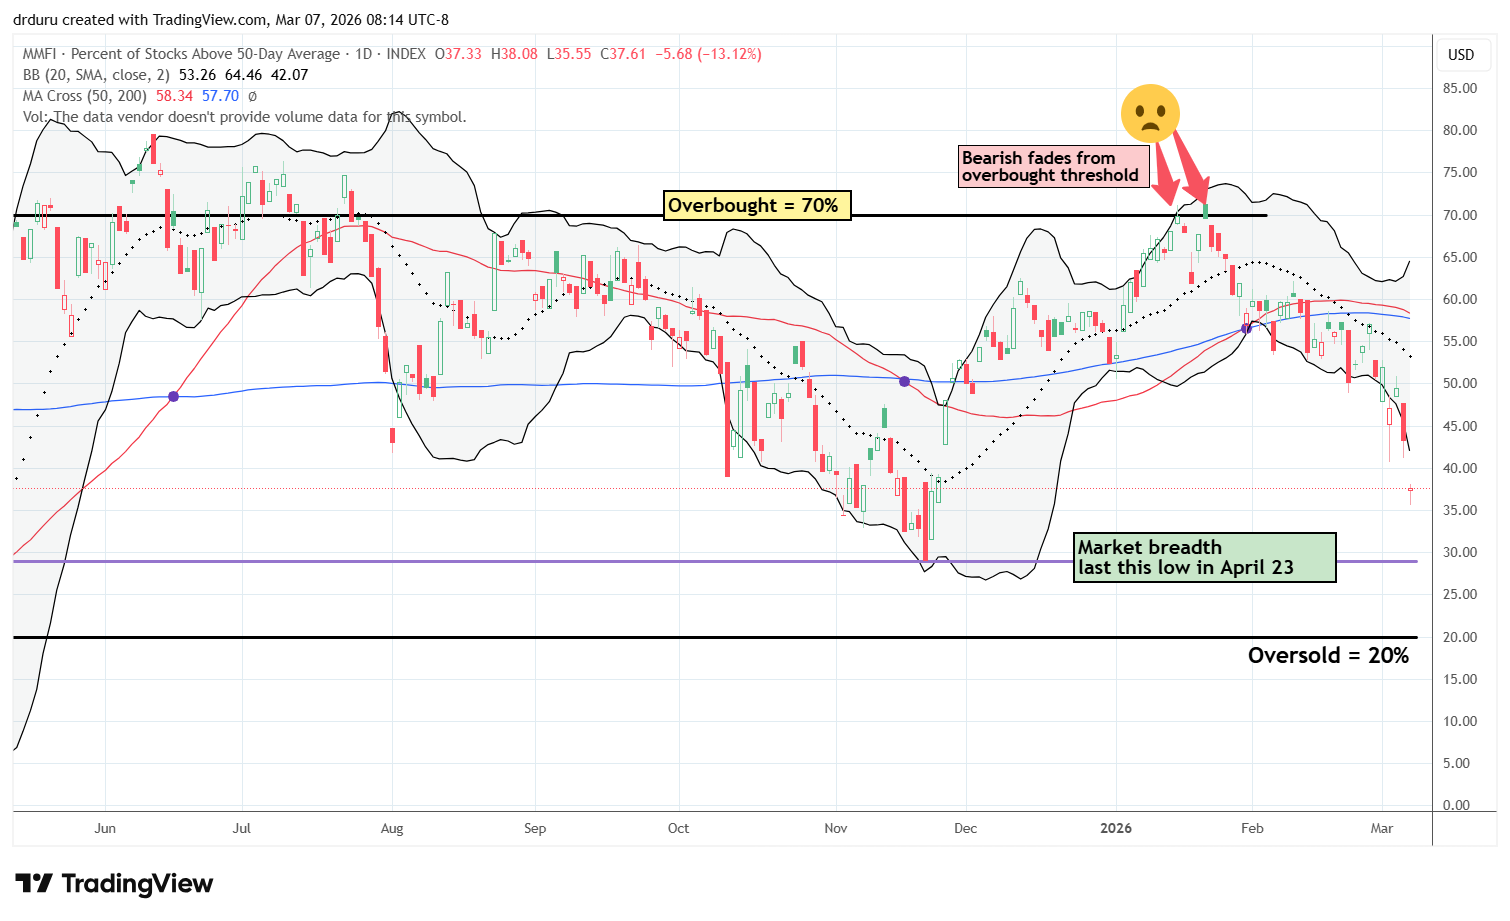
- AT50 (MMFI) = 37.6% of stocks are trading above their respective 50-day moving averages
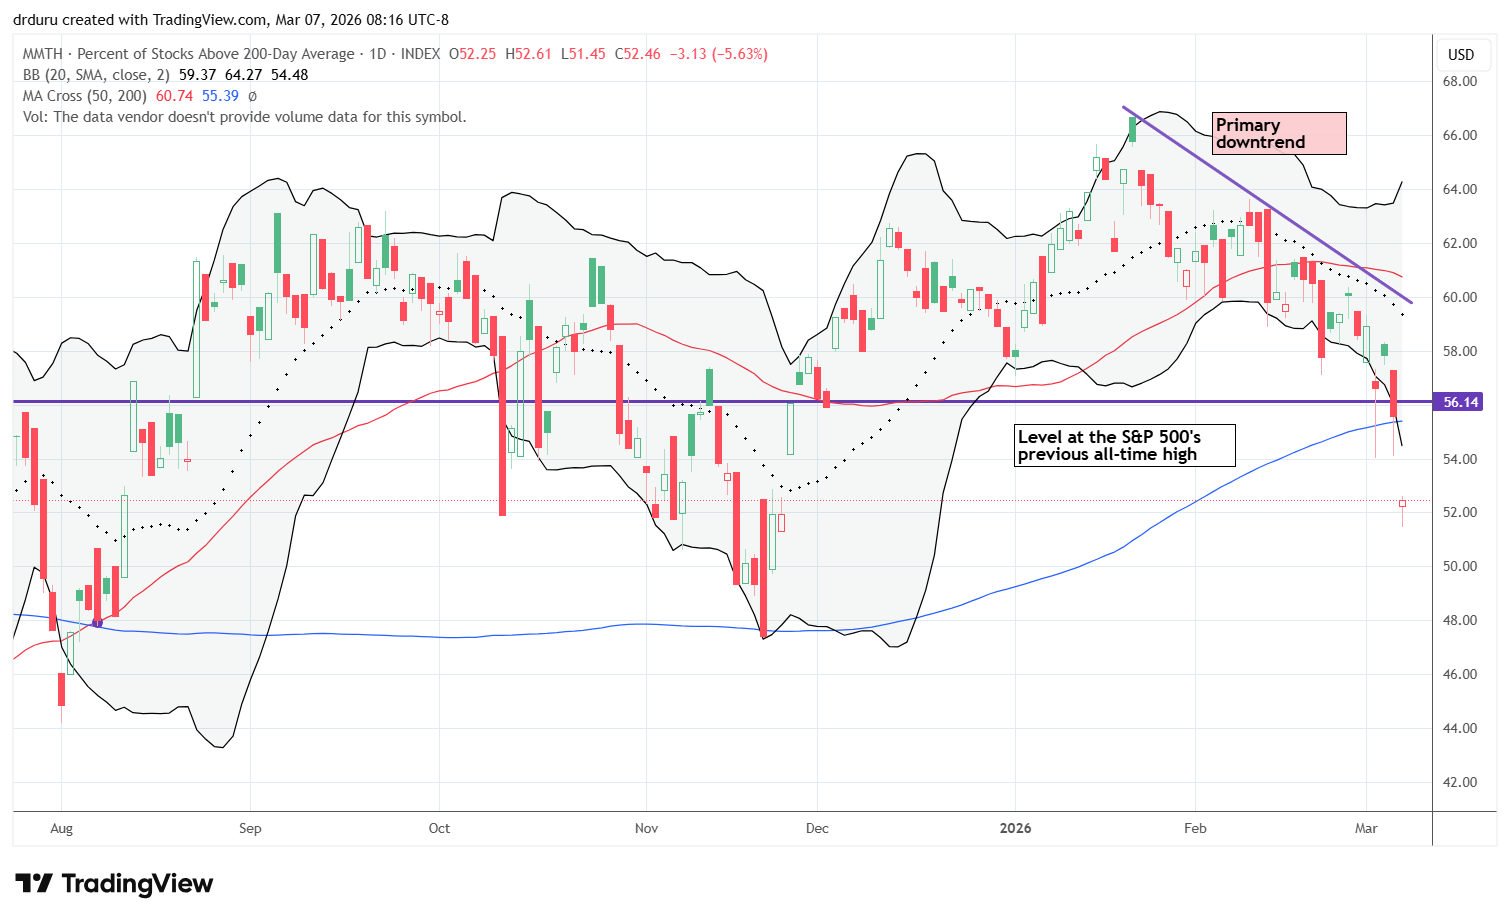
- AT200 (MMTH) = 52.5% of stocks are trading above their respective 200-day moving averages
- Short-term Trading Call: neutral
AT50 (MMFI), the percentage of stocks trading above their respective 50DMAs, closed the week at 37.6%. The previous doubly bearish week for market breadth was an apt precursor to last week’s collapse in my favorite technical indicator. AT50 maintained an accelerated downtrend before closing the week well below its Bollinger Band (see graph at the end of this post). This over-extended close further reinforces my expectations for a rebound to start the week…all else being equal. Unfortunately, threats and damages from the war against Iran continue to mount. So even the market’s insistent desire to buy all dips will be severely challenged in the coming trading days.
AT200 (MMTH), the percentage of stocks trading above their respective 200DMAs, finally gave way to a bearish trading position. This longer-term indicator of the health of market breadth accelerated losses into a close below previous support at 56.4%. AT200 last traded at current levels in November (see chart at the end of this post).
I claimed a week ago that the combination of bearish trading in AT50 and AT200 and an uptrending VIX meant that the stock market looked vulnerable to a “real pullback”. That pullback is still in its early stages. Yet, I am keeping the short-term trading call at neutral because of the potential for sharp rebounds on the way down along with the volatility of the news cycle. A sudden end to the war would launch a huge rally.
In case you missed it…
I made a case for a Bitcoin bottom. The signals worked out just ahead of a one day 6.4% surge. After taking profits on a short-term iShares Bitcoin Trust (IBIT) position, Bitcoin promptly reversed all its recent gains, and I bought into a fresh IBIT position. I also have active trading positions in BTC/USD.
Later that same day I made the case that the stock market in general was not oversold despite Tuesday’s pullback at one point feeling like an oversold condition. Friday’s sell-off confirmed the market still has room to go to get to a true oversold condition.
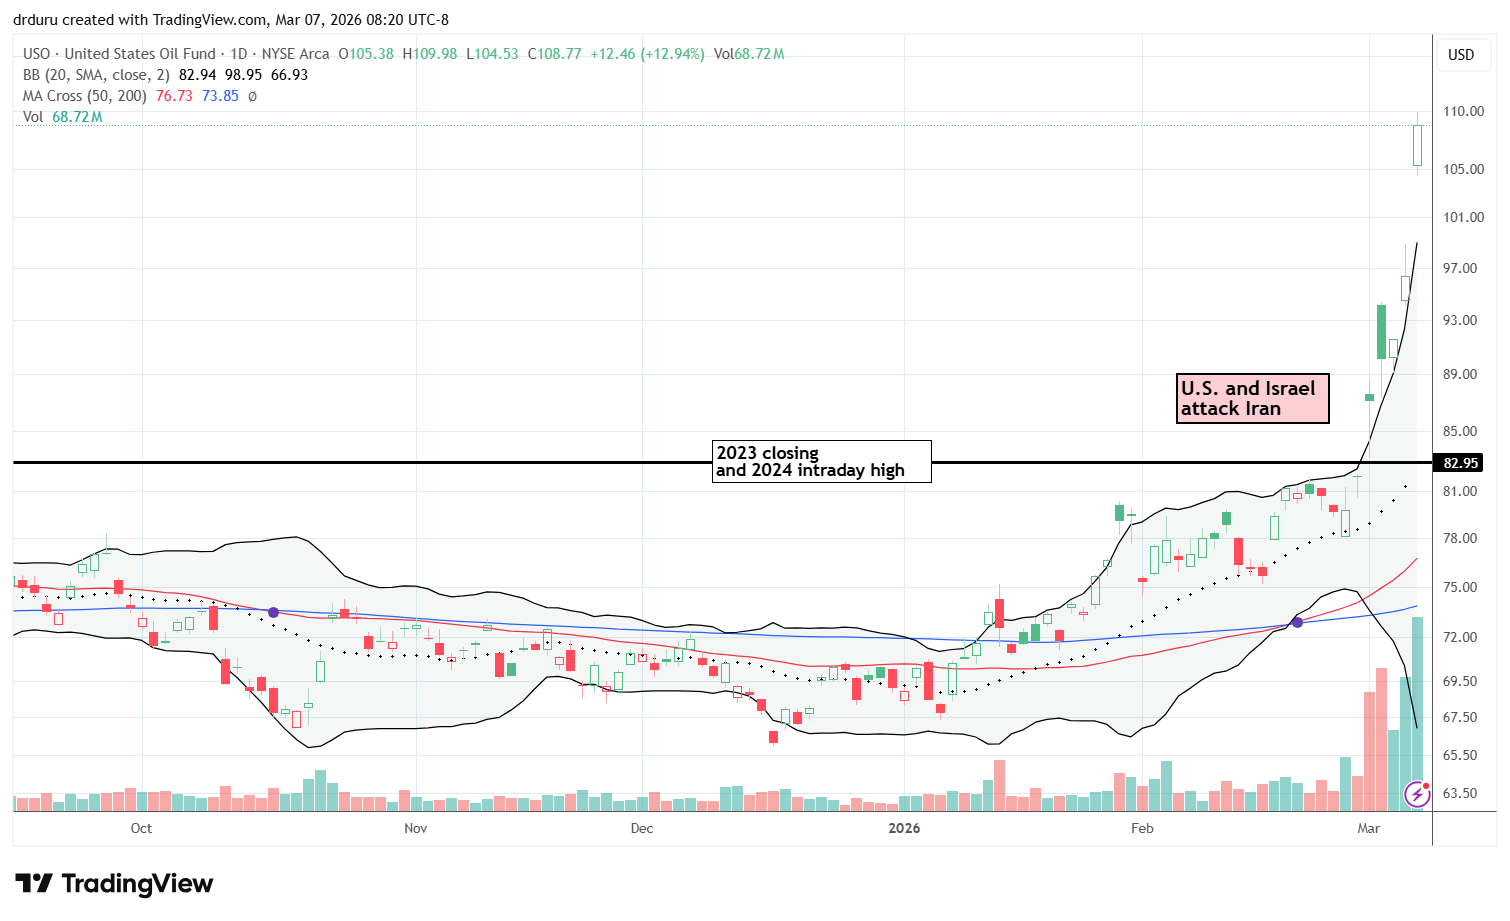
United States Oil Fund (USO)
Description: Tracks the daily price movements of West Texas Intermediate (WTI) crude oil futures, giving investors exposure to oil prices without directly trading futures contracts.
Technical status: The United States Oil Fund (USO) soared 32.7% for the week to a 7-year high as the U.S. and Israel’s war against Iran continued.
Trade commentary: USO traded in over-extended fashion all week with 5 consecutive closes above its upper Bollinger Band. Friday’s 12.9% surge created a parabolic run-up. Along the way, I have purchased calendar put spreads. First, I anticipated a quick reversal similar to previous crisis-related spikes. Now, I see these positions as hedges for any shorts I place on the market. I look back on this chart and wonder whether I had enough information at the start of the week to take more seriously the prospects for substantially higher oil prices.
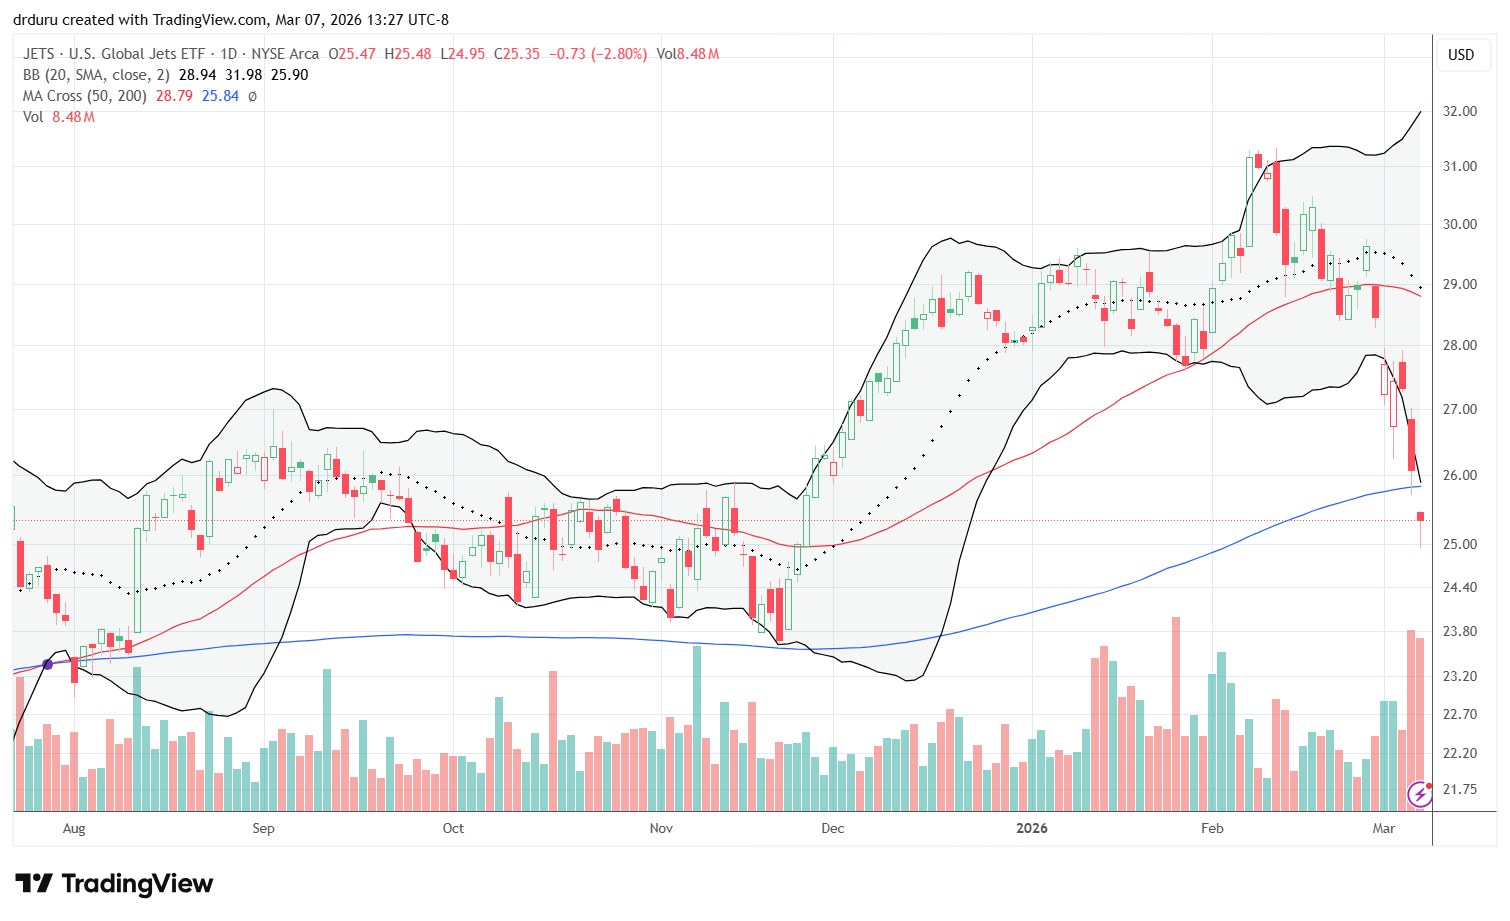
U.S. Global Jets ETF (JETS)
Description: Invests primarily in airline companies and related businesses such as aircraft manufacturers and airport operators, providing targeted exposure to the global airline industry.
Technical status: Soaring oil prices and war-related travel disruptions sent U.S. Global Jets ETF (JETS) plunging past 200DMA support. This support held in November. JETS is a potential buy above $26.
Trade commentary: When JETS bounced off its 200DMA support, I was tempted to buy it for a swing trade. However, given my calendar put spreads on USO, I realized I had no need to increase my risk and exposure to a bet on lower oil prices. Friday’s gap down below 200DMA support puts a test of the November lows in play. The bearish drop also paves the way for a better risk/reward trade when JETS closes above its 200DMA again. At that point, the heavy selling in airlines should be ending.
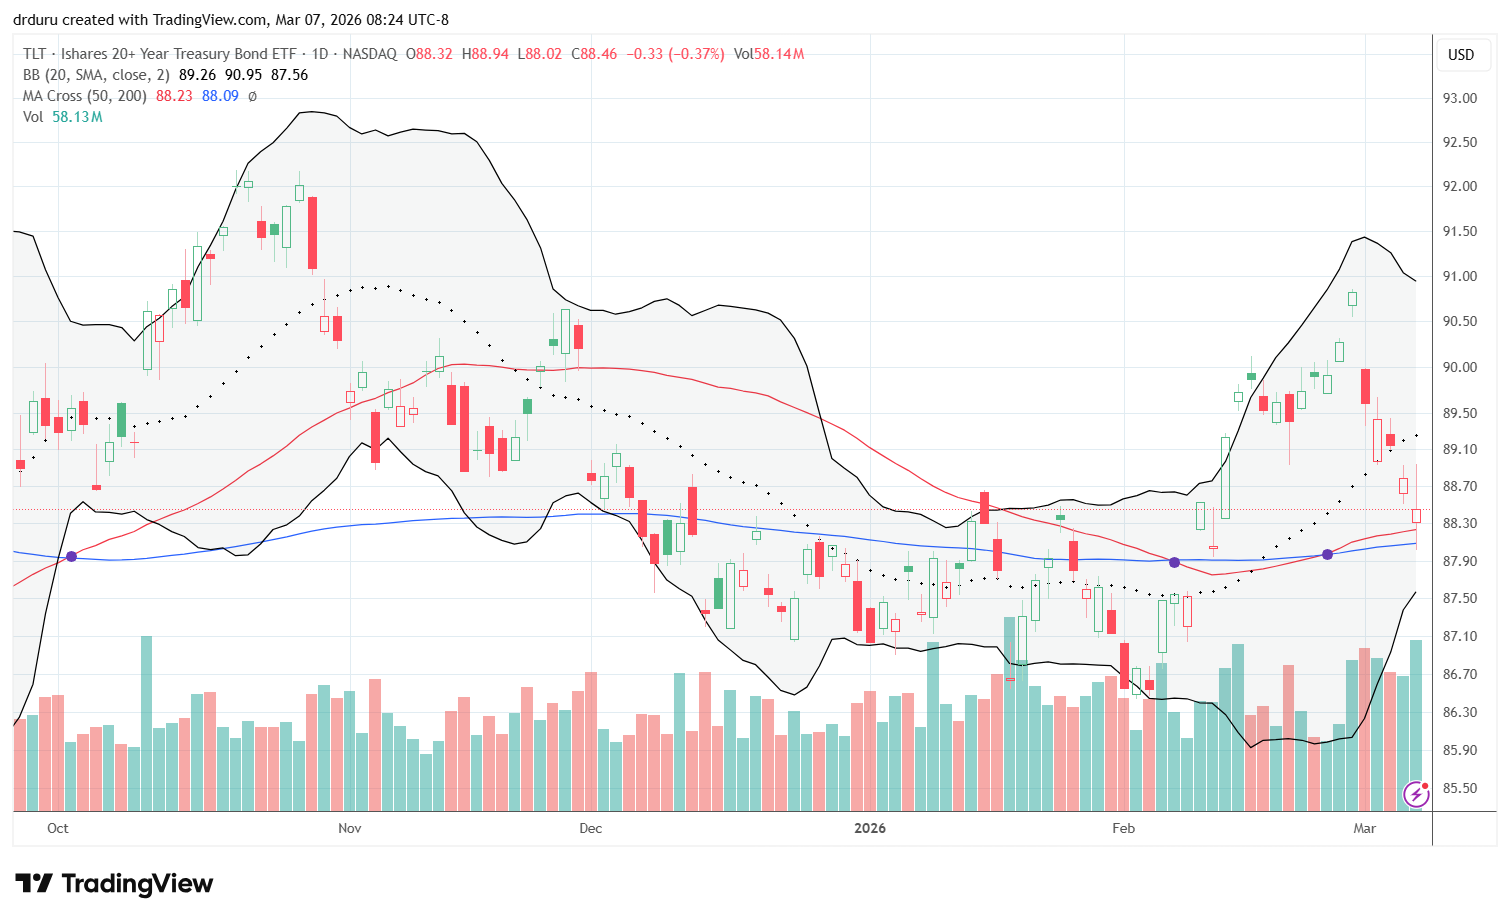
iShares 20+ Year Treasury Bond (TLT)
Description: Provides exposure to long-duration U.S. Treasury bonds with maturities greater than 20 years, making it highly sensitive to changes in long-term interest rates.
Technical status: The iShares 20+ Year Treasury Bond (TLT) fell all week but held support at its 50 and 200DMAs
Trade commentary: U.S. Treasury bonds have failed to play the typical safe haven role. TLT even fell after the poor jobs report. Instead of being a safety trade, the sell-off in bonds reflects a different set of market fears: the increasing inflationary threat from an increasingly expensive war. Moreover, global confidence in the U.S. looks like it is rapidly eroding. Still, I bought TLT on Friday both for yield and for a potential bounce off support.
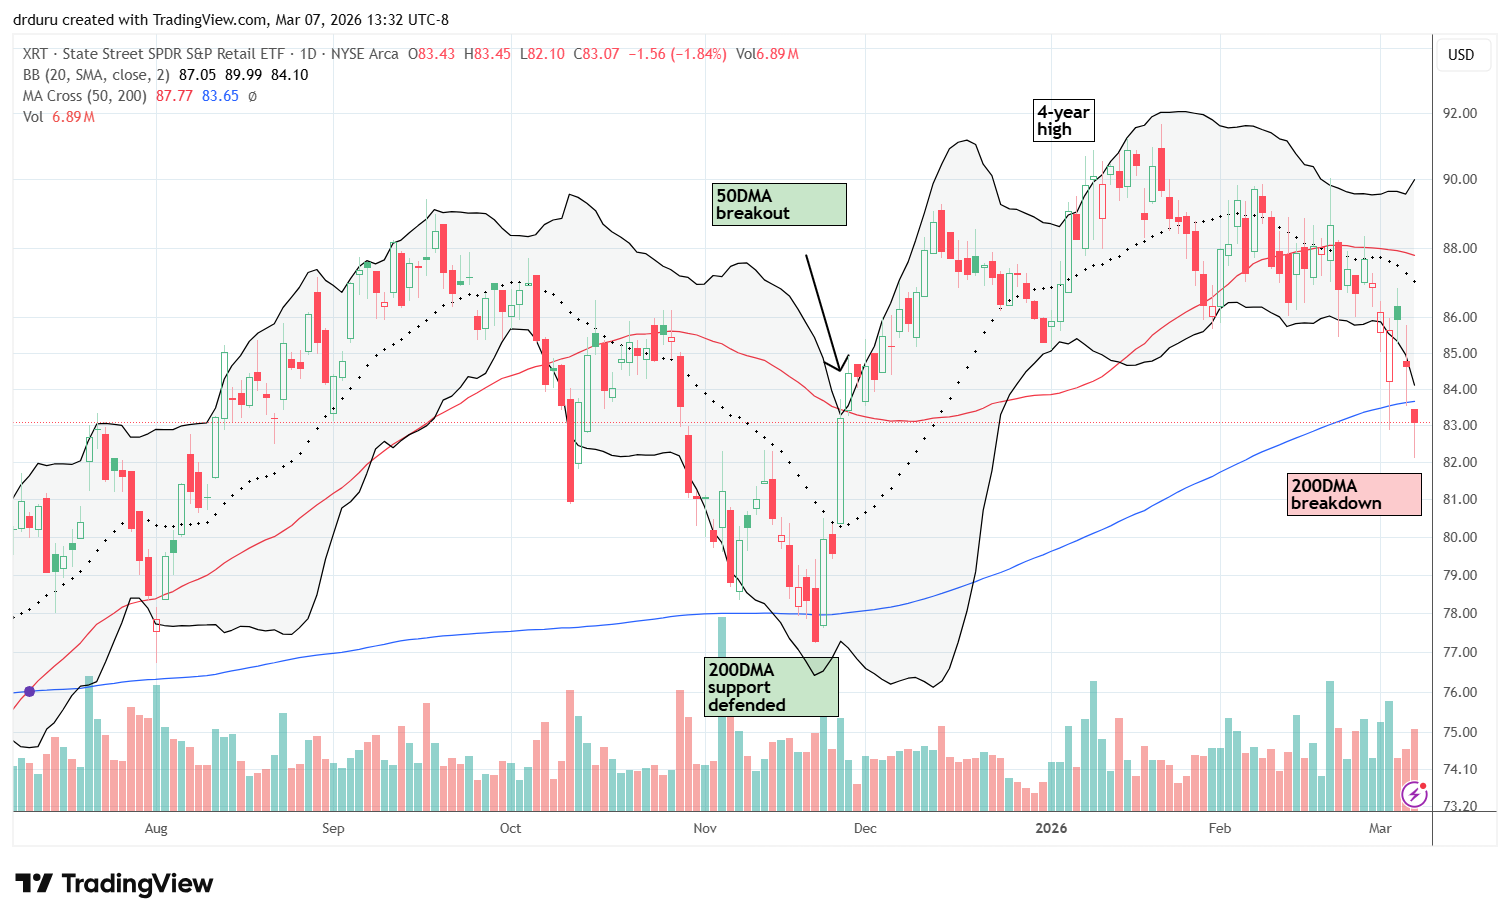
State Street SPDR S&P Retail ETF (XRT)
Description: Tracks the S&P Retail Select Industry Index, holding a broad basket of U.S. retail companies across segments such as apparel, e-commerce, and specialty stores.
Technical status: A poor jobs report forced the State Street SPDR S&P Retail ETF (XRT) into a 200DMA breakdown.
Trade commentary: XRT fell 1.8% on Friday in the wake of a parabolic oil price and the poor jobs report. With hindsight, my trade on XRT the previous week looks particularly hasty! XRT is now bearish. I am inclined to short XRT as a fade of a rebound to 50DMA resistance.
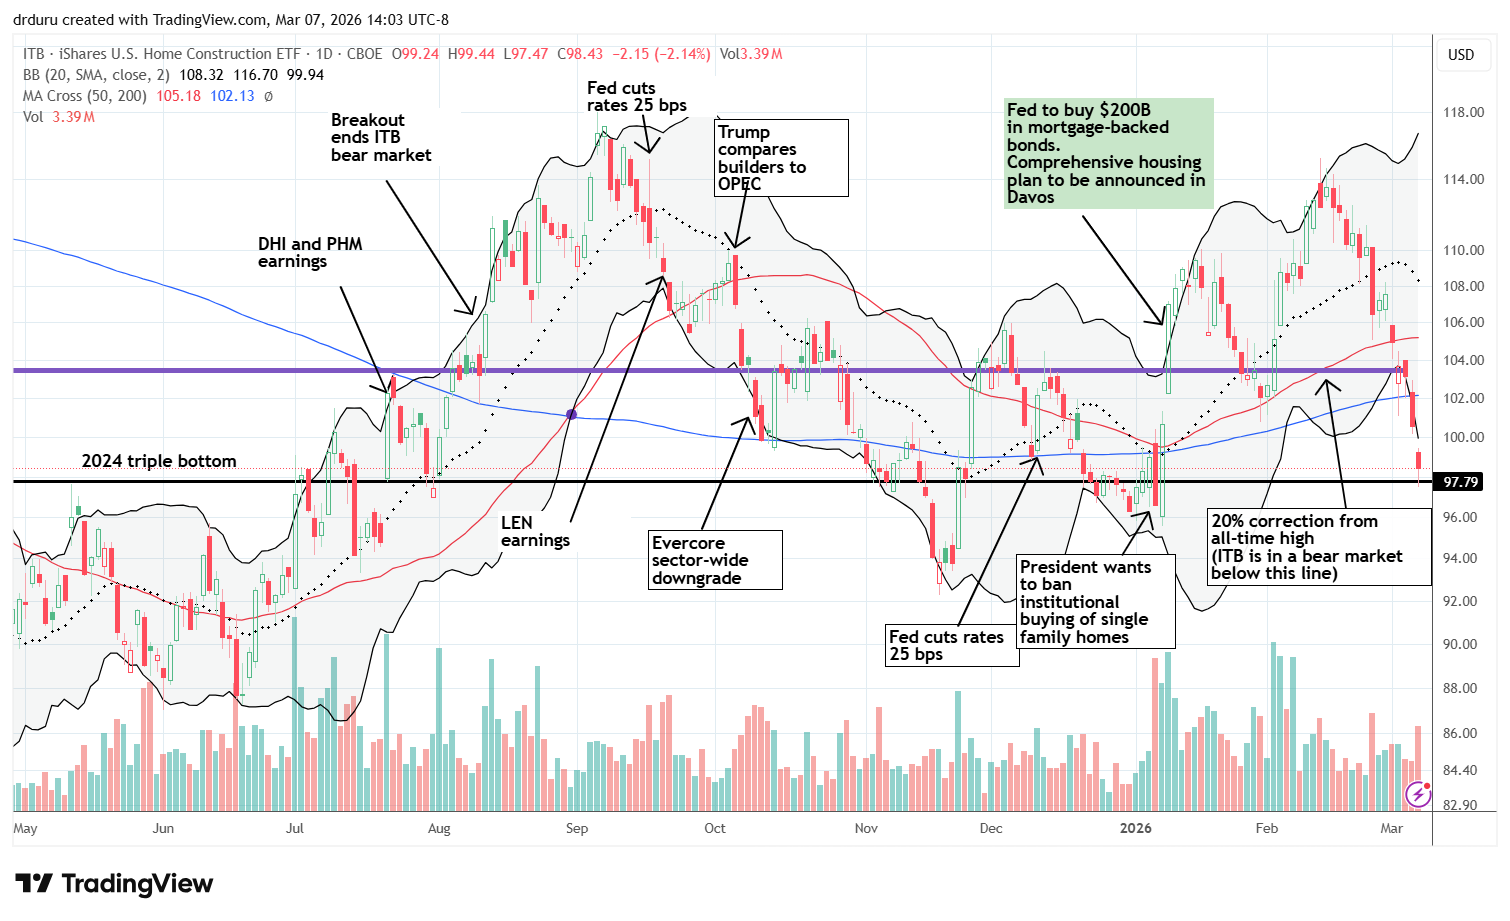
iShares U.S. Home Construction ETF (ITB)
Description: Tracks U.S. homebuilders and related housing companies including building materials suppliers and home improvement retailers.
Technical status: Rising interest rates forced iShares U.S. Home Construction ETF (ITB) right back into a bear market, ending the week testing support at its 2024 triple bottom.
Trade commentary: ITB’s latest trip into bear market territory has not changed my latest assessment on the housing market even with higher bond yields nudging mortgage rates higher. My seasonal trade on home builders is rule-based and independent of any news or special circumstances. However, I see no need to continue expanding current positions. The test of support at the 2024 triple bottom is a critical juncture for the trade.
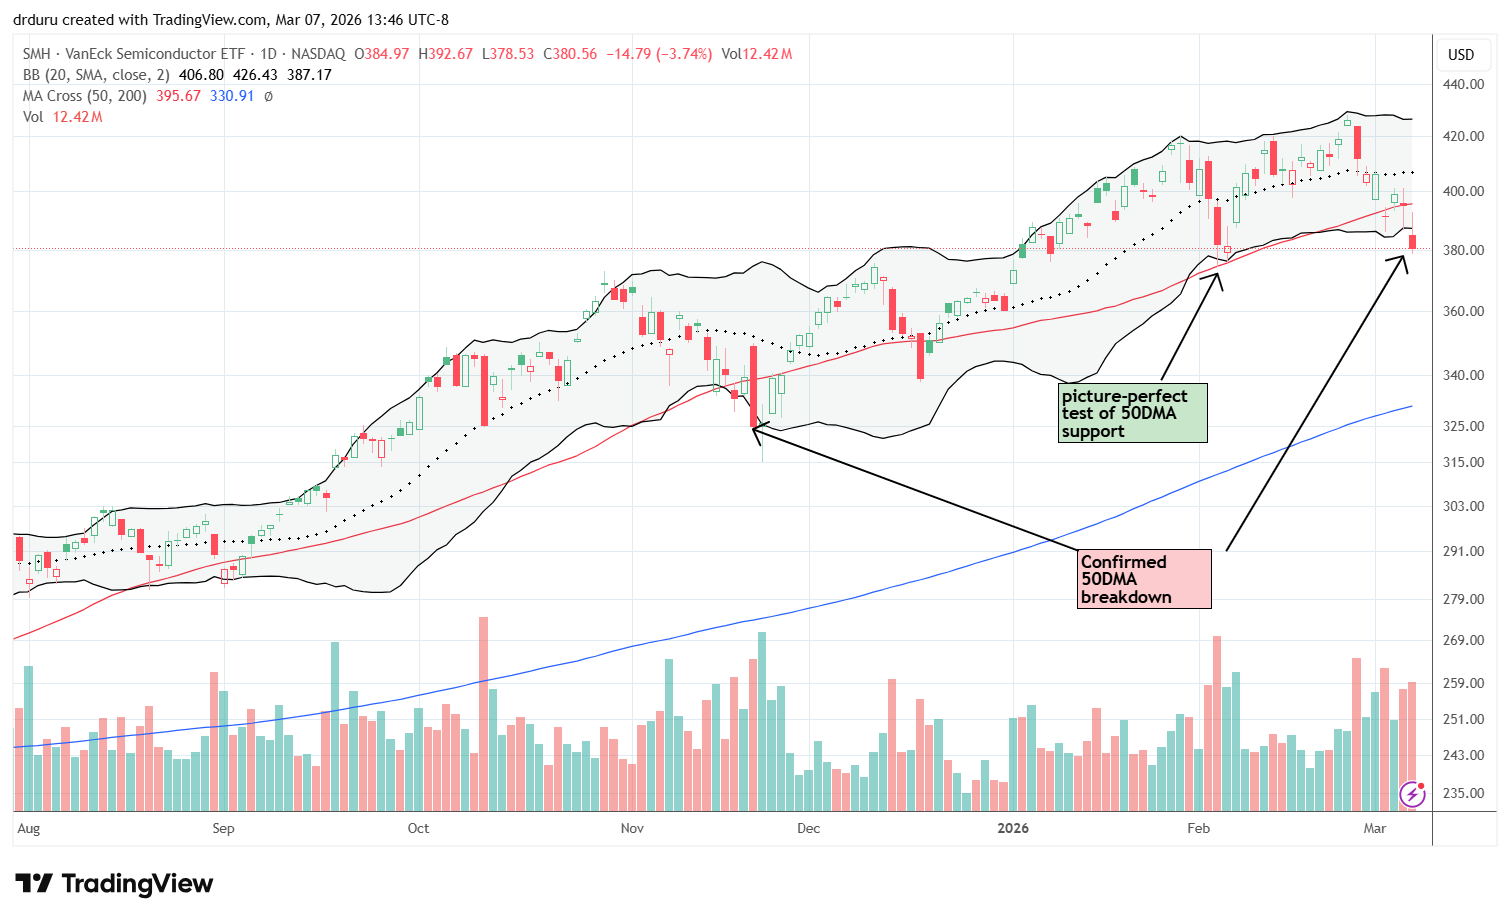
VanEck Semiconductor ETF (SMH)
Description: Tracks an index of major global semiconductor manufacturers and equipment companies, offering concentrated exposure to the semiconductor industry.
Technical status: VanEck Semiconductor ETF (SMH) suffered a 50DMA breakdown on news that Oracle and OpenAI ended plans to expand Stargate data center.
Trade commentary: The AI trade took a hit last week especially after the OpenAI and Oracle (ORCL) announcement. War also has a way of changing the kind of massive spending plans underway across the economy to support the AI-driven buildout. These effects should be temporary, but in the meantime, SMH has gone from looking exhausted to a bearish breakdown that signals a top. A close below February’s low would confirm a technical top.
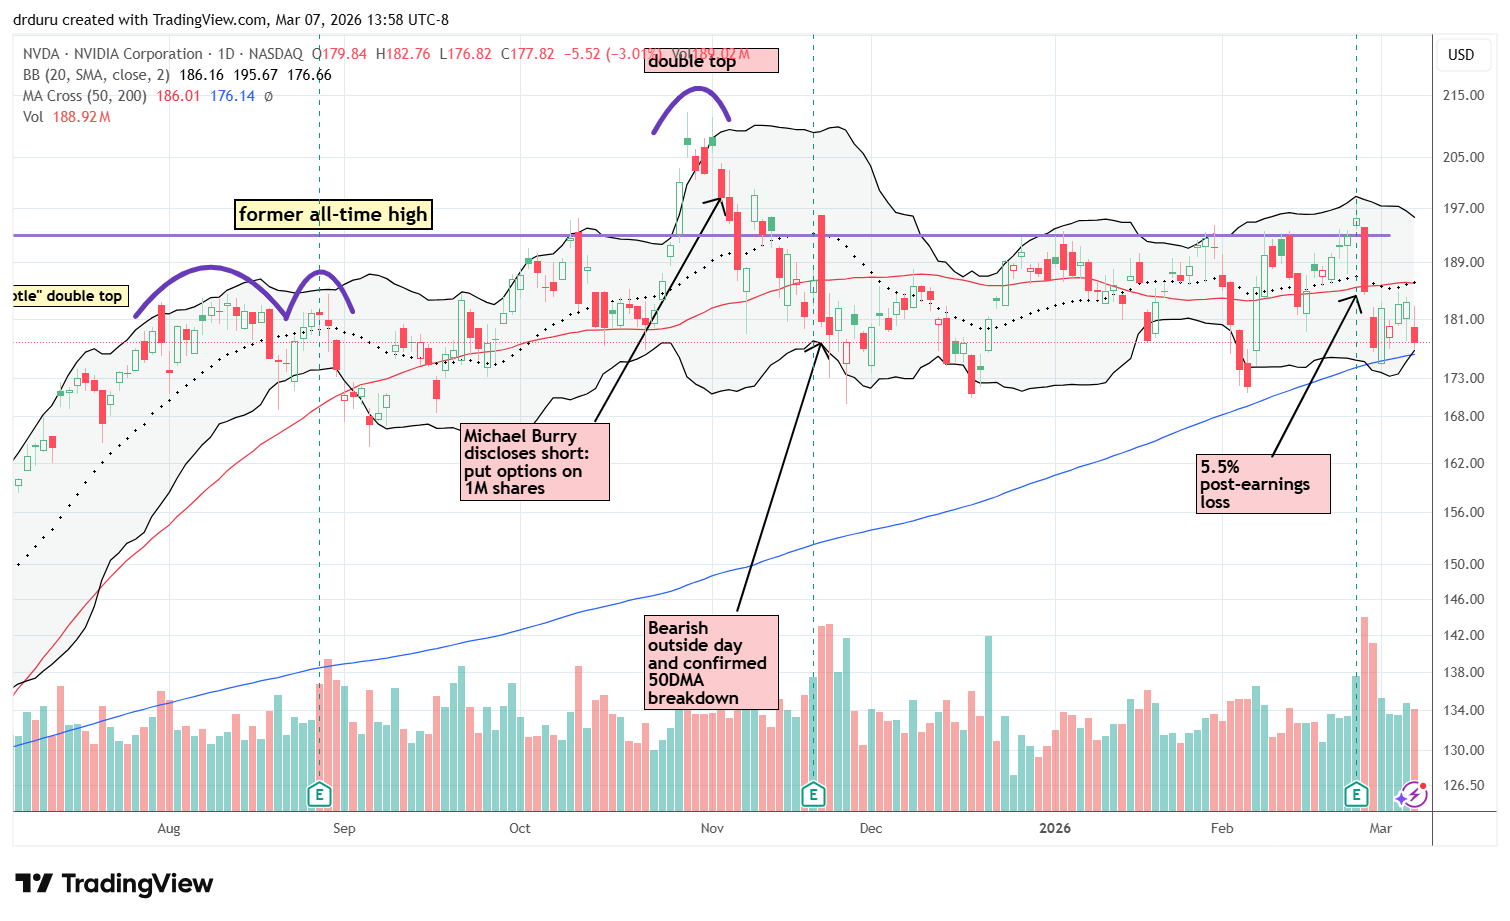
NVIDIA Corporation (NVDA)
Description: Designs graphics processing units (GPUs) and computing platforms used in gaming, data centers, artificial intelligence, and autonomous systems.
Technical status: NVIDIA Corporation (NVDA) started the week with a perfect test of 200DMA support but closed the week with a fresh test of support.
Trade commentary: NVDA is doing its best to keep SMH propped up. After NVDA perfectly rebounded from 200DMA support on Monday, the stock maintained a slight drift higher. Friday’s 3.0% loss on the OpenAI and ORCL news retested 200DMA support, making the technicals increasingly precarious for NVDA. Still, the stock has to break below its months long trading range before it confirms bearishness (below $168 or so).
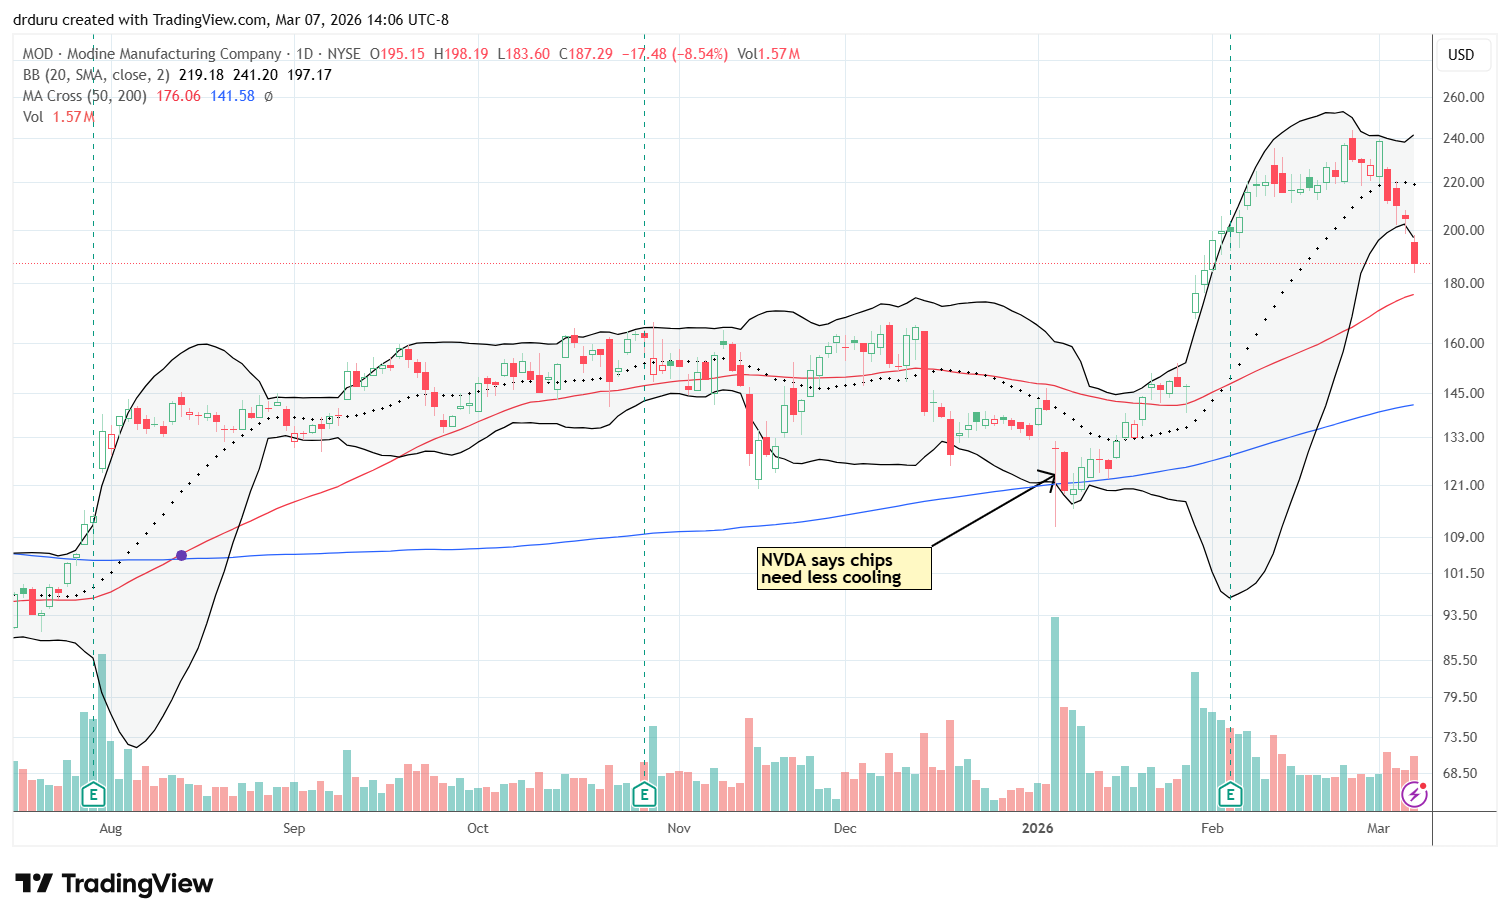
Modine Manufacturing Company (MOD)
Description: Produces thermal management and heating solutions, including cooling systems for data centers, industrial equipment, and commercial HVAC applications.
Technical status: Modine Manufacturing Company (MOD) sold off rapidly the last 4 days as the AI trade slows down and even tops out.
Trade commentary: With the AI trade topping out for now, I went into risk management mode. I locked in remaining profits in my position in cooling company SPX Technologies (SPXC). I also checked out the companies I let run away from me, Johnson Controls International (JCI) and MOD. Both stocks are topping out, but they remain in better technical position than SPXC which fell below its 50DMA. MOD and JCI are not only still above their 50DMAs but also remain in breakout territory. Whenever I get back to buying AI-related stocks, I will have MOD and JCI higher on the list than SPXC.
iShares Expanded Tech Software Sector ETF (IGV)
Description: Tracks a broad index of U.S. software companies, including application software, infrastructure software, and cloud-based platforms.
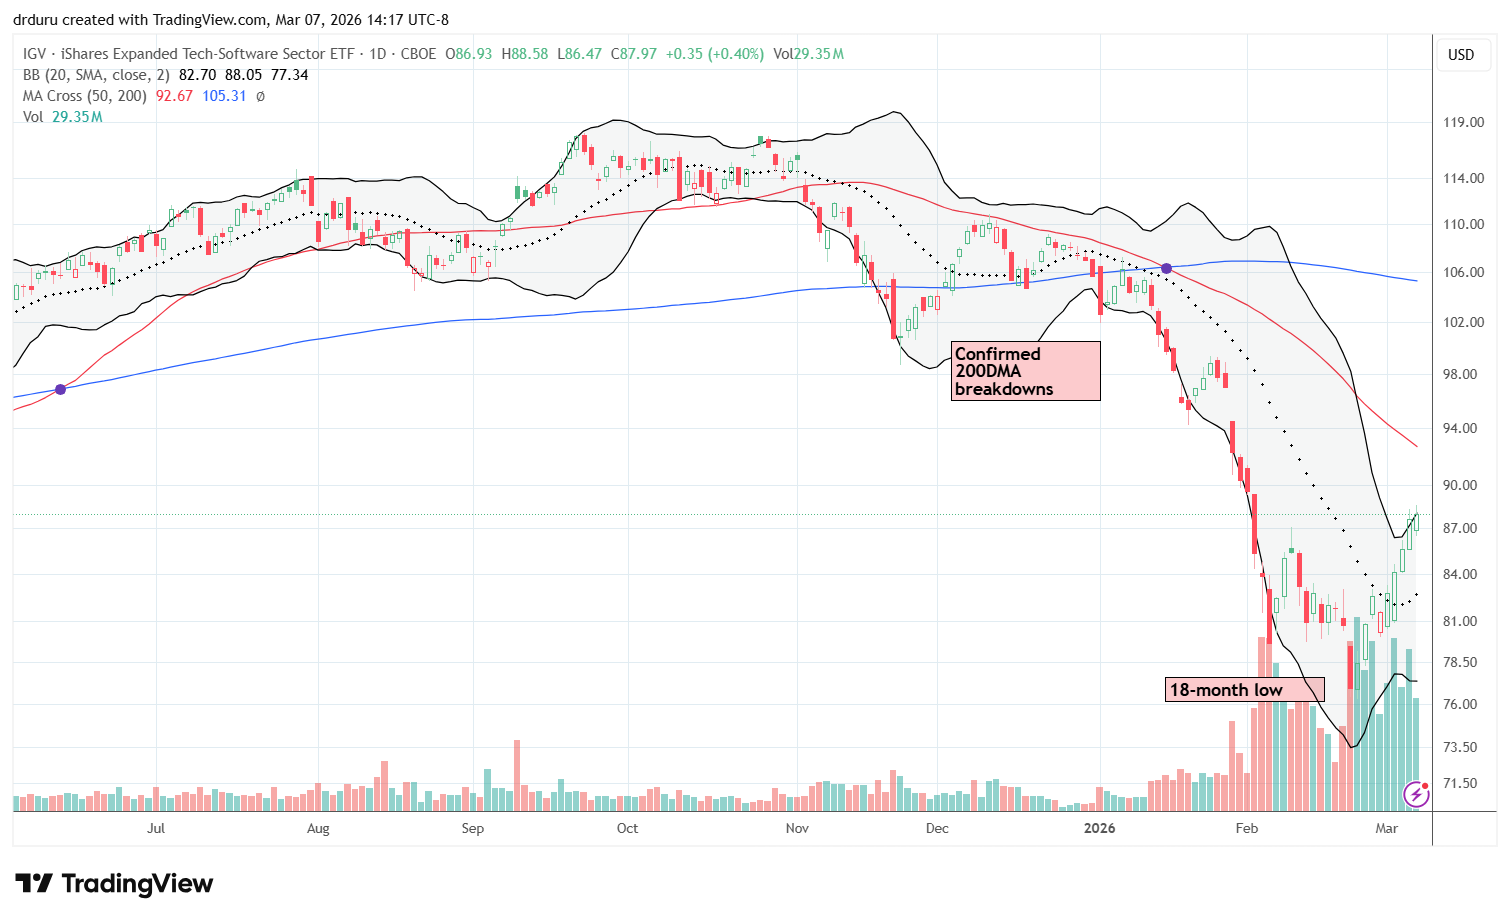
Technical status: The iShares Expanded Tech Software Sector ETF (IGV) has rallied in V-shaped fashion off an 18-month low and reversed all the losses from the last wave of AI Panic.
Trade commentary: IGV’s rally all week looked like a kind of trading poetic justice. IGV started the week with a 20DMA breakout, its first close above the 20DMA since December. Buyers never looked back. IGV gained every day of the week. I took profits on an IGV position, and I sold call options against two of my software positions that are contrarian AI Panic trades.
The trading volume on IGV is telling. While selling volume surged going into IGV’s bottom, the buying volume coming out of the bottom is ever higher. This is a classic sign of a bottom. However, I expect some kind of pullback soon especially as money rotates again.
Freshworks Inc (FRSH)
Description: Provides cloud-based customer engagement and IT service management software designed to help businesses manage support, sales, and marketing interactions.
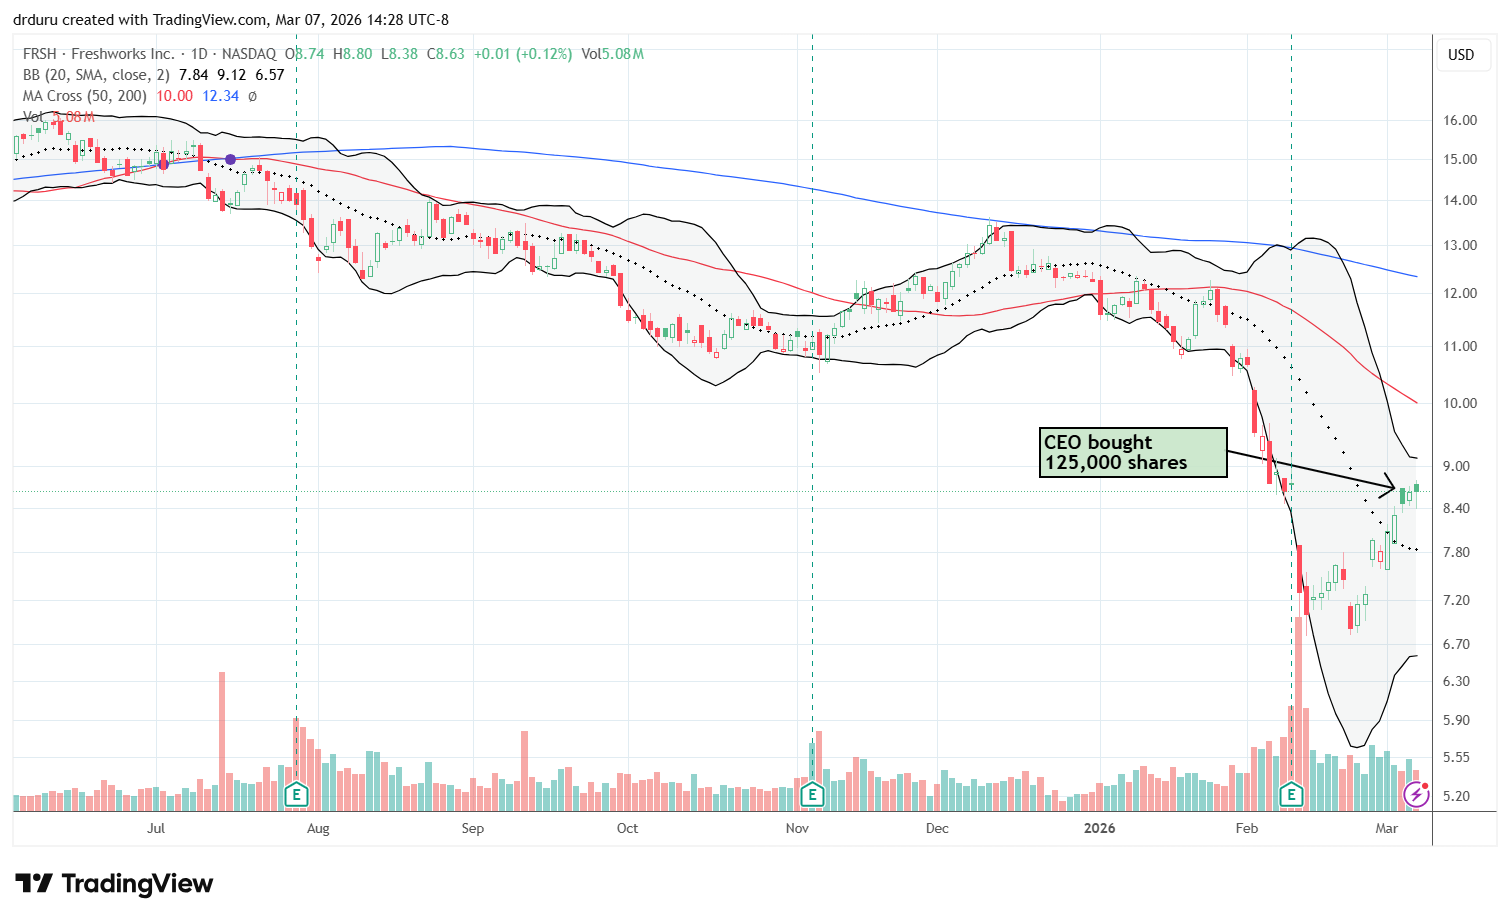
Technical status: Freshworks Inc (FRSH) finished reversing its 16.4% post-earnings loss after news that the company’s CEO bought 125,000 shares.
Trade commentary: FRSH returned to my radar last month, but I passed. The stock planted itself on my shopping list after I saw news of a significant purchase by the company’s CEO. I thought of FRSH as an AI play, but it is being treated more as a software play. Thus, FRSH benefited from the strong rebound in software stocks. I am looking to start buying on the next dip, hopefully to a test of 20DMA support.
Palantir Technologies, Inc (PLTR)
Description: Develops software platforms for data integration, analytics, and operational decision-making used by governments and enterprises to manage complex data environments.
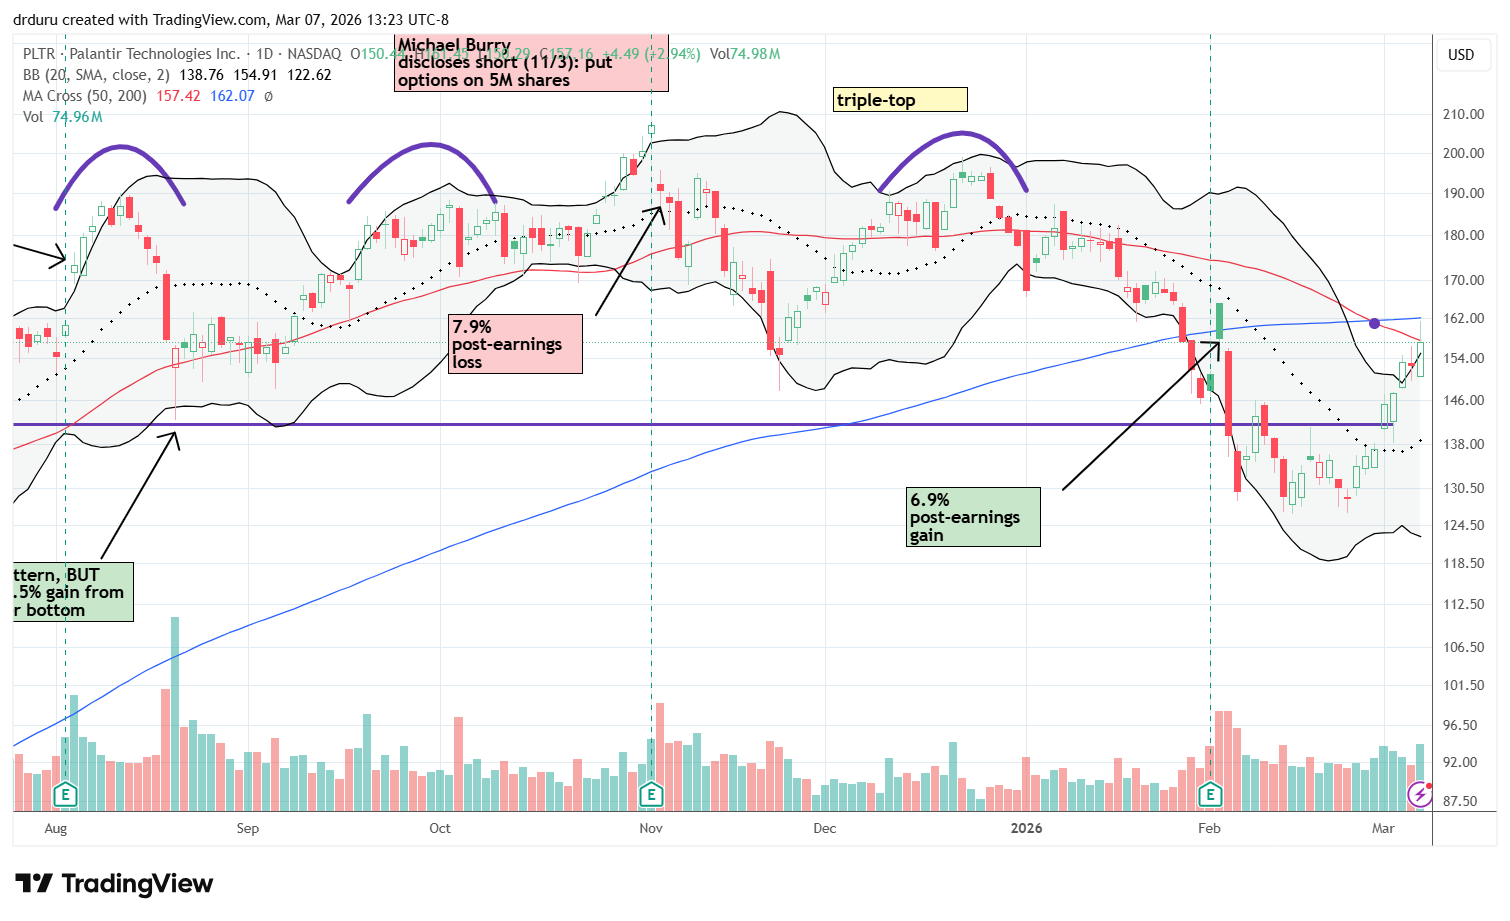
Technical status: Palantir Technologies, Inc (PLTR) rallied from a 9-month low for a breakout above the critical $142.34 level. I bought the breakout and took profits at 50DMA resistance.
Trade commentary: PLTR was my trade of the week. I jumped into a call spread after the stock jumped over support turned resistance at the $142.34 level (the horizontal line in the chart below). The stock steadily marched right to 50DMA resistance where I took profits. I will have to get fully bullish on PLTR if it manages to close above 200DMA resistance.
State Street Industrial Select Sector ETF (XLI)
Description: Tracks the industrial sector of the S&P 500, including companies involved in aerospace, machinery, transportation, and industrial services.
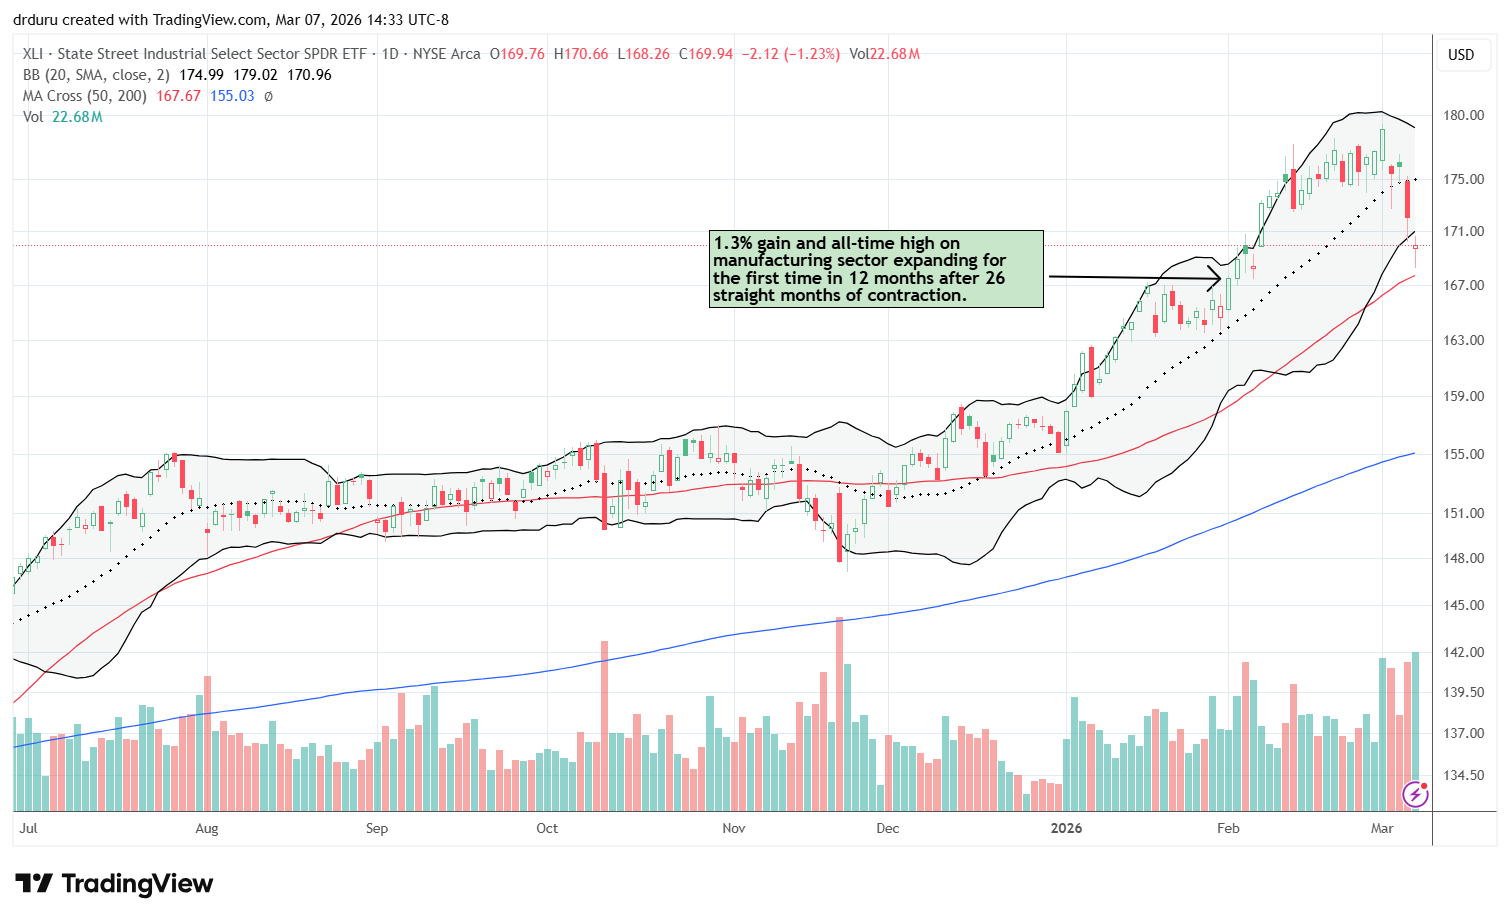
Technical status: The State Street Industrial Select Sector ETF (XLI) dropped sharply after a second breach of 20DMA support. Sellers stopped just short of testing 50DMA support.
Trade commentary: Market fears were so strong last week even a reliable winner like XLI wilted under the pressure. I added to a nascent position in XLI as it dropped toward 50DMA support. I made the case for XLI a month ago.
Be careful out there!
Footnotes
Subscribe for free to get email notifications of future posts!
“Above the 50” (AT50) uses the percentage of stocks trading above their respective 50-day moving averages (DMAs) to measure breadth in the stock market. Breadth defines the distribution of participation in a rally or sell-off. As a result, AT50 identifies extremes in market sentiment that are likely to reverse. Above the 50 is my alternative name for “MMFI” which is a symbol TradingView.com and other chart vendors use for this breadth indicator. Learn more about AT50 on my Market Breadth Resource Page. AT200, or MMTH, measures the percentage of stocks trading above their respective 200DMAs.
Active AT50 (MMFI) periods: Day #165 over 20%, Day #54 over 30% (overperiod), Day #1 under 40% (underperiod ending 51 days over 40%), Day #4 under 50%, Day #12 under 60%, Day #138 under 70%
Source for charts unless otherwise noted: TradingView.com
Full disclosure: long IWM shares, calls, and calendar call spread; long IBIT, long BTC/USD, long XLI, long USO puts and calendar put spreads, long TLT, long SMH, long ITB
FOLLOW Dr. Duru’s commentary on financial markets via StockTwits, BlueSky, and even Instagram!
*Charting notes: Stock prices are not adjusted for dividends. Candlestick charts use hollow bodies: open candles indicate a close higher than the open, filled candles indicate an open higher than the close.
* Blog notes: this blog was partially written based on the heavily edited transcript of the following video that includes a live review of the stock charts featured in this post. I used ChatGPT to process the transcript.
Duru:
Anyone who isn’t a long term investor shouldn’t be buying much of anything in this market. Between the war and this AI lunacy, many stocks and sectors are behaving like a casino. They could be up big one day and down even bigger the next, or vice versa. Tomorrow’s looking like it could be nasty as well.
But this, like all the other crises we’ve been through, will pass. In the meantime, it’s a good time to slowly load up on quality stuff. That’s always worked in the past. However, as we know, this thing could go lower for longer, depending on how the war goes, and even with a rebound if the war ends (whatever that means), there could be enough resultant inflation to halt the Fed’s interest rate reductions for some time. That could seriously protract a market recovery. But ultimately, it will recover. Fear is good for long term investors…..
As they say, pick your spots.
Unfortunately it seems we are in for years of rolling crises. Last year, tariffs. This year, war. By next year and certainly the year after, an AI panic about jobs shold be in full swing.