Stock Market Commentary
The stock market has a natural law of “physics.” Overly enthusiastic trading, whether up or down, eventually meets an opposite and sometimes equal force. This natural instability of extremes forms a basis of my market breadth trading rules. The enthusiastic post-election surge exhausted buyers enough to create a post-election reversal. Moreover, my market breadth indicator flagged the potential onset of a post-election reversal. The major indices that I track each returned to or below their post-election opens. The follow-through selling from the market breadth signal once again confirmed the usefulness of this technical signal despite an overall unrelenting bull market this year.
The Stock Market Indices
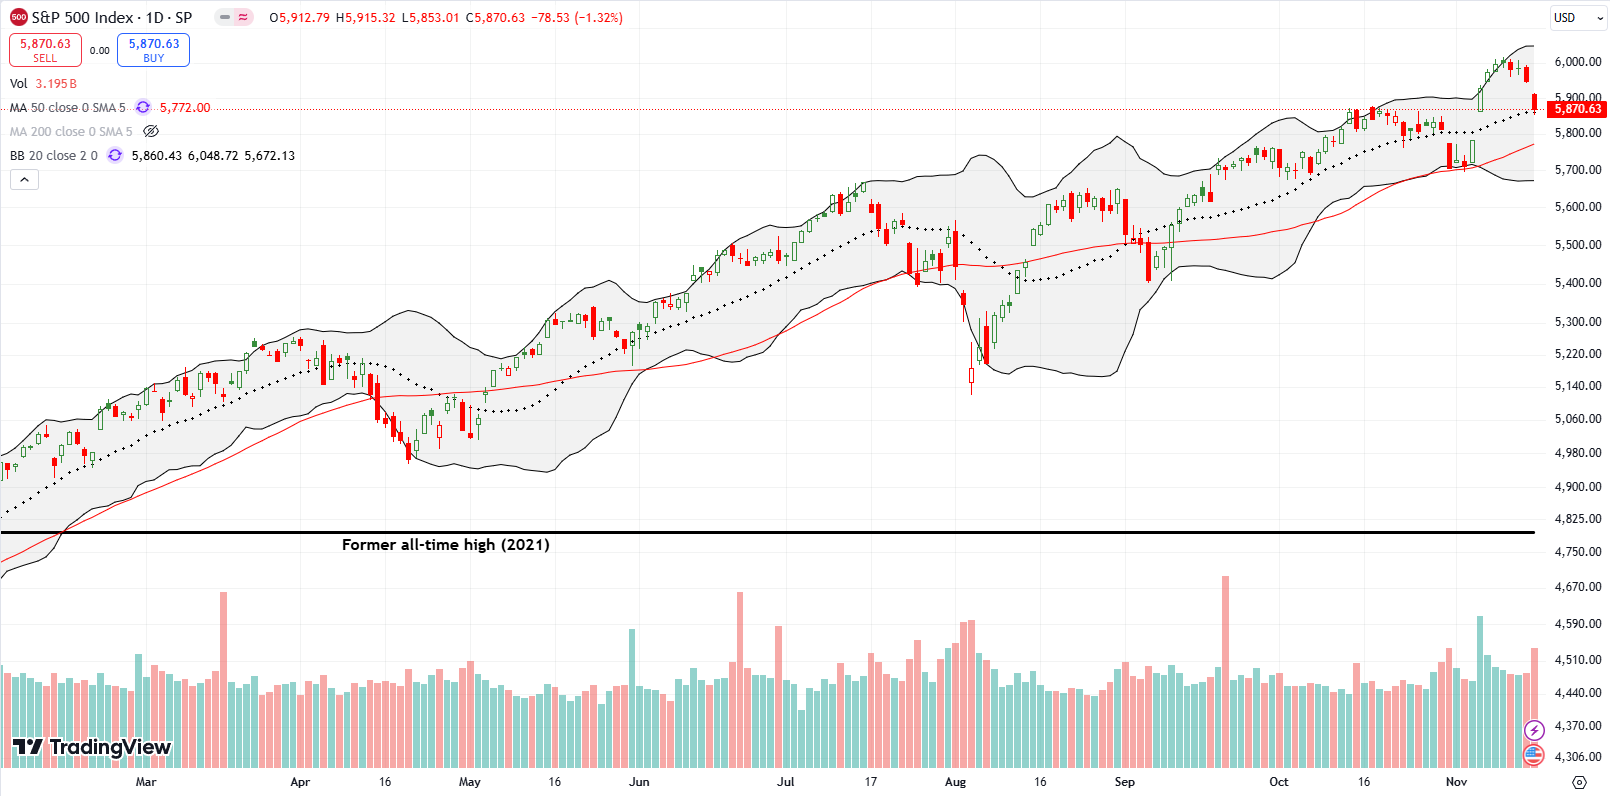
The S&P 500 (SPY) closed the week right where it started trading post-election. This post-election reversal took the index to a test of support at the 20-day moving average (DMA) (the dashed line below) and the previous all-time high from October. A test of 50DMA support would coincide with the index’s pre-election close. Thus, further losses seem likely.
However, bears and sellers have proven quite incapable of sustaining pressure on the stock market all year. Accordingly, I took profits on a timely put option I bought on SPY after my favorite technical indicator flashed a fresh bearish warning. This profit-taking was consistent with my expectations from my last Market Breadth post: “at best, sellers in the short-term may reverse all the ‘surplus’ gains from the gap open on Wednesday.” Those surplus gains are now gone.
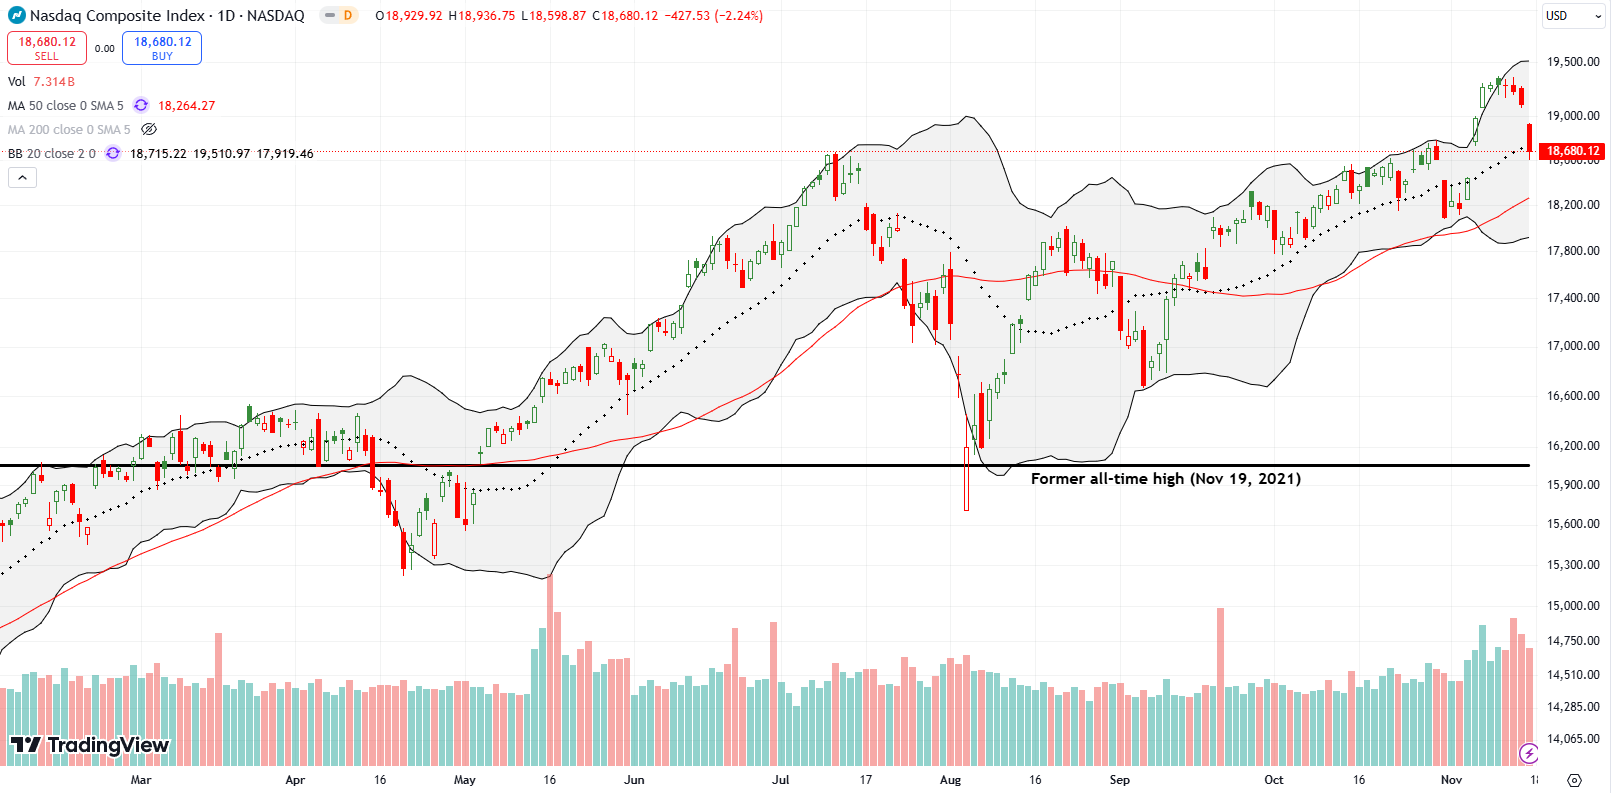
The NASDAQ (COMPQX) fared slightly worse than the S&P 500. Support at the 20DMA failed to hold as the tech-laden index was more attracted to testing support at the double-top formed across July and October. The NASDAQ also looks more likely than the S&P 500 to complete a reversal of post-election gains since the price action has already pierced into the post-election gap higher.
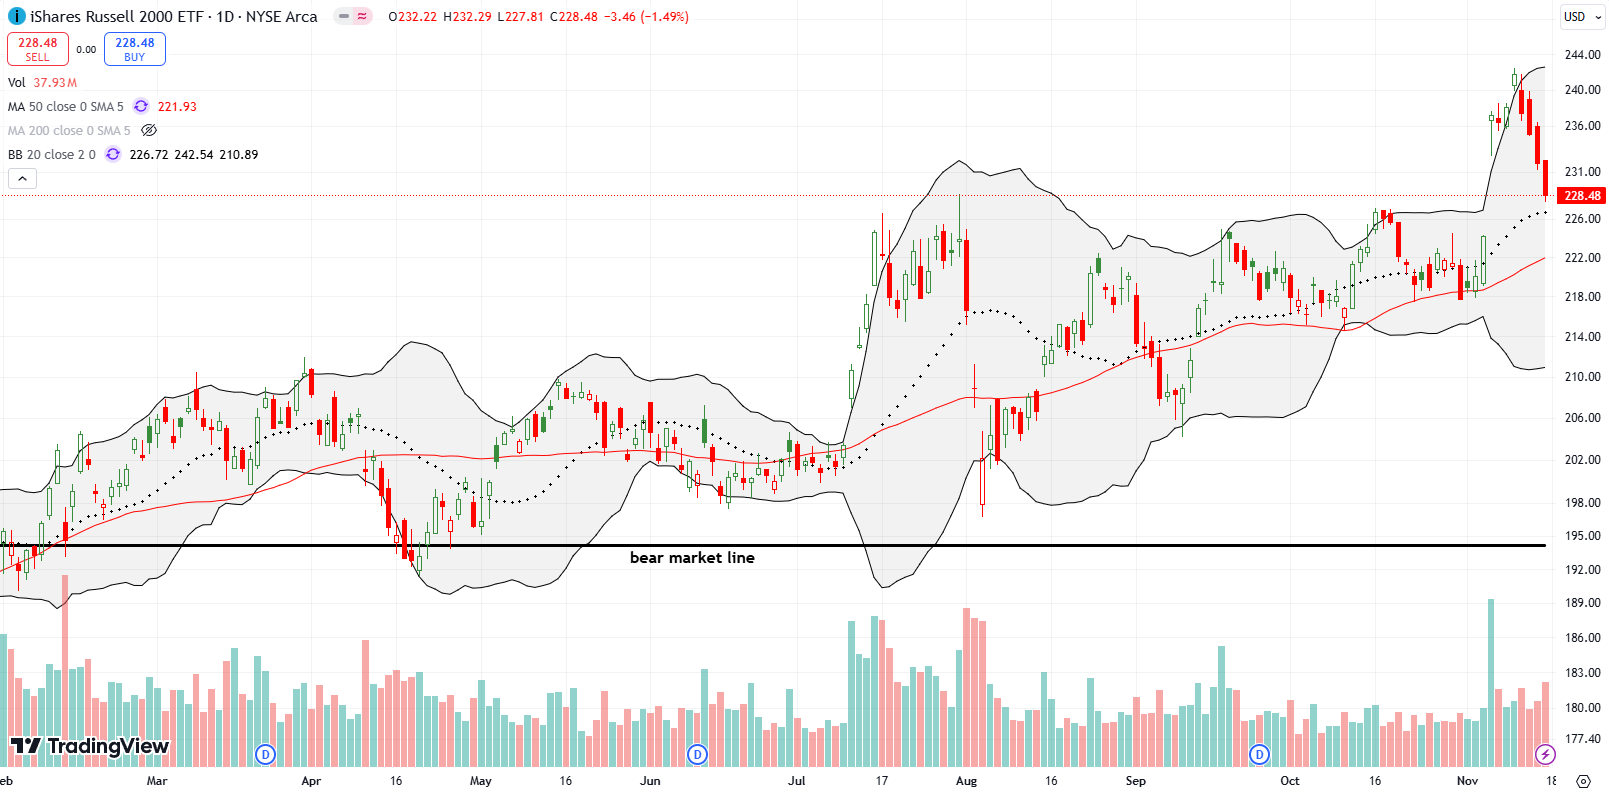
The iShares Russell 2000 ETF (IWM) sold off sharply the last 4 days of last week. The ETF of small caps plunged deeply into its impressive post-election gap and looks in danger of a fresh test of 50DMA support (the red line). Note how IWM closed right on top of the intraday high in July that formed part of a blow-off top at the time.
I am of course disappointed given the sizeable longer-term position I have in IWM. I decided IWM got close enough to 20DMA support to justify buying a speculative call option (expiring in 2 weeks).
The Short-Term Trading Call With A Post-Election Reversal
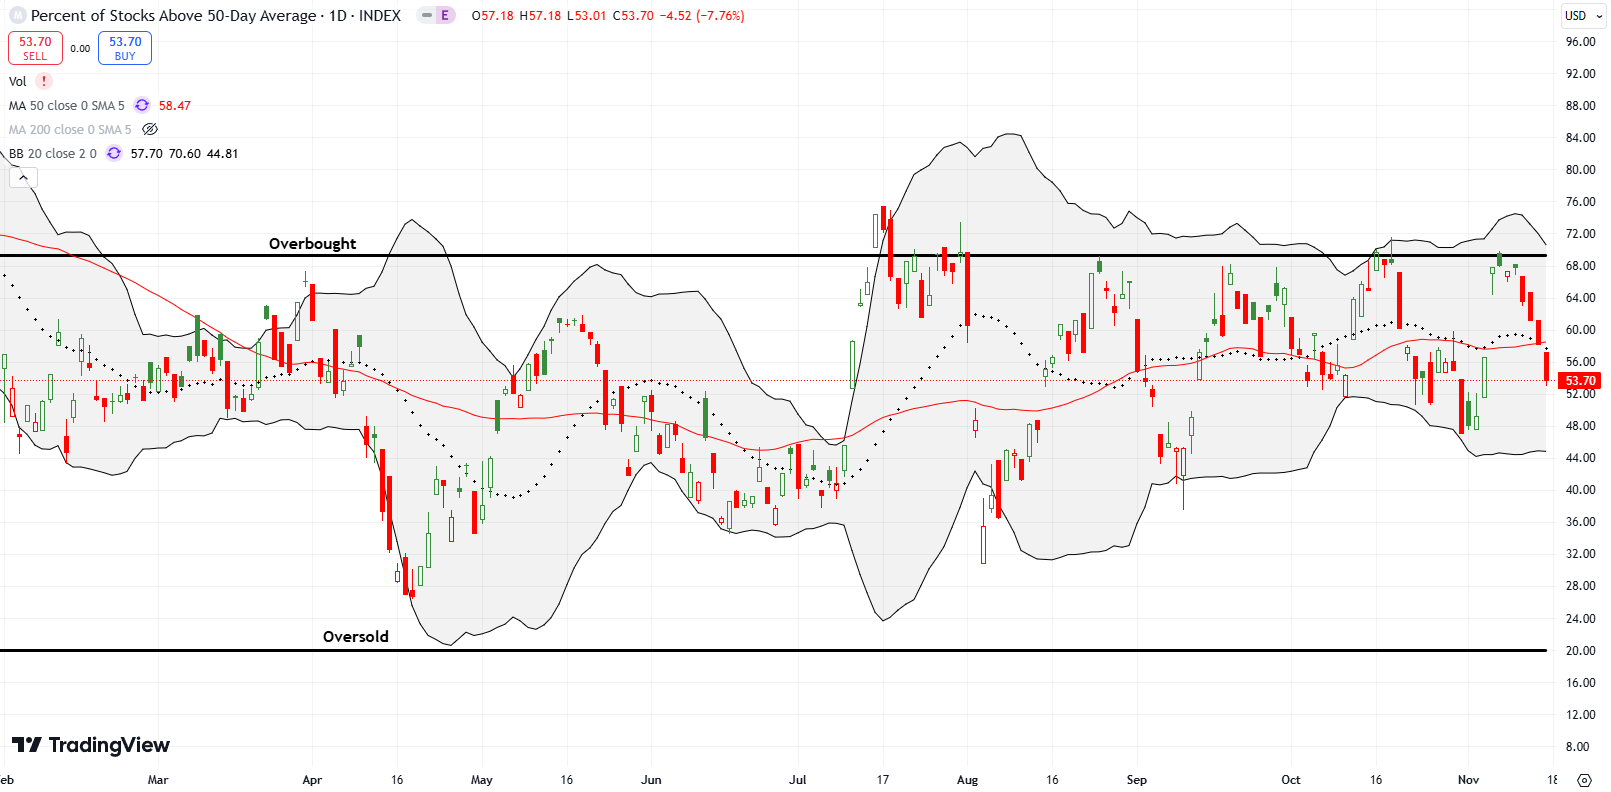
- AT50 (MMFI) = 53.7% of stocks are trading above their respective 50-day moving averages
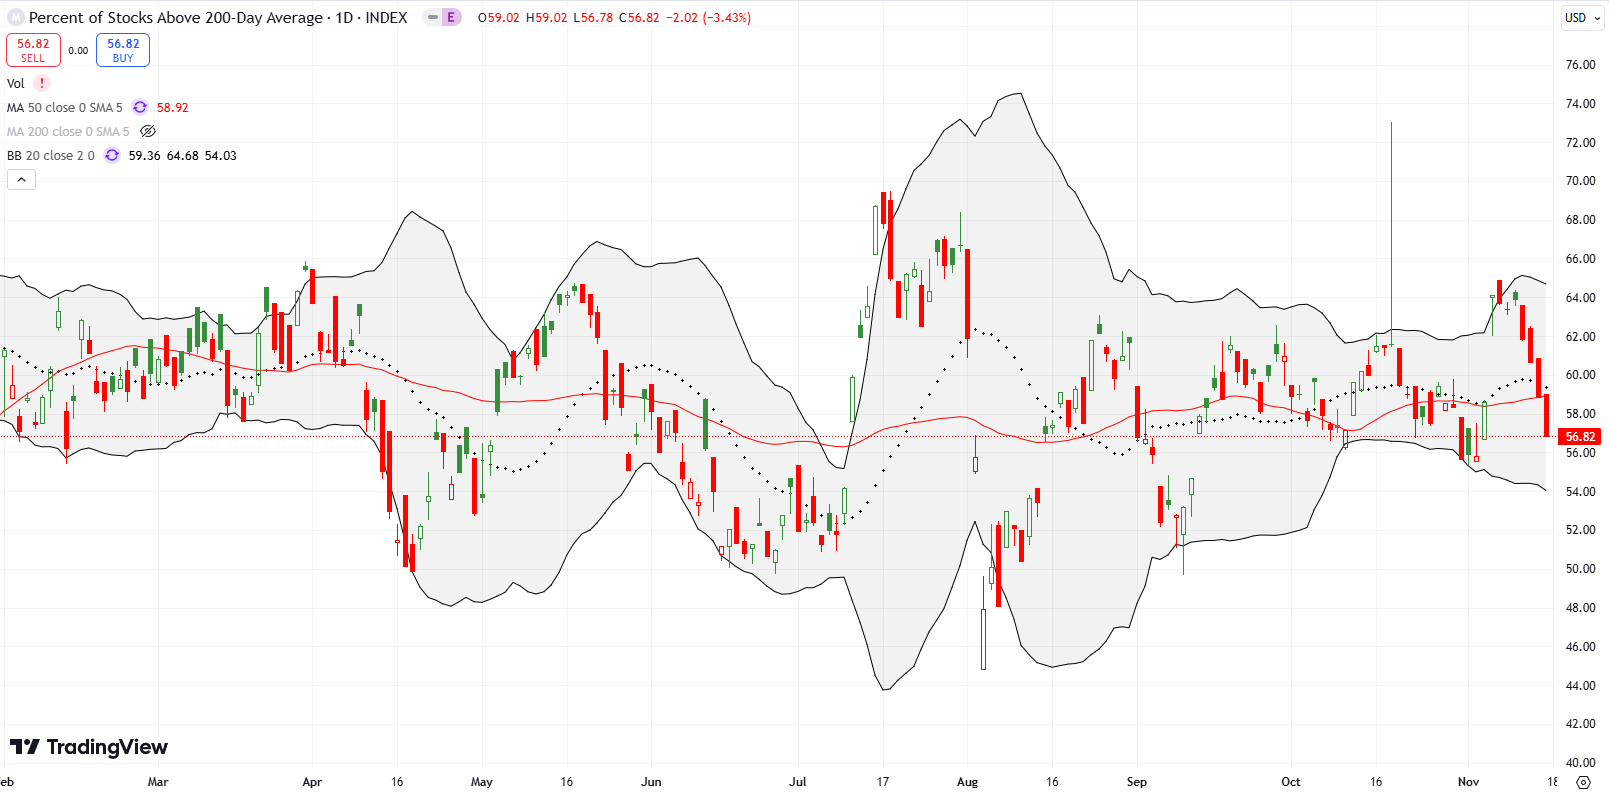
- AT200 (MMTH) = 56.8% of stocks are trading above their respective 200-day moving averages
- Short-term Trading Call: neutral
AT50 (MMFI), the percentage of stocks trading above their respective 50DMAs, plunged along with IWM. My favorite technical indicator opened the week at 68.2% and closed the week at 53.7%. Per the AT50 trading rules, I flipped (cautiously) bearish as soon as AT50 faded from the overbought threshold at 70%. Yet, I did not aggressively pursue bearish opportunities. I have even flipped the short-term trading call right back to neutral. As I stated in my last Market Breadth post: “like so many other bearish periods this year, I expect to find few convincing short opportunities that offer good risk/reward.” I already took profits on my SPY put and hold just a few open bearish positions (for example, see below).
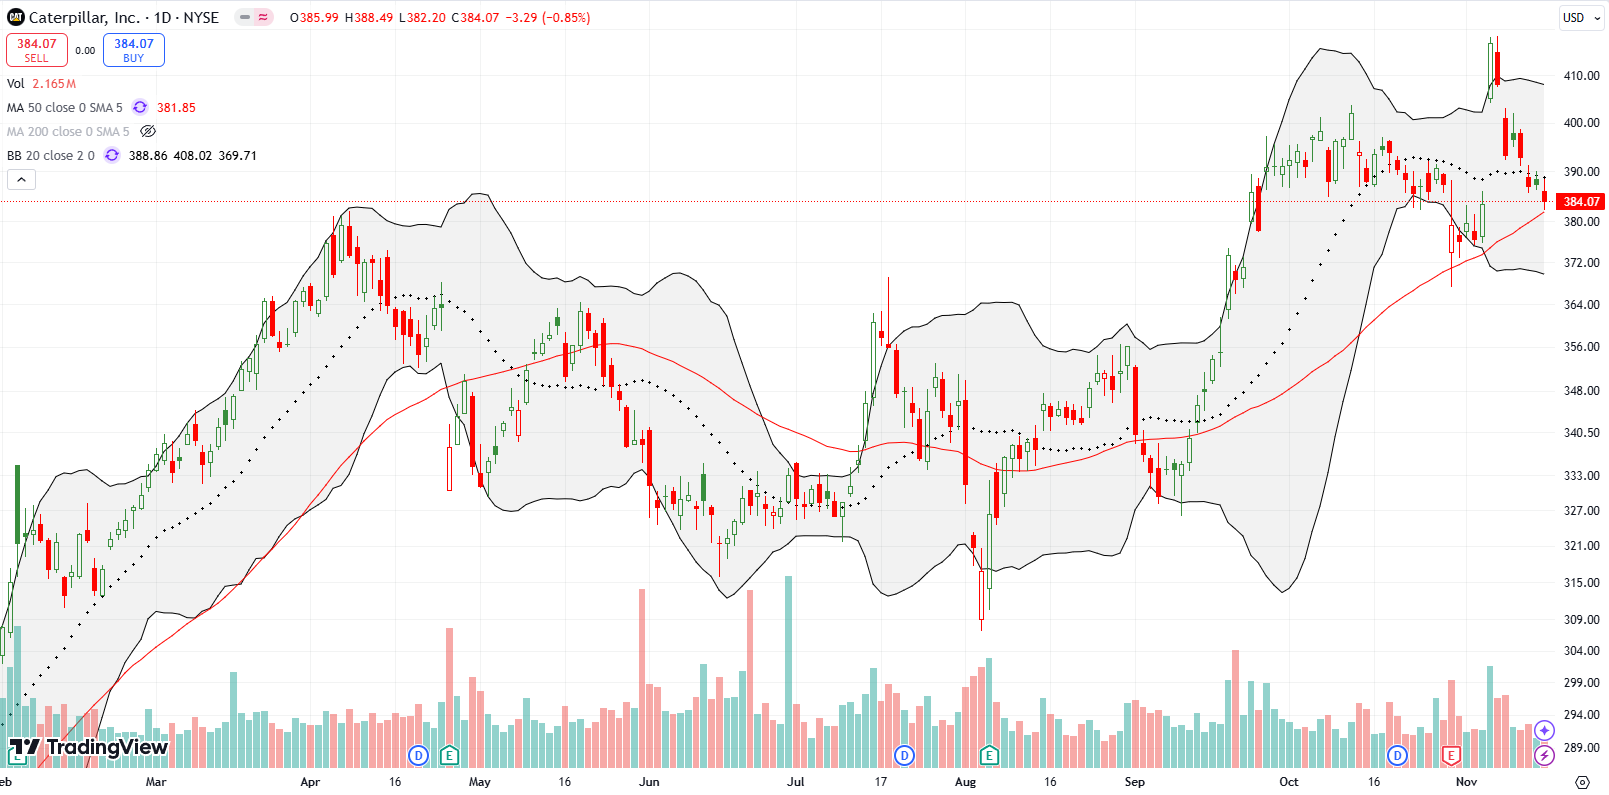
Interestingly, Caterpillar, Inc (CAT) may have provided the first early warning signal of a pullback. CAT surged 8.7% post-election to a new all-time high. I was surprised by the move since future trade wars could hurt CAT’s international business. After rallying to an all-time high in January, 2018, CAT spent the remainder of Trump’s administration in decline. Perhaps the market’s memory is short on this one. Mine is not. I just wish I had noted the potential for a blow-off top given CAT stretched so high above its upper Bollinger Band (BB). Two days of subsequent selling confirmed the blow-off top and now CAT faces a major test at its uptrending 50DMA.
I stopped using CAT as a hedge against bullishness a while back (or even a first trade in a bearish phase). Now, I am likely to get back to fading CAT rallies. I will also chase CAT lower on a 50DMA breakdown.
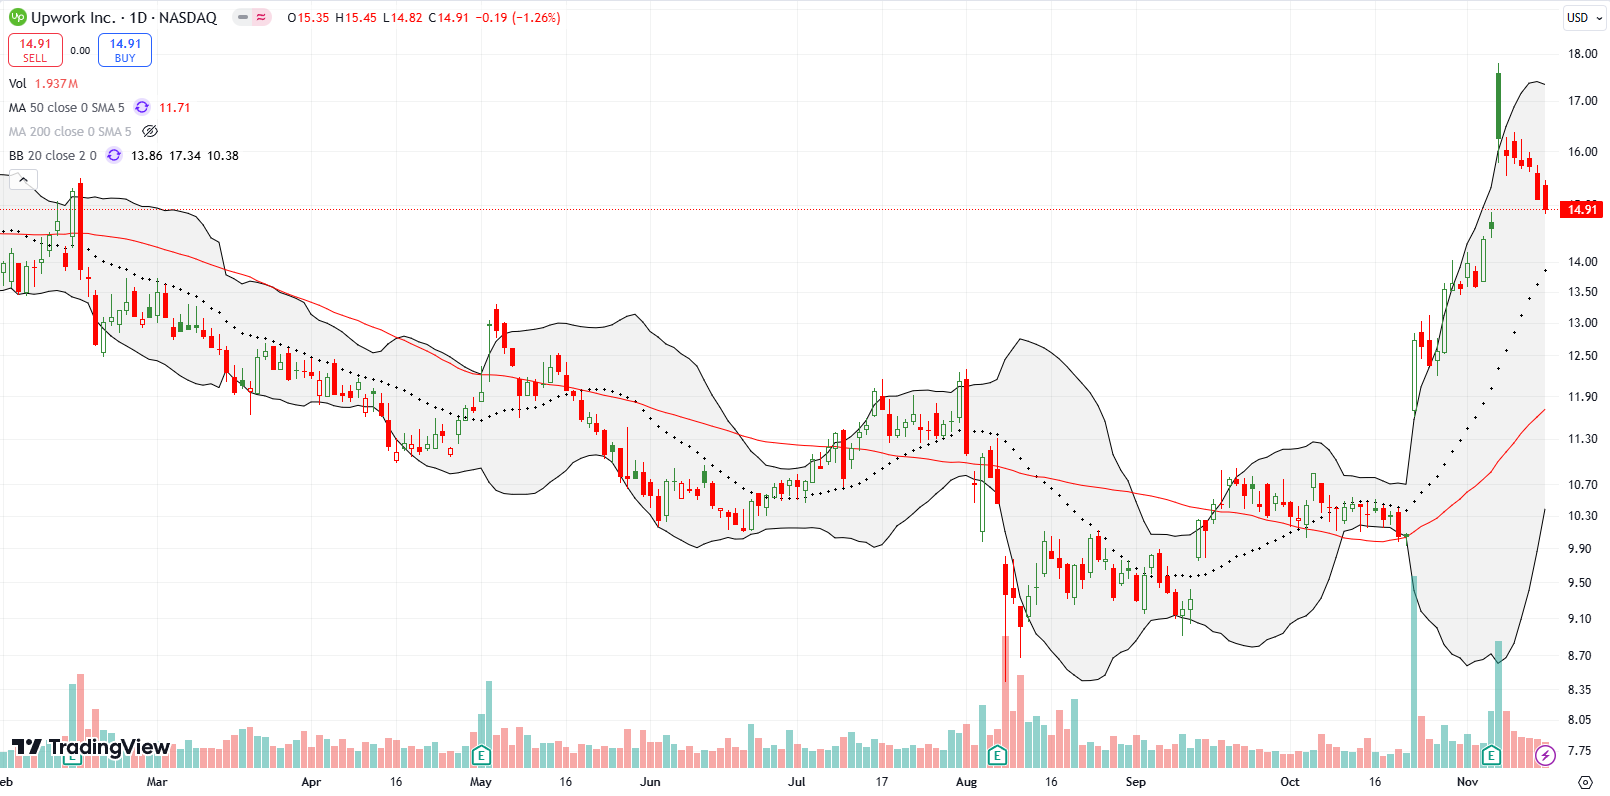
Upwork Inc (UPWK) joined a group of stocks that quickly reversed post-earnings gains that occurred in the early post-election period. I am eyeing UPWK for a potential buy on confirmed 20DMA support. If that support fails, UPWK will be at immediate risk of a deeper sell-off to 50DMA support. In the meantime, the previous week’s post-earnings surge is looking like a blow-off top.
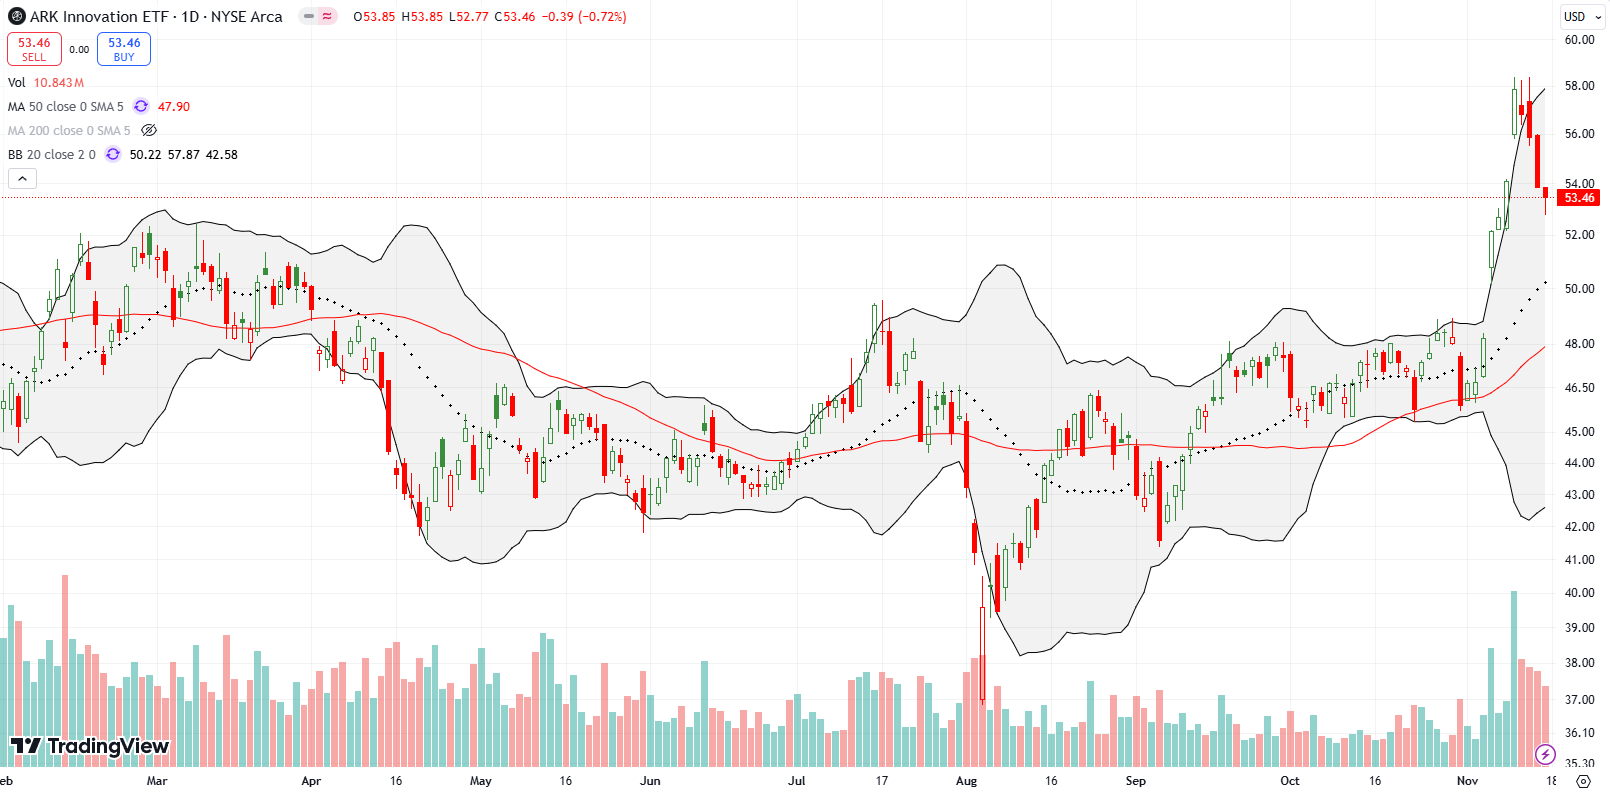
ARK Innovation ETF (ARKK) is still holding some of its post-election gains despite falling sharply for most of the week. ARKK started the week with a 7.0% gain to a 2 1/2 year high. I thought ARKK might test resistance at its pre-pandemic high at $60.68. Instead, ARKK ended the week with a small loss. I am back to my ARKK trading strategy buying shares and selling weekly calls against them. I will sell a fresh call on a rally, and I will add a fresh covered call position on a test of 20DMA support.
ARK’s Cathie Wood appeared on CNBC on Friday where the host challenged her to defend a losing record that has cost billions of shareholder value. Wood deftly avoided a direct answer by picking choice points of comparison: her fortunate timing in buying Nvidia (NVDA), Tesla (TSLA), and Bitcoin (BTC/USD) early.
“I would say we’re at the flip side today of where we were in the late 2021 period. We were saying back then hold some powder dry. That didn’t happen, flows just gushed in. Today we’re in the opposite situation. We’ve been great on Tesla, Bitcoin, Nvidia at 40 cents was our first purchase.”
Notice the subtlety: Wood essentially blamed the shareholder losses on a surplus of funds that chased ARK performance at the top. Wood went on to talk about the future gains she expects to make speculating on CRISPR technologies.
Wood concluded with reorienting thinking about the function of her funds.
“…we have a volatile fund. We should not be a huge slice of any portfolio. We are more of a satellite strategy now although we think this is the way the world is going….if you take out that boom bust in around COVID which caused all kinds of interesting behaviors, you will look at for the flagship [ARK] you’ll see a fund that has based for six years….we think we’re a very good complement to the broad-based benchmarks out there because we don’t look anything like them and truth will win out.”
This (new?) perspective fascinates me because Wood has regularly insulted “closet indexers” who chase the performance of the major indices. She has also regularly insisted that her investments (I call them speculations) in innovation will beat out the big, sluggish incumbents in the NASDAQ.
Anyway, I will continue to use ARK funds as a complement by trading them. If ARKK (and other ARK funds) ever regain favor, I should have at least some holding at the point of lift-off.
Finally, Wood provided post-election commentary where she found analogs to the days of President Ronald Reagan. I will save a full critique for a later post. For now, suffice to say I think Wood will be proven mostly wrong. She is overly enamored with prospects for deregulation. Wood also did not notice Reagan’s 8-year run started with a stock market that was just breaking out after having gone nowhere (on net) for about 14 years or so. Trump is starting with one of the greatest bull markets of all time…which means there are a lot of potential downside risks ahead as major economic changes unfold.
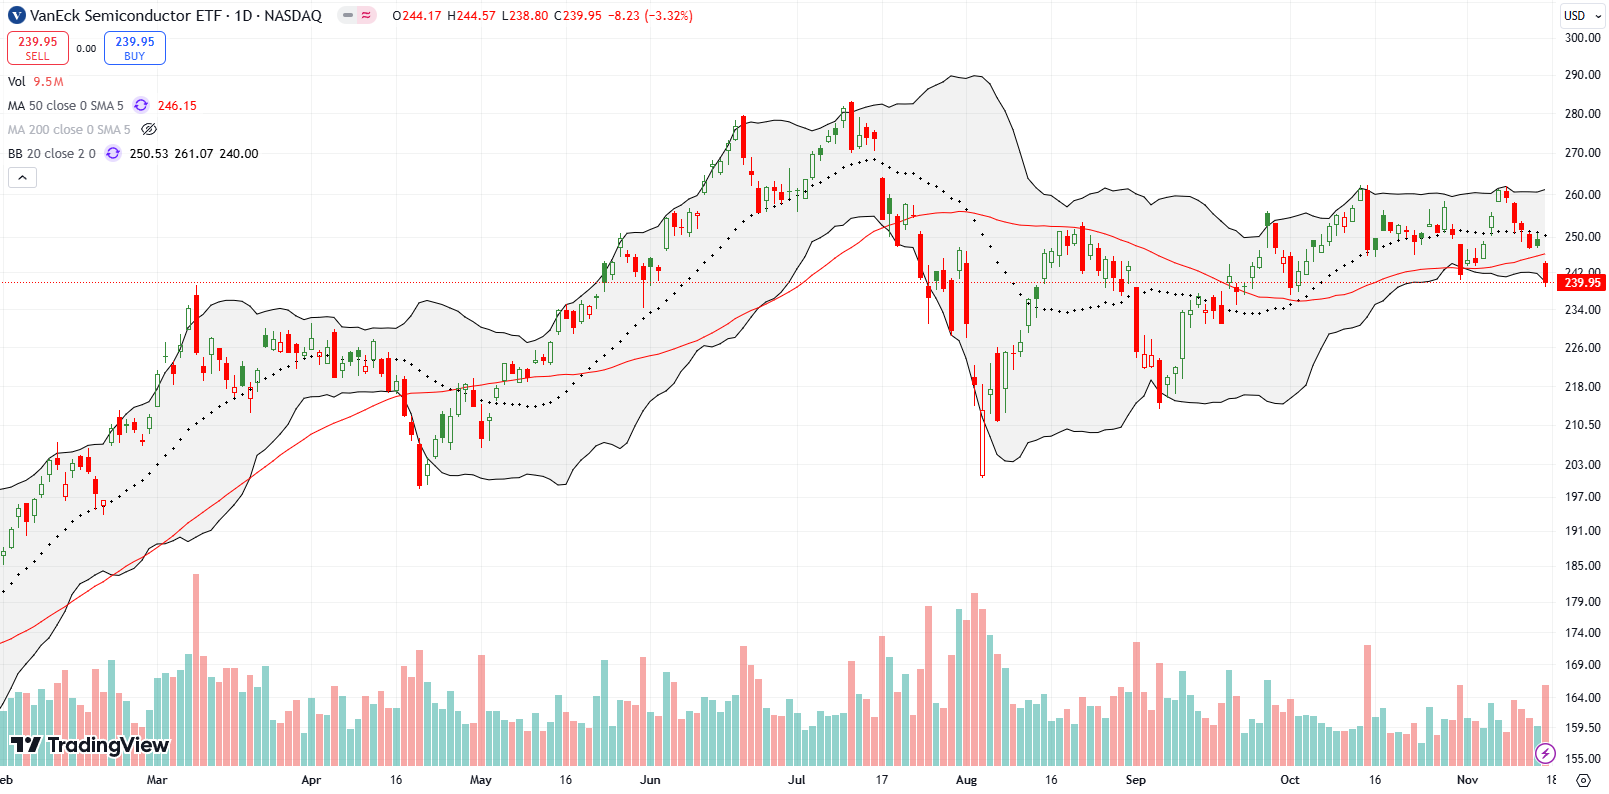
The VanEck Semiconductor ETF (SMH) is a surprising weak spot of the stock market. SMH only received 2 days of post-election gains before buyers exhausted themselves. SMH ended last week with a 50DMA breakdown and 6-week low. A lower close would put SMH in confirmed bearish territory and would make the summer’s double top look even more ominous.
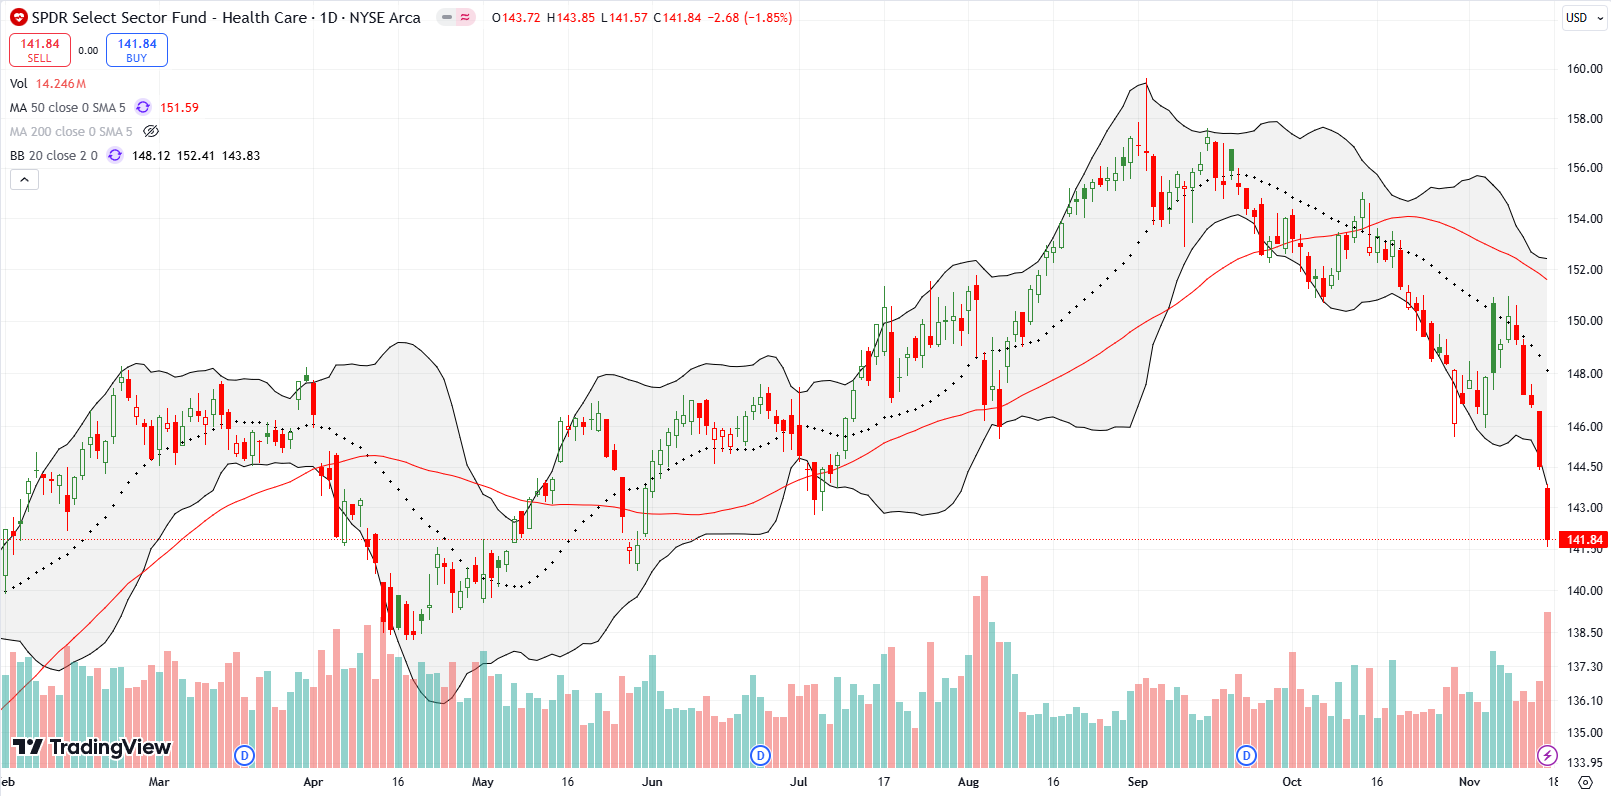
The SPDR Select Sector Fund (XLV) gapped higher after the election but ominously faded from 20DMA resistance to a near flat close. A 2-day rebound also failed at 20DMA resistance. The sellers were in control all week, punctuated by the controversial pick for Robert F. Kennedy to head the Department of Health and Human Services (HHS). XLV is back to where it traded at the beginning of summer. I opened a strangle position with calls and puts. While XLV is likely to trade lower, I can also see a scenario with a deadcat bounce as “bargain hunters” scoff at the negative headlines.
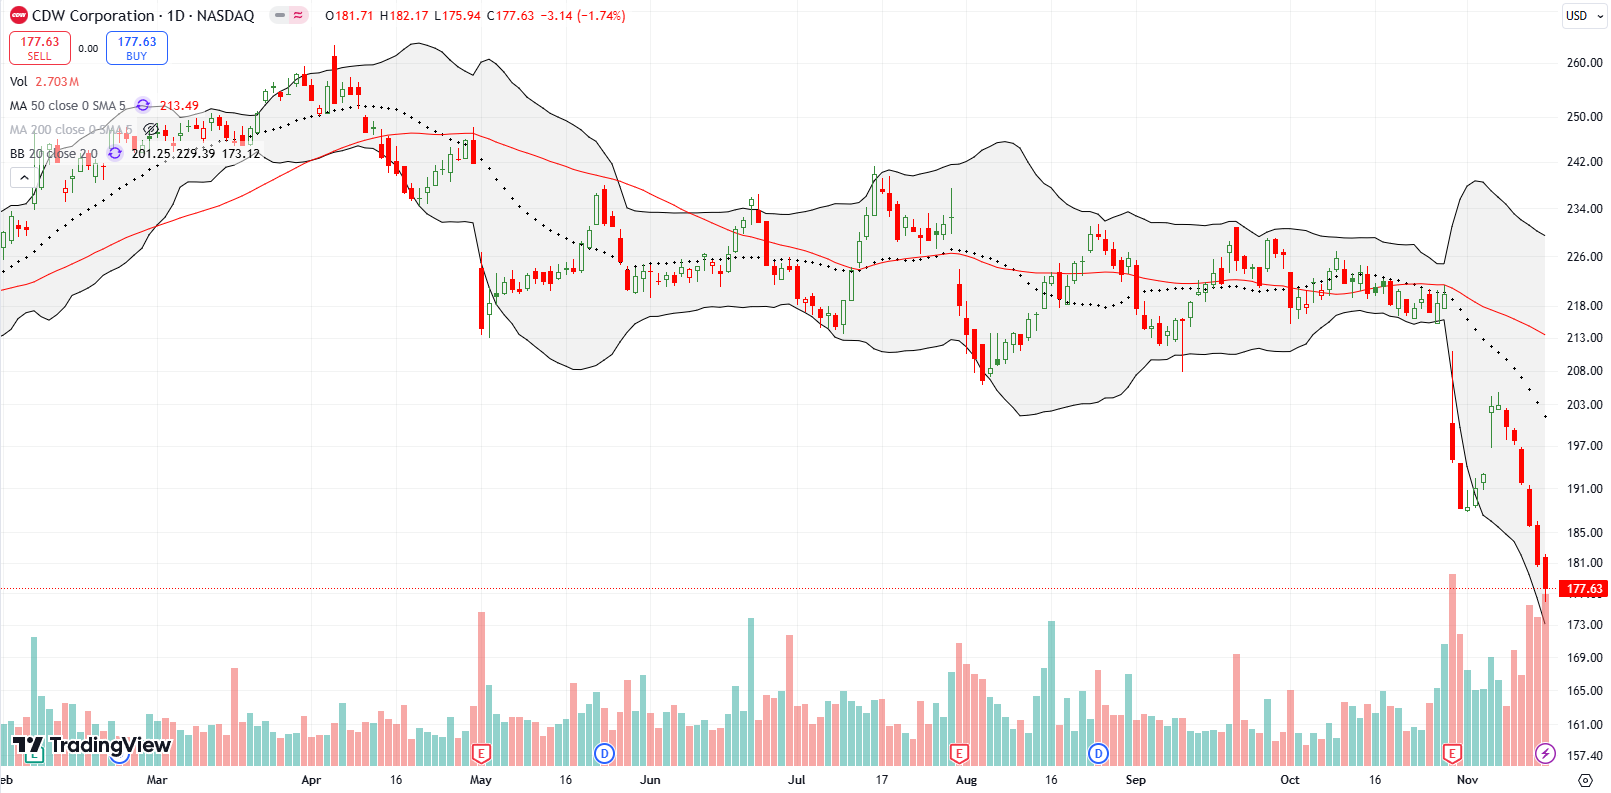
My lingering skepticism about IT consulting company CDW Corporation (CDW) unfolded with last month’s 11.3% post-earnings plunge. The confirmed failure from 50DMA resistance firmly planted CDW into bearish territory. I was slow in chasing CDW and finally got in a put spread on Thursday. CDW closed the week at a 17-month low.
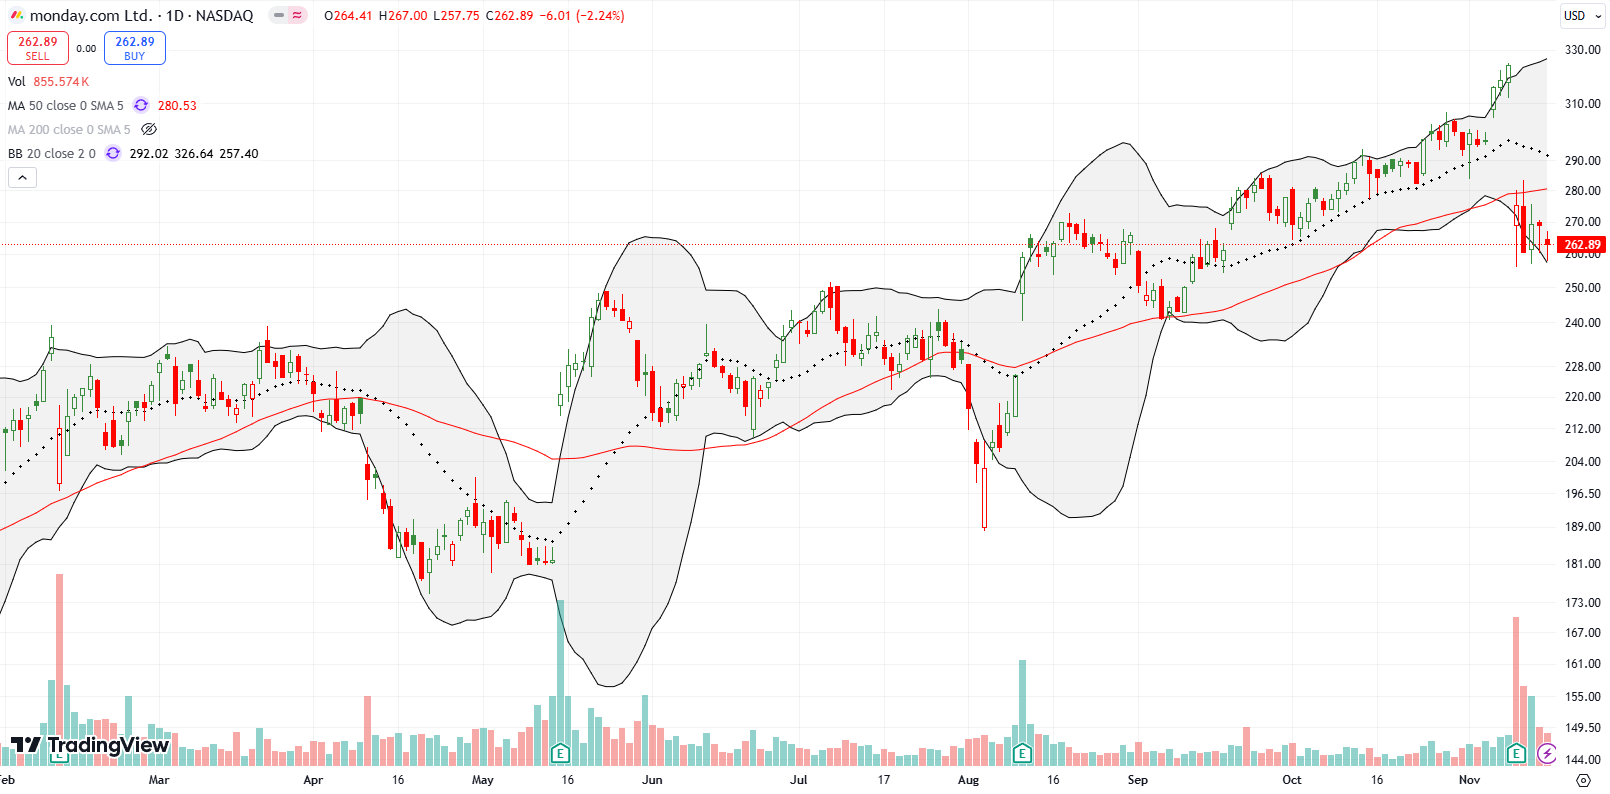
A post-earnings 15.1% loss planted work management software company monday.com Ltd (MNDY) into bearish territory. With a lofty valuation of 14x sales and forward P/E of 82, I feel comfortable shorting MNDY on a lower close.
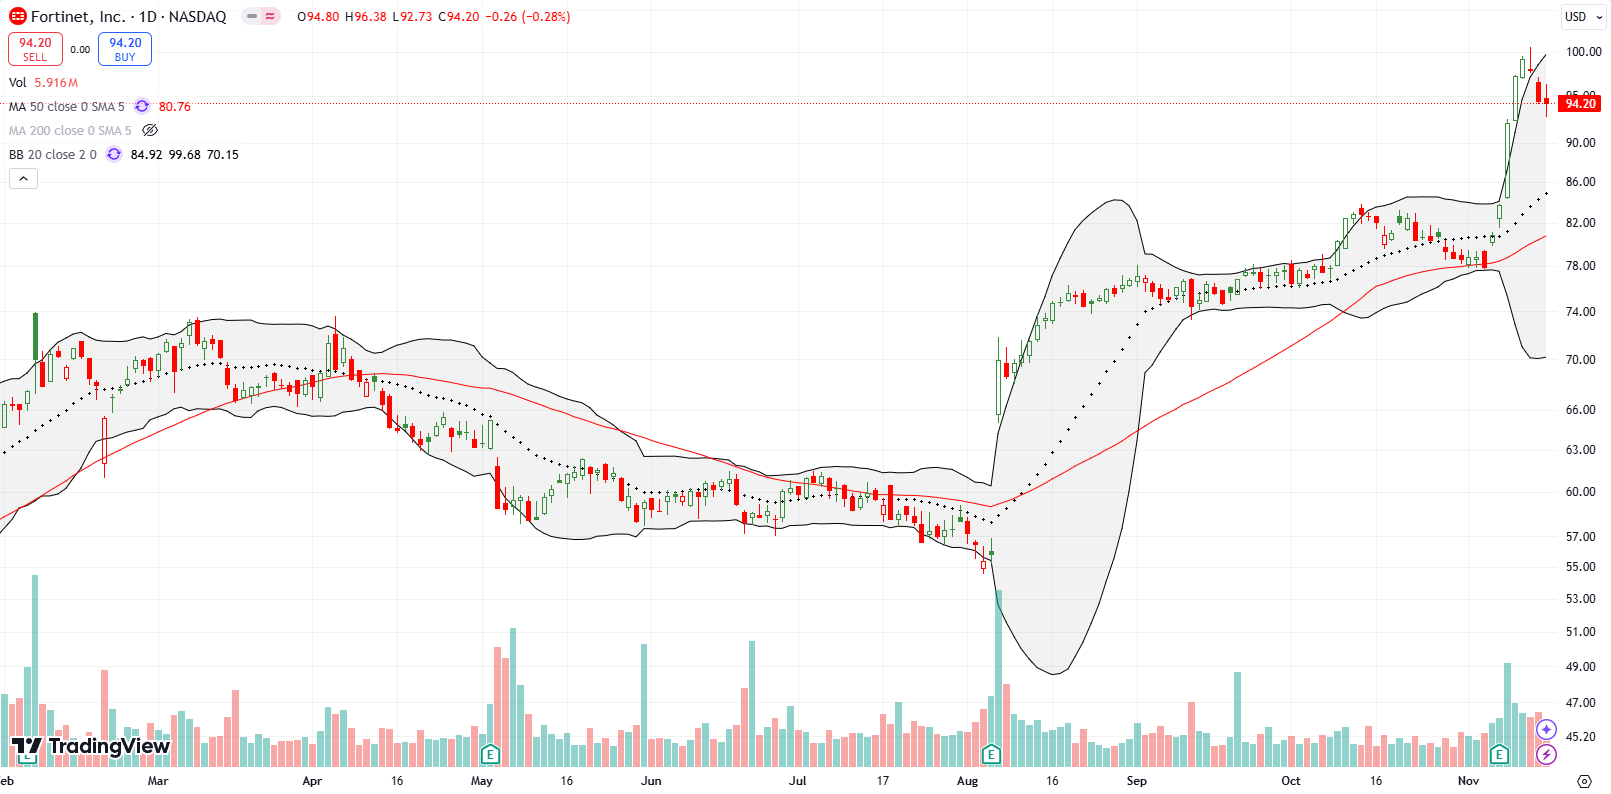
The post-election reversal did not have a dramatic impact everywhere. Cybersecurity technology company Fortinet, Inc (FTNT) slid lightly from an all-time high. The recent post-earnings surge that confirmed 50DMA support remains well intact.
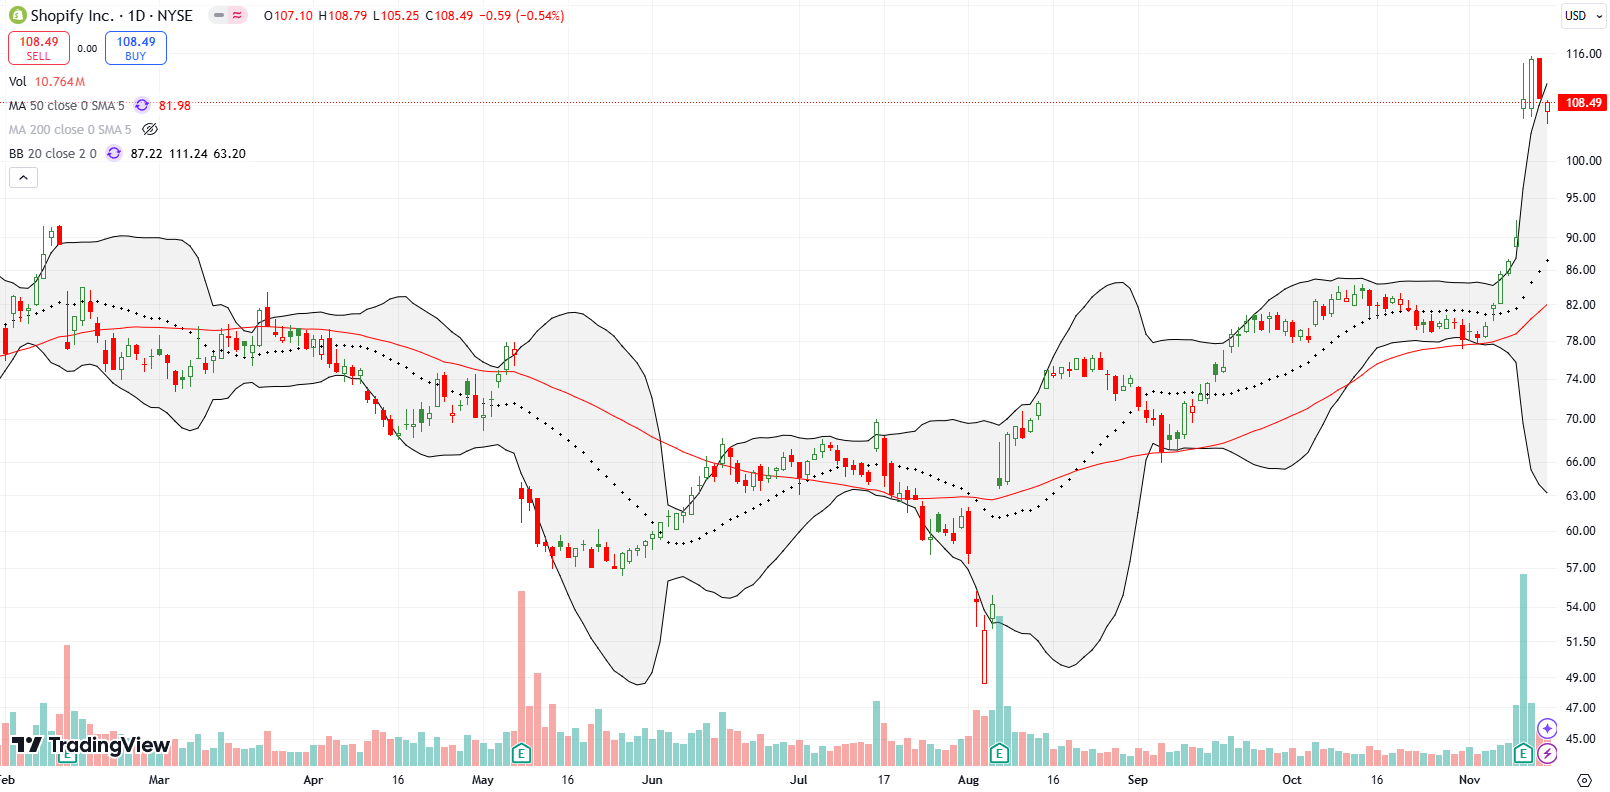
E-commerce platform Shopify Inc (SHOP) is also holding up well in the face of the post-election reversal. SHOP soared 21.0% post-earnings last week. It closed the week flat with the post-earnings open. Note how the run-up into earnings signaled potential good news ahead. In particular, the breakout filled February’s post-earnings gap down and created a bullish sign that confirmed 50DMA support. If not for earnings, I would have braved a trade on the long side. Now all I can do is see whether SHOP provides a new and good risk/reward entry on a pullback to support.
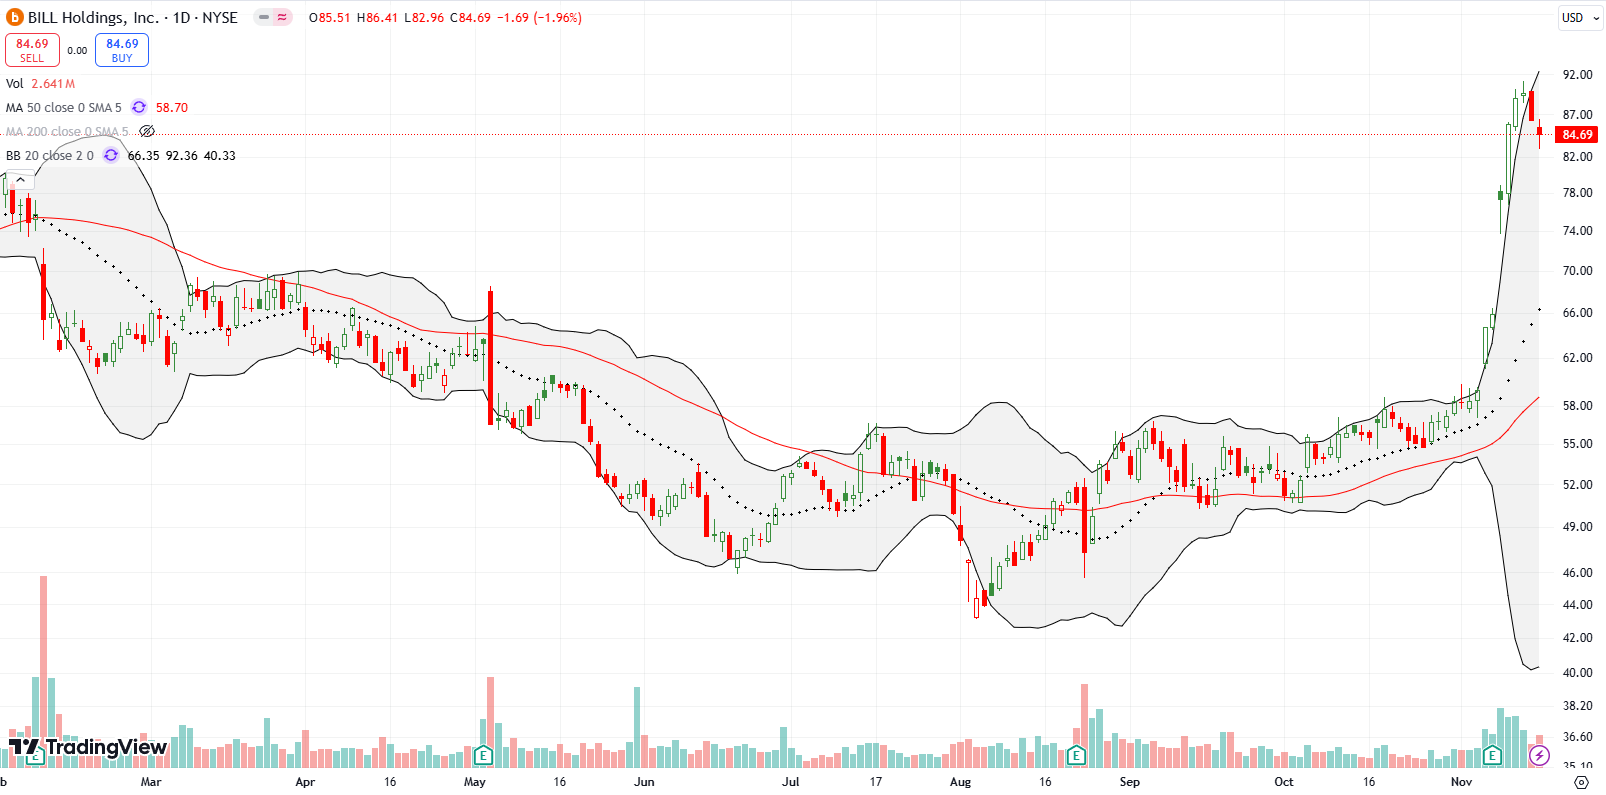
Nine months ago, BILL Holdings, Inc (BILL) fell 13.6% post-earnings. I thought the selling was overdone. My trade on BILL failed, but I resolved to keep an eye out for a buying opportunity. As the months wore on, BILL kept declining, and I eventually lost interest. BILL finally reached a turning point in August after buyers quickly transformed a 6.7% post-earnings loss into a 50DMA breakout. I failed to notice the turn until last week.
The chart below speaks volumes on what I missed. BILL has now gained 29.3% since that February post-earnings loss, but there is just no way I could have remained patient through the grinding and deepening loss along the way. The key lesson here is to stay on top of the thesis through a watchlist and price alerts.
Be careful out there!
Footnotes
Subscribe for free to get email notifications of future posts!
“Above the 50” (AT50) uses the percentage of stocks trading above their respective 50-day moving averages (DMAs) to measure breadth in the stock market. Breadth defines the distribution of participation in a rally or sell-off. As a result, AT50 identifies extremes in market sentiment that are likely to reverse. Above the 50 is my alternative name for “MMFI” which is a symbol TradingView.com and other chart vendors use for this breadth indicator. Learn more about AT50 on my Market Breadth Resource Page. AT200, or MMTH, measures the percentage of stocks trading above their respective 200DMAs.
Active AT50 (MMFI) periods: Day #246 over 20%, Day #145 over 30%, Day #69 over 40%, Day #7 over 50% (overperiod), Day #2 under 60% (underperiod), Day #84 under 70%
Source for charts unless otherwise noted: TradingView.com
Full disclosure: long SPY put spread, long IWM shares, long QQQ put spread, long ARKK, long CDW put spread, long XLV strangle
FOLLOW Dr. Duru’s commentary on financial markets via StockTwits, Twitter, and even Instagram!
*Charting notes: Stock prices are not adjusted for dividends. Candlestick charts use hollow bodies: open candles indicate a close higher than the open, filled candles indicate an open higher than the close.

