Stock Market Commentary
The Federal Reserve took the stage right after the U.S. presidential election. The Federal Reserve and Fed Chair Jerome Powell delivered as expected. The unrelenting bulls had no reason to stop the momentum from the post-election rally. Powell stuck to the Fed’s script and unrelenting bulls kept charging. The uneventful meeting had two notable moments that set the stage for a defiant Fed rigorously defending the integrity and independence of the Federal Reserve. In response to a question on whether Powell would resign if Trump asked him to kick rocks, Powell curtly said “No.” He repeated his answer to the follow-up question on whether Powell is legally required to leave. To add defiance upon defiance, Powell later spelled out that the President cannot fire or demote the Fed chair: “Not permitted under the law.” Hopefully the rule of law indeed prevails.
Ironically, the Fed is working in favor of the upcoming administration. These rate cuts in the middle of an unrelenting bull market and a strong economy are supporting what feels and looks like a blossoming Gilded Age. This time of overall prosperity is built on generous combinations of fiscal and monetary stimulus and emerged from the ashes of pandemic lockdowns and tragedy. This is an economy doing about as well as it can…the unrelenting bulls have seen things clearly for a while.
The Stock Market Indices
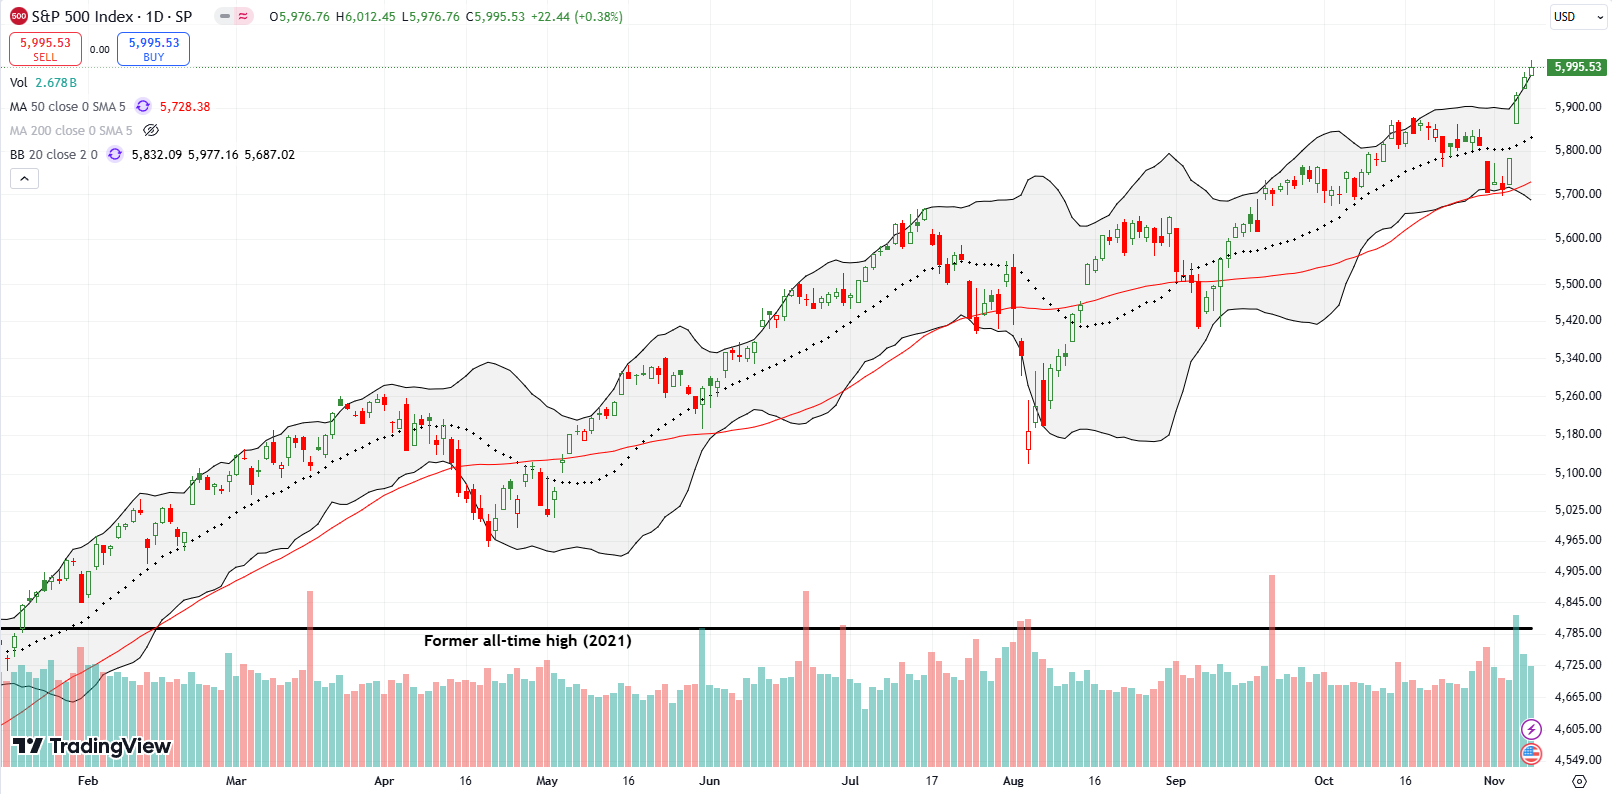
The S&P 500 (SPY) continued higher in unrelenting fashion. After Wednesday’s 2.5% surge to a new all-time high, the index gapped higher two more times. With the size of the gains rapidly diminishing, I fully expect the coming week to be a time of price consolidation or even a token pullback.
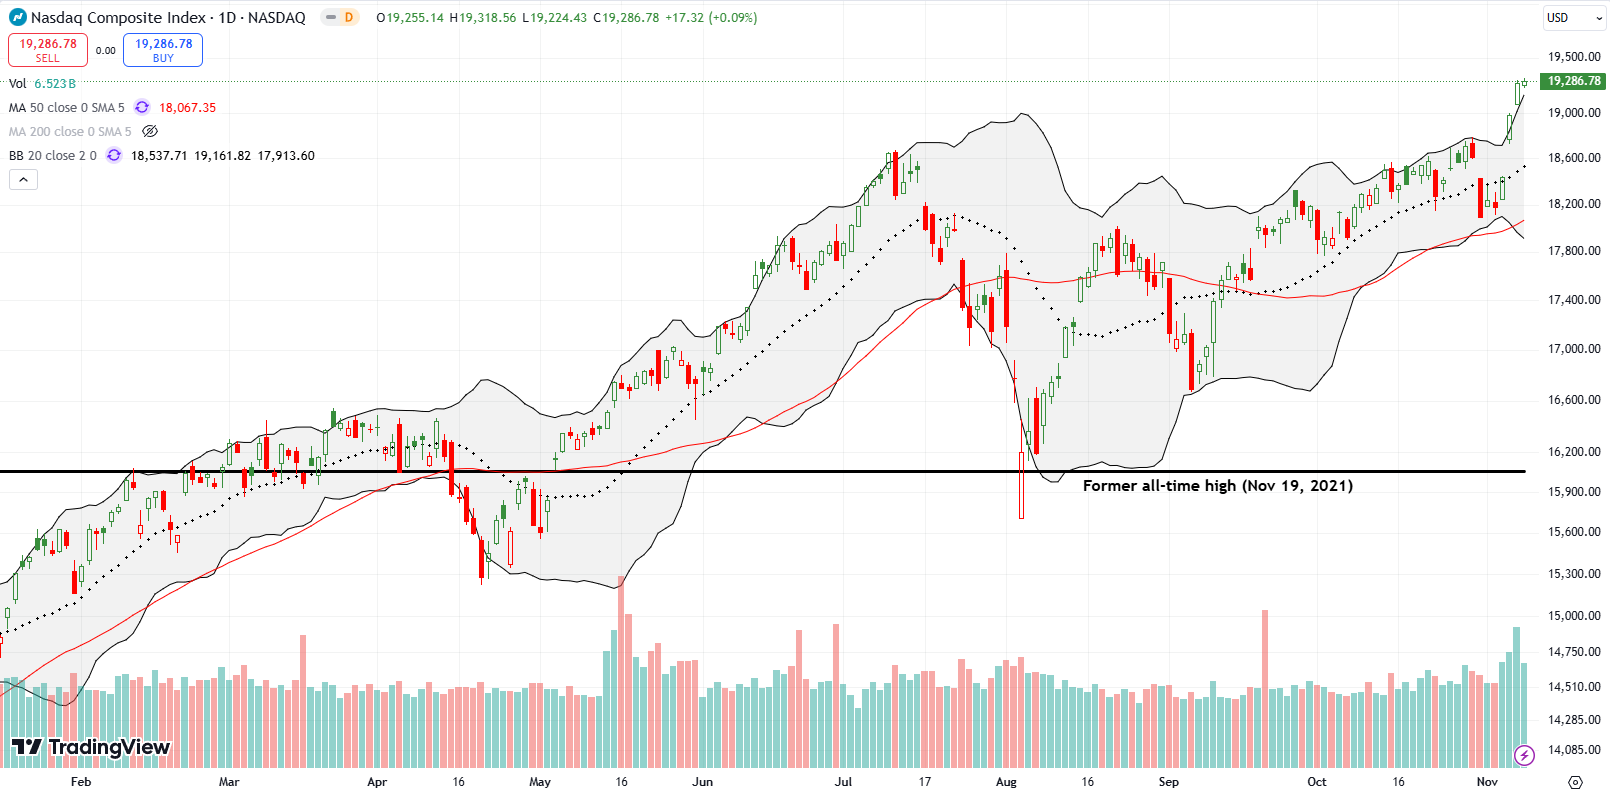
The NASDAQ (COMPQX) “only” managed one convincing follow-through day after Wednesday’s 3.0% surge to an all-time high. Still, the unrelenting bulls made sure to close the tech laden index well above its upper Bollinger Band. Like the S&P 500, the diminishing daily gains suggest that the coming week will feature price consolidation or a brief rest in the form of a token pullback.
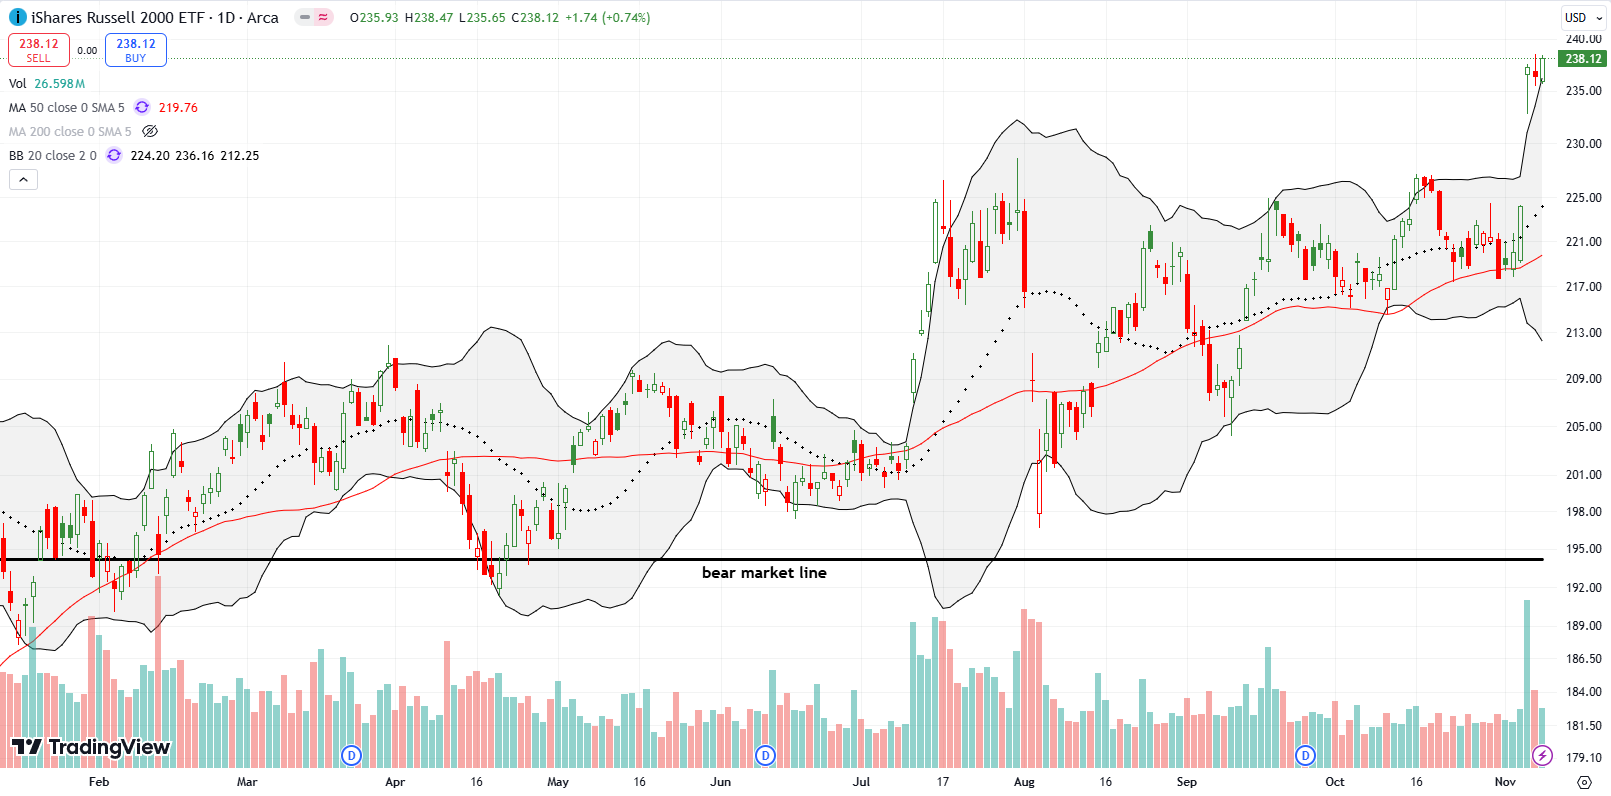
The iShares Russell 2000 ETF (IWM) has already started its price consolidation. The ETF of small cap stocks outperformed on Wednesday and underperformed afterward. IWM even recorded a marginal loss in the wake of the Fed’s decision on Thursday. Friday’s 0.7% gain to a new 3-year high reassured me that IWM remains primed to resume its upward surge at some point soon.
The Short-Term Trading Call With Unrelenting Bulls
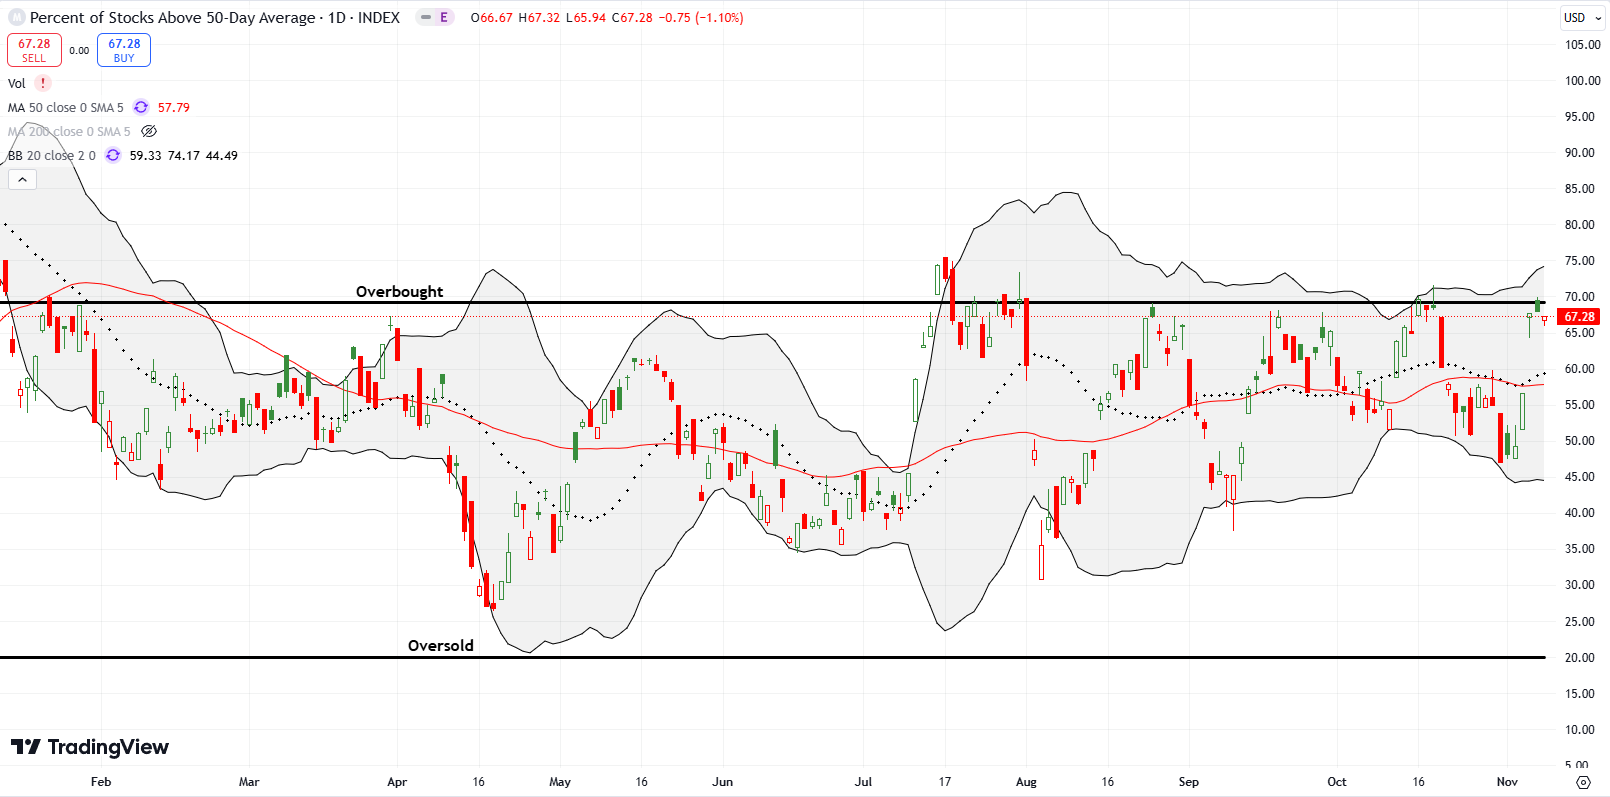
- AT50 (MMFI) = 67.3% of stocks are trading above their respective 50-day moving averages
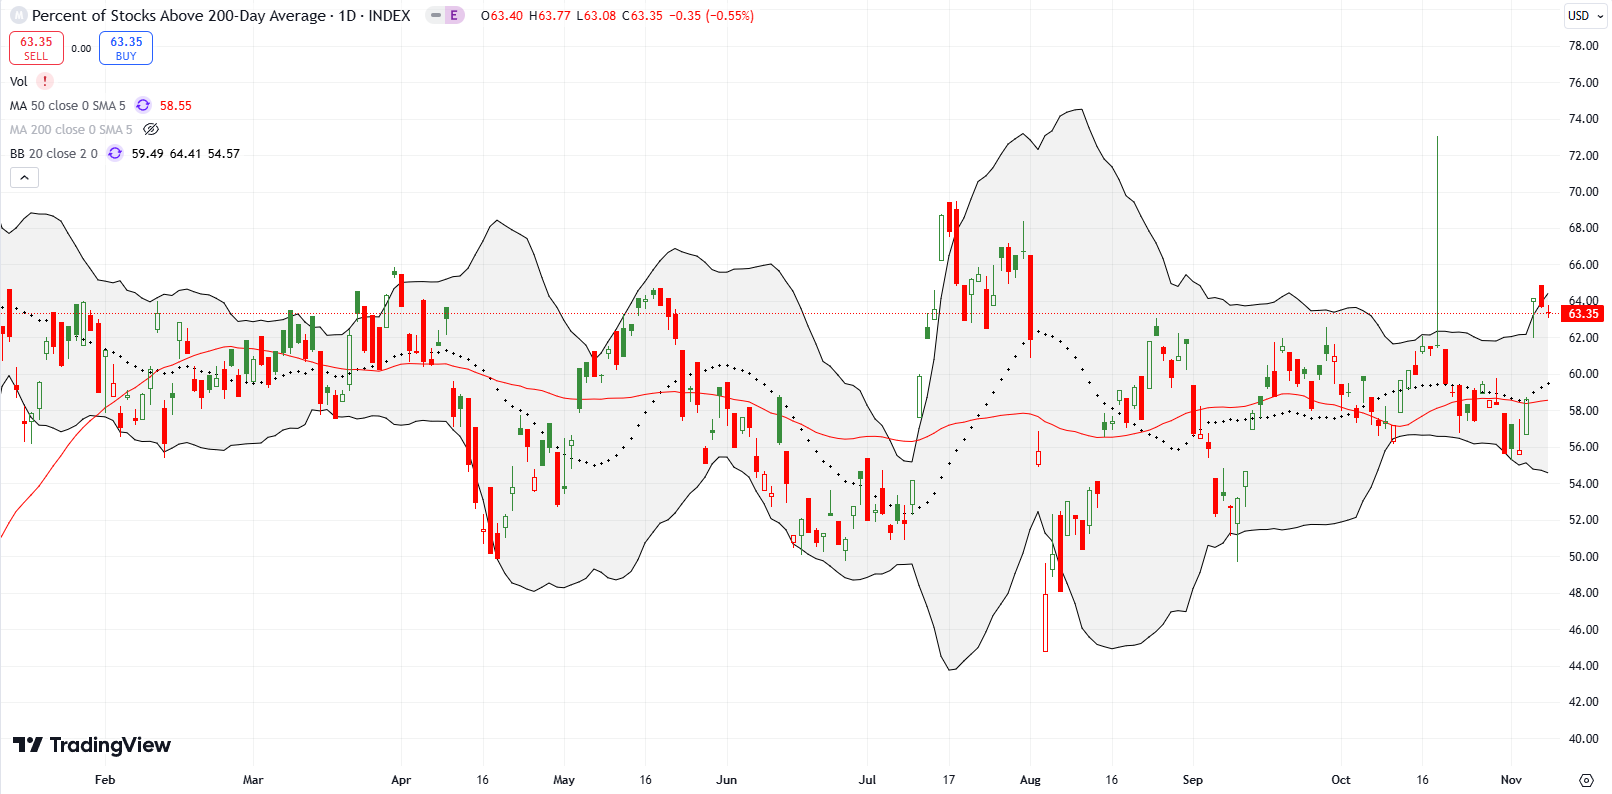
- AT200 (MMTH) = 63.4% of stocks are trading above their respective 200-day moving averages
- Short-term Trading Call: neutral
AT50 (MMFI), the percentage of stocks trading above their respective 50DMAs, stalled right under the overbought threshold of 70% after Wednesday’s surge from 56.6% to 67.8%. By closing the week at 67.3%, my favorite indicator is teetering on flashing a fresh bearish sign per the AT50 trading rules. Given the nature of the unrelenting bulls, I fully expect the next bearish period to be brief. Not only does November kick off a seasonally strong period for stocks (through April), but also the post-election surge is too strong to ignore. At best, sellers in the short-term may reverse all the “surplus” gains from the gap open on Wednesday. In other words, like so many other bearish periods this year, I expect to find few convincing short opportunities that offer good risk/reward.
Moreover, the Federal reserve is in rate-cutting mode. No matter what happens during this juncture, the stock market can excuse buying by looking forward to easier monetary policy.
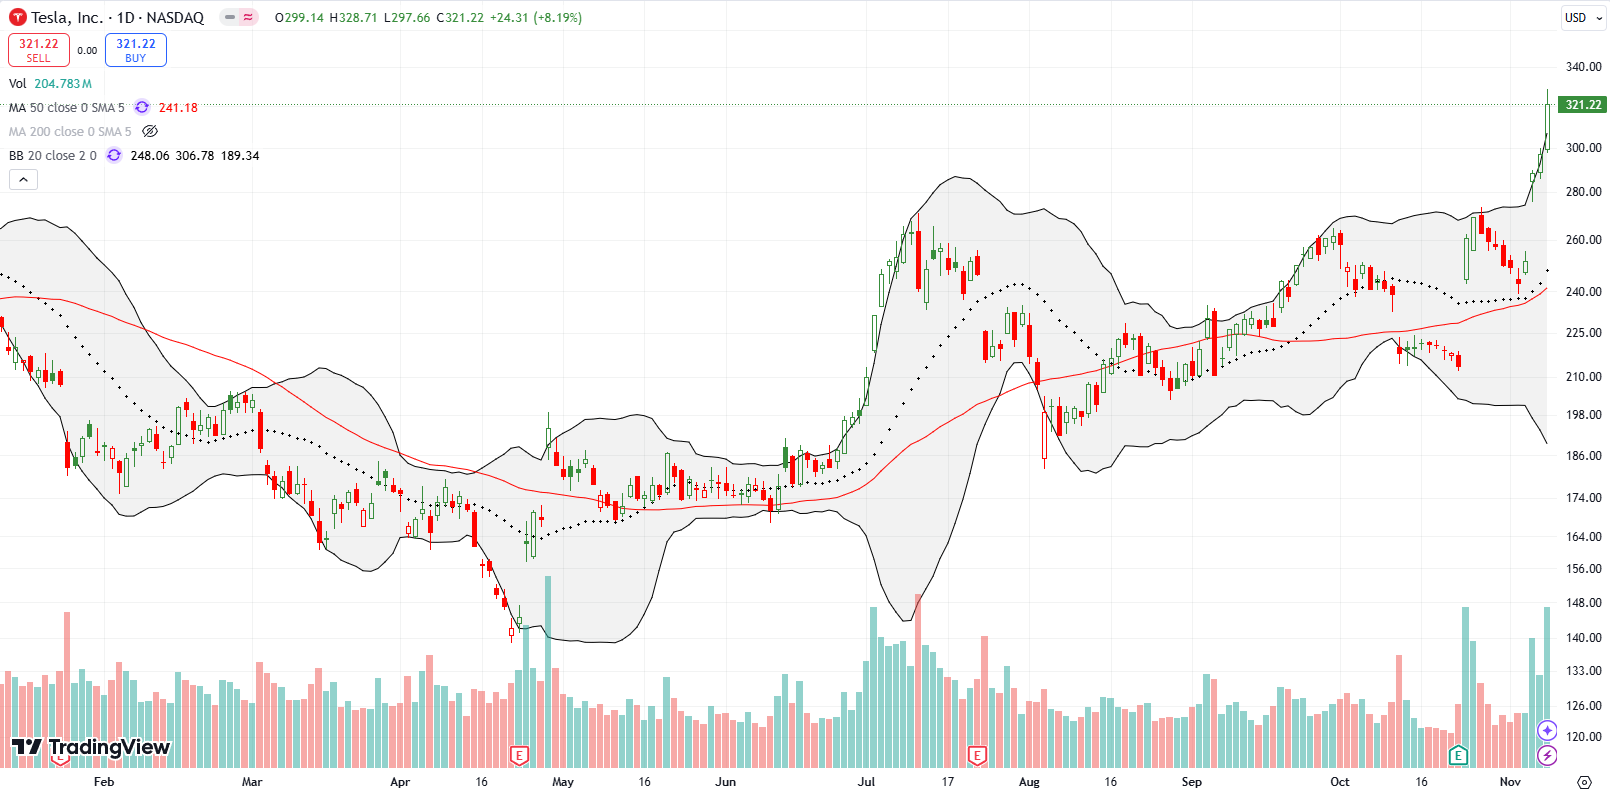
Tesla, Inc (TSLA) is vying to re-emerge as an icon of the unrelenting bull market. Last week’s surge finally created significant distance from TSLA’s 2023 close. TSLA is up 29.3% year-to-date with most of that gain coming from last week’s 29.0% jump. Ahead of the election, I simply played the technicals on TSLA with its nearly picture perfect test of support at its 50-day moving average (DMA). However, since I did not expect the election results to deliver dramatic stock market movements, I traded conservatively with a weekly calendar call $275/$277.50 spread. This position was a “cheap” way to take advantage of the faster relative decay of the shorter dated call.
I felt fortunate to nab a small profit on Wednesday as TSLA jumped 14.8% and zipped right by the strikes of my position. Consistent with my miscalculation, I next failed to renew the trade. Friday’s nearly parabolic move “pushed” me into a December $360/$380 call spread. I created that trade as a core short-term bet on an on-going, unrelenting bull. This core position should dissuade me from chasing other hot stocks higher.
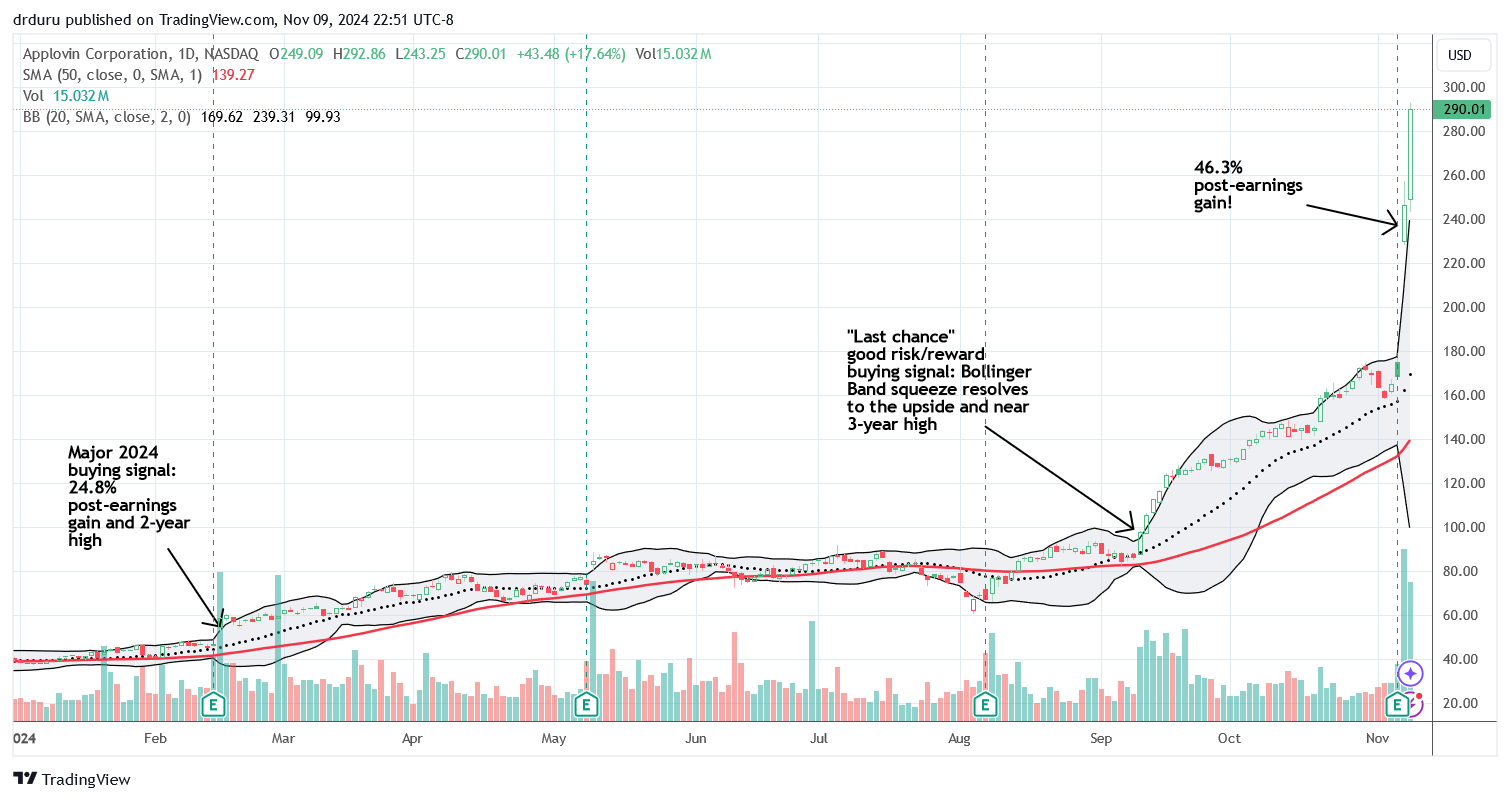
Applovin Corporation (APP) is the stock I wish I had chased higher. This marketing and advertising software company first caught my attention exactly a year ago. At the time, I made a case to buy APP and traded in and out of it successfully. I thought the stock was “expensive” and “extended” did not want to over extend my welcome. After last week’s mind-boggling post-earnings run-up, I panned back to learn some trading lessons. The chart below shows key moments for APP where the market offered important bullish signals for any buy and hold investor. Needless to say, I cannot bring myself to chase APP at current levels! APP is up 628% for the year and is likely my biggest miss ever…I am actively on alert for the next APP…
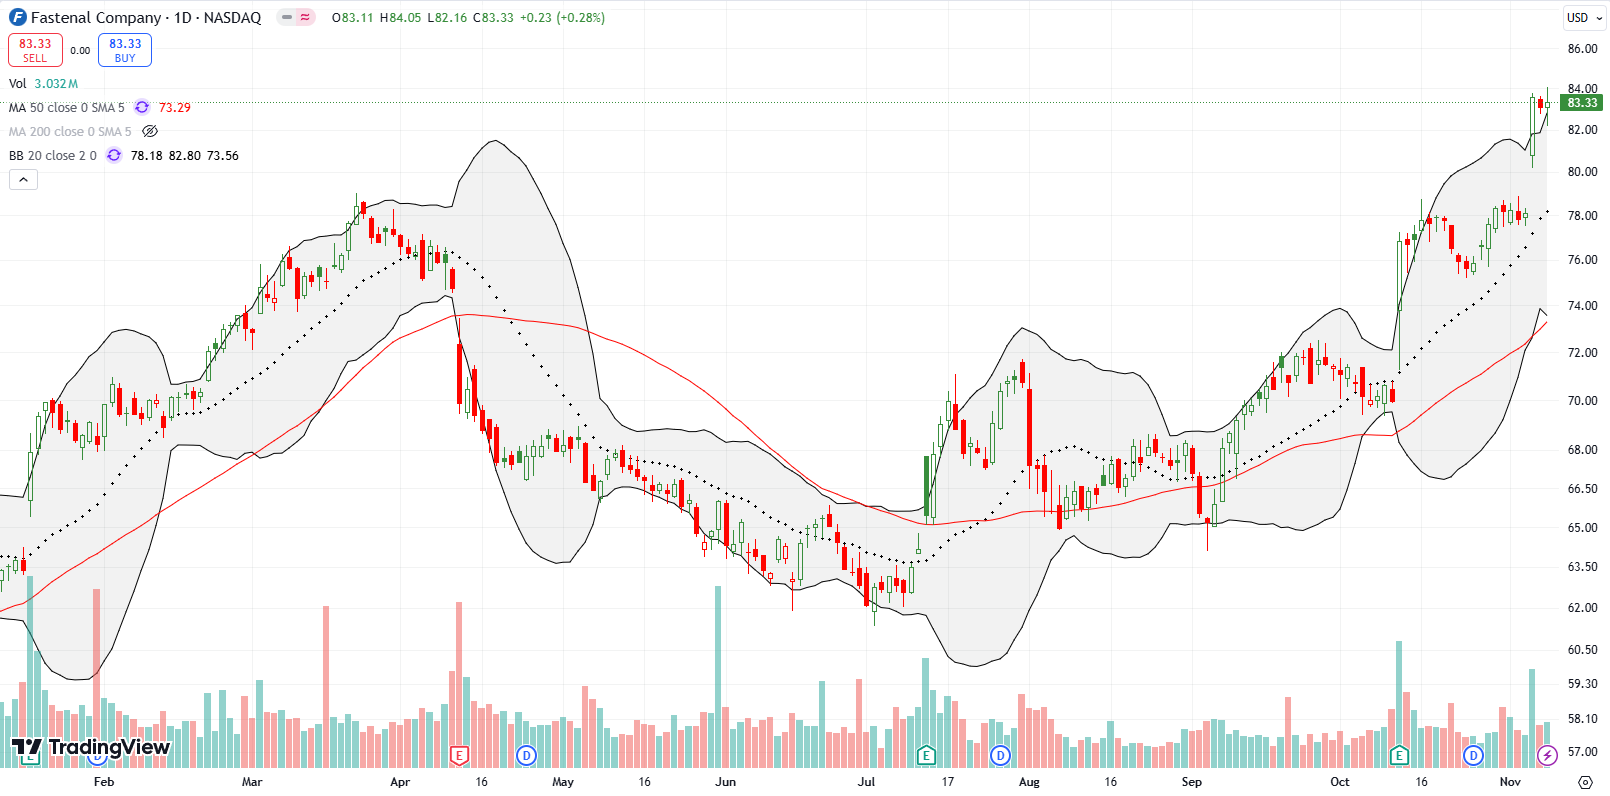
Old economy, industrial type stocks also fared well last week. Parts supplier Fastenal Company (FAST) jumped 7.0% on Wednesday to a new all-time high. Buyers nearly stopped cold from there. Still, FAST is the kind of stock I will feel comfortable buying and holding on a future pullback: real profits and a relatively reliable business mainly reliant on domestic revenue sources.
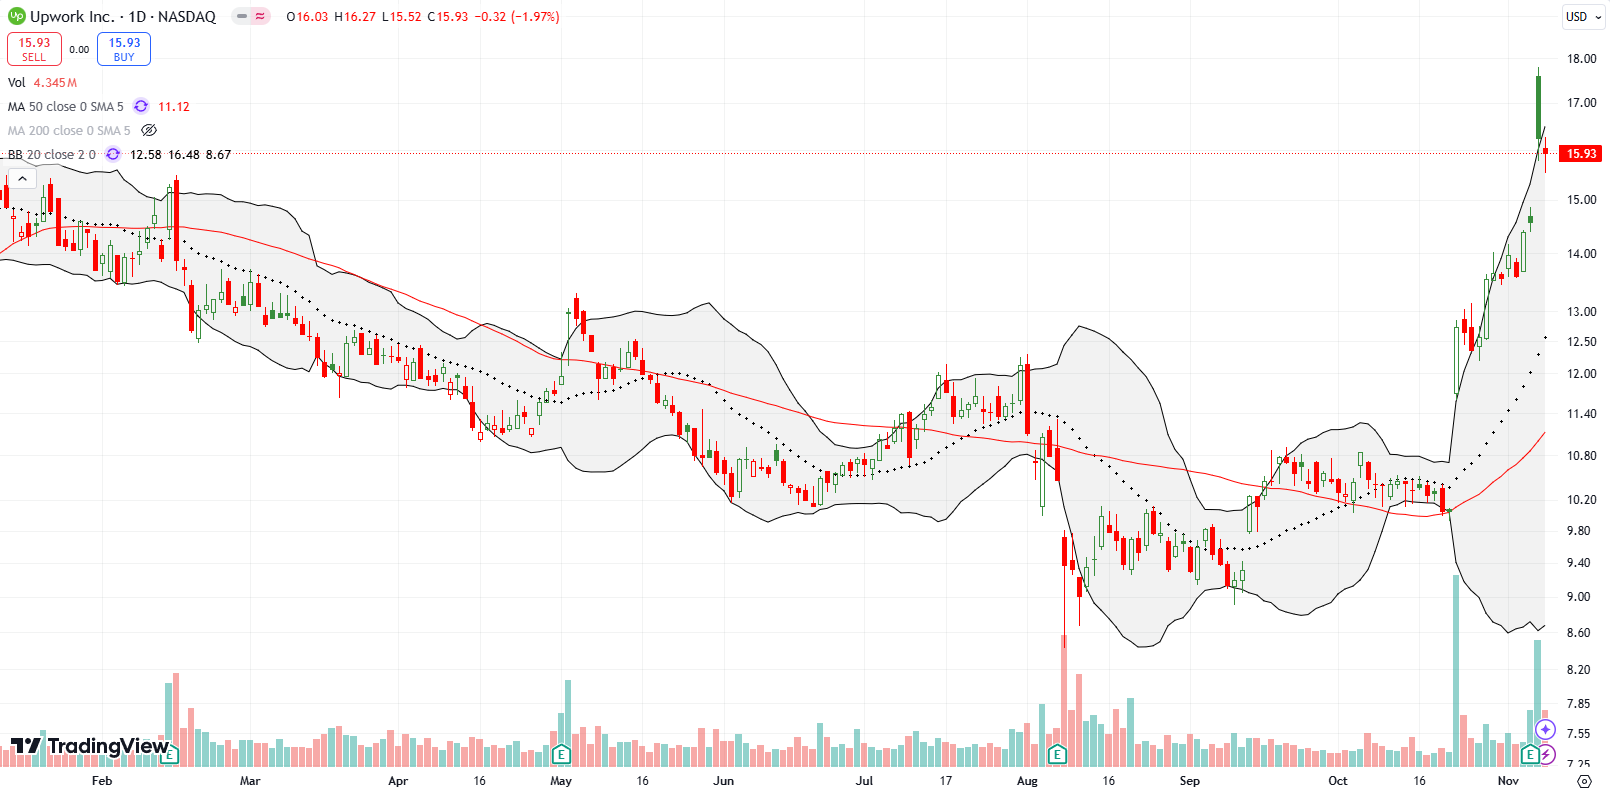
Online contract work platform Upwork, Inc (UPWK) is enjoying its own resurgence. I completely missed the obvious buy signal on the October 23rd breakout and 26.7% gain. The company announced higher guidance and important corporate changes. That 5 1/2 month high confirmed 50DMA support in convincing style. Buyers have stayed unrelenting since then.
UPWK benefited little from Wednesday’s post-election rally, but the stock gained 11.4% post-earnings. The sharp fade from intraday highs well above the upper Bollinger Band (BB) flashed a warning sign of a top (gap and crap). However, the minimal loss on Friday set the stock up for a bullish “calm after the storm” short-term trading pattern. I am a very, very late buyer on a trade above Friday’s intraday high with a stop loss below Friday’s intraday low. The next APP? Perhaps. UPWK hit an all-time high in 2021 with a triple top around $64. I last made the case for UPWK 13 months ago.
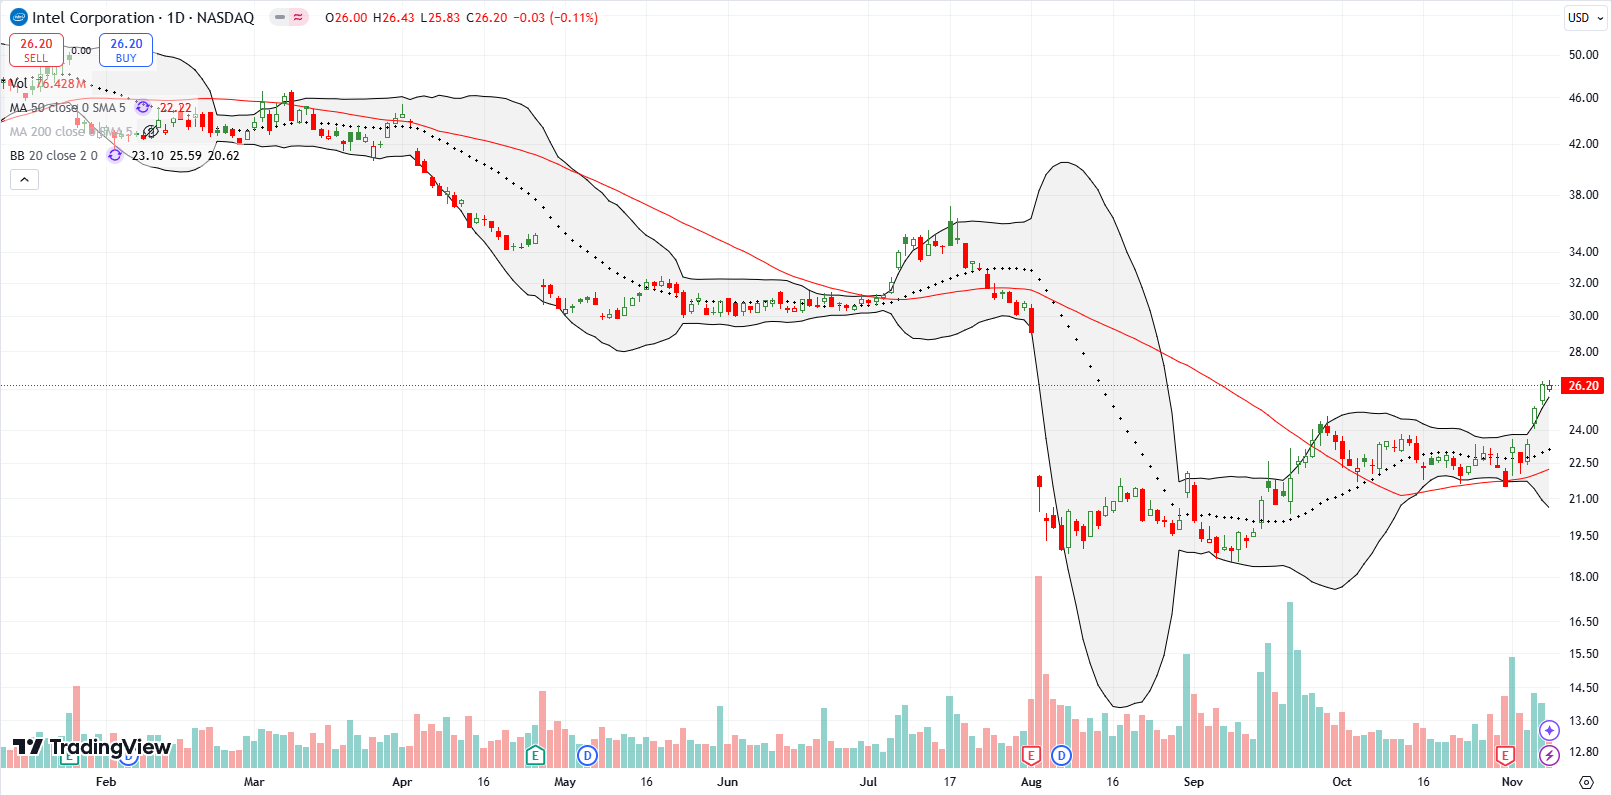
Intel Corporation (INTC) was a huge disappointment when it plunged post-earnings in August. INTC wobbled post-earnings at the end of October but held 50DMA support. Last week’s breakout makes a bottom look more likely. Last week, INTC gained 3.6% on news that it would lose its citizenship in the Dow Jones Industrials. That bad news could form a contrarian part of the confirmation of a bottom. As if to send that message, INTC disclosed the purchase of $251,198 in stock the very next day. Needless to say, I am now looking to get back to between earnings trades on INTC. I am still holding accumulated shares.
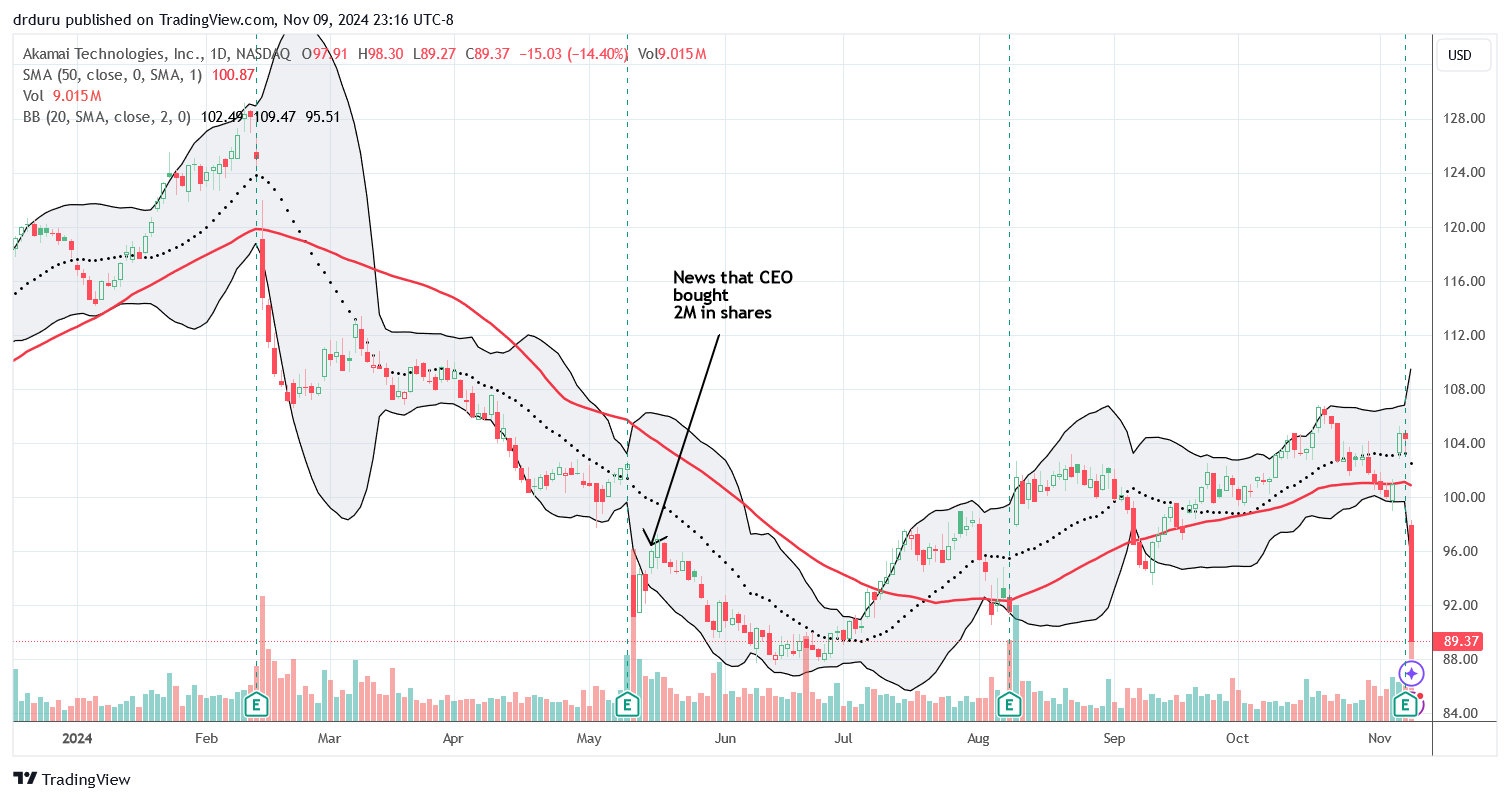
Executive insider buying seemed to provide a key bullish signal for Akami Technologies Inc (AKAM). I made the case 3 months ago and last month declared my intention to hold AKAM through earnings. Unfortunately, AKAM disappointed bigtime with a 14.4% post-earnings loss. The remaining post insider buying gains vanished in a flash.
Despite surpassing the billion dollar quarterly revenue mark for the first time, AKAM reduced guidance and got punished accordingly: “the company lowered its full-year revenue forecast to a range of $3.966B-$3.991B from $3.97B-$4.01B previously. The new midpoint comes in at $3.98B, lower than the consensus estimate of $4B. Meanwhile, Akamai (AKAM) also cut its full-year adjusted profit per share guidance to a range of $6.31-$6.38, compared to a prior range of $6.34-$6.47. The consensus estimate is $6.43.” The trimming looks minor, so I am surprised by AKAM”s plunge in the midst of last week’s unrelenting bullish tidings. Since I rarely sell in a panic, I am holding my shares for now…and I am hopeful for an eventual recovery. I will revisit AKAM if it makes a new low for the year.
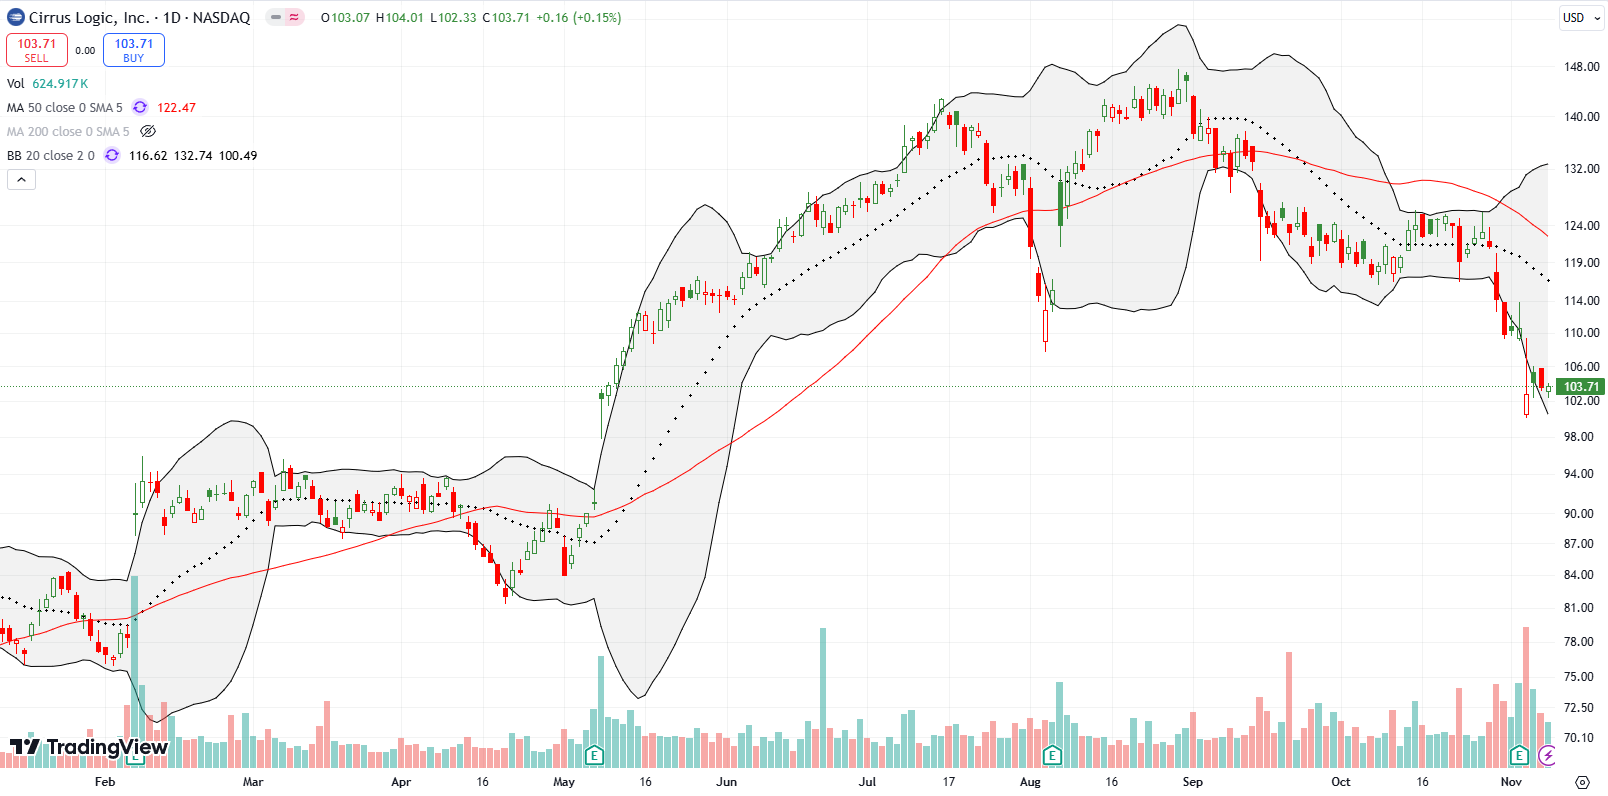
Cirrus Logic, Inc (CRUS) is an obligatory nod to the bears that the unrelenting bulls left behind. CRUS fell 7.1% post-earnings and finished reversing its incremental gains from May earnings. Post-election tailwinds barely benefited CRUS, and the stock already looks ready to resume its decline.
Be careful out there!
Footnotes
Subscribe for free to get email notifications of future posts!
“Above the 50” (AT50) uses the percentage of stocks trading above their respective 50-day moving averages (DMAs) to measure breadth in the stock market. Breadth defines the distribution of participation in a rally or sell-off. As a result, AT50 identifies extremes in market sentiment that are likely to reverse. Above the 50 is my alternative name for “MMFI” which is a symbol TradingView.com and other chart vendors use for this breadth indicator. Learn more about AT50 on my Market Breadth Resource Page. AT200, or MMTH, measures the percentage of stocks trading above their respective 200DMAs.
Active AT50 (MMFI) periods: Day #243 over 20%, Day #142 over 30%, Day #66 over 40%, Day #4 over 50%, Day #3 over 60% (overperiod), Day #81 under 70% (underperiod)
Source for charts unless otherwise noted: TradingView.com
Full disclosure: long SPY put spread, long IWM shares, long QQQ put spread, long AKAM, long TSLA call spread, long INTC
FOLLOW Dr. Duru’s commentary on financial markets via StockTwits, Twitter, and even Instagram!
*Charting notes: Stock prices are not adjusted for dividends. Candlestick charts use hollow bodies: open candles indicate a close higher than the open, filled candles indicate an open higher than the close.


