Stock Market Commentary:
The recession that Wall Street wants remains elusive according to the August jobs report. The data show the labor participation rate increased with job growth and a minimal increase in the unemployment rate: a recipe for the (mythical?) economic soft landing. The reaction in the stock market reflected the duality in interpreting this otherwise good jobs report. The market initially gapped up higher to celebrate the good economic news. Sellers took over and faded the market into negative territory upon realizing that the news keeps the Fed hawkish and on schedule with monetary tightening. This characterization is my stylized narrative, but I find it useful for painting context on the poor technicals of the day. The resulting fades confirmed bear market resistance.
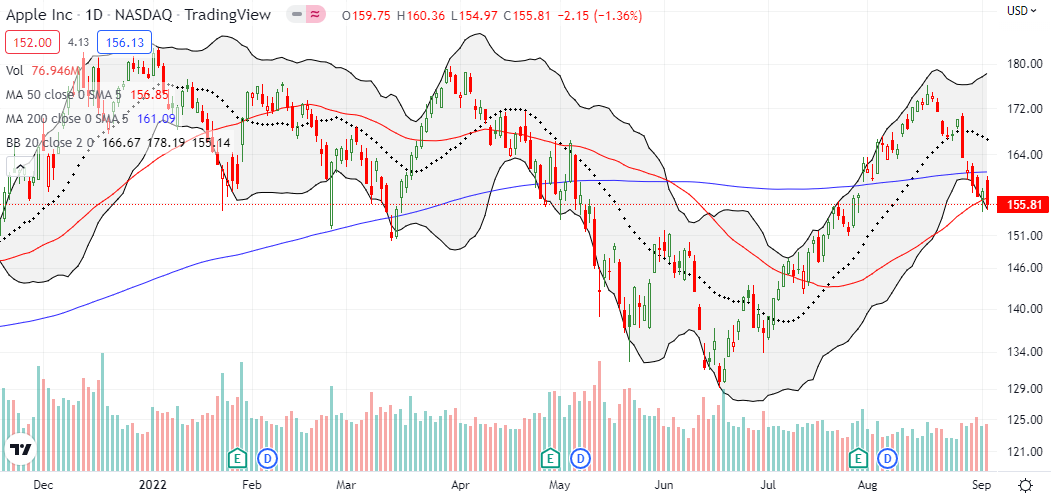
Apple (AAPL) once again led the stock market narrative. The trading in AAPL is a counter-reaction to the rally that took the stock close to the triple top set from December, 2021 to March, 2022. Sellers have dominated the trading action through a confirmed breakdown below support at the 200-day moving average (DMA) (the blue line below) and now a 50DMA (the red line) breakdown. Ironically, Friday’s post-jobs fade followed a promising defense of 50DMA support that created a bottoming hammer. The fade confirmed bear market trading action. AAPL is down 10.7% from its recent high in a move that technician Carter Braxton Worth presciently called right near the top just as the bear market warmed back up.
The Stock Market Indices
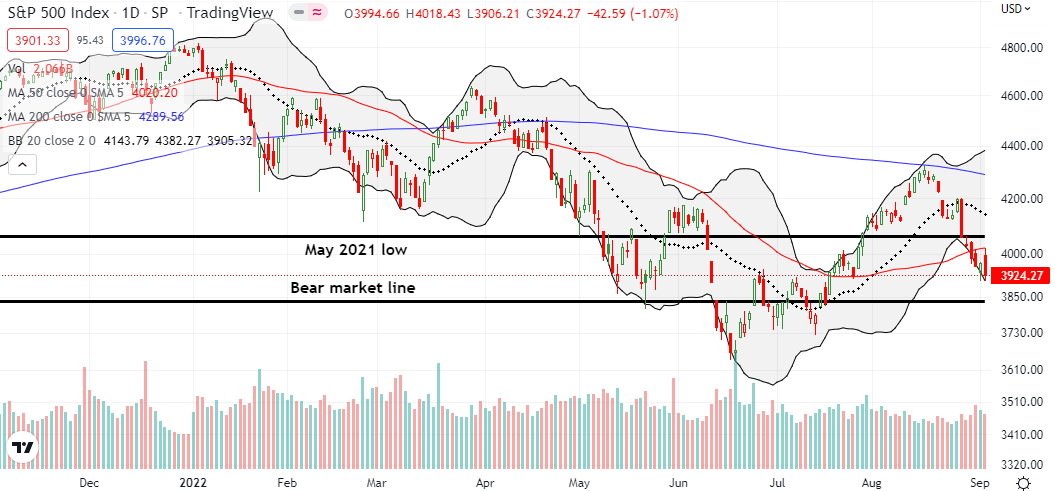
The S&P 500 (SPY) struggled with its 50DMA all week. Tuesday’s breakdown was confirmed by follow-on selling the next day. The index rallied back to 50DMA resistance, which just happens to be near 4000, only to get rejected. The bear market resistance sent the S&P 500 tumbling into a 1.1% loss and 5-week closing low. A test of the bear market line is now in play.
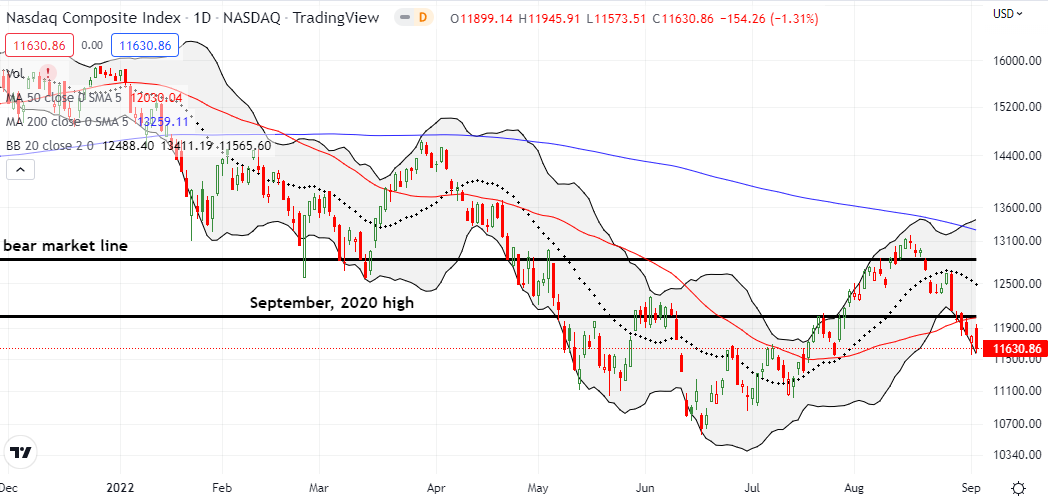
The technicals on the NASDAQ (COMPQ) are worse than the technicals on the S&P 500. The tech-laden index’s confirmed 50DMA breakdown also delivered a confirmed breakdown below the September, 2020 high. This line’s importance is increasing with time as the NASDAQ pivots around it. The NASDAQ’s gap up on Friday fell short of 50DMA resistance.
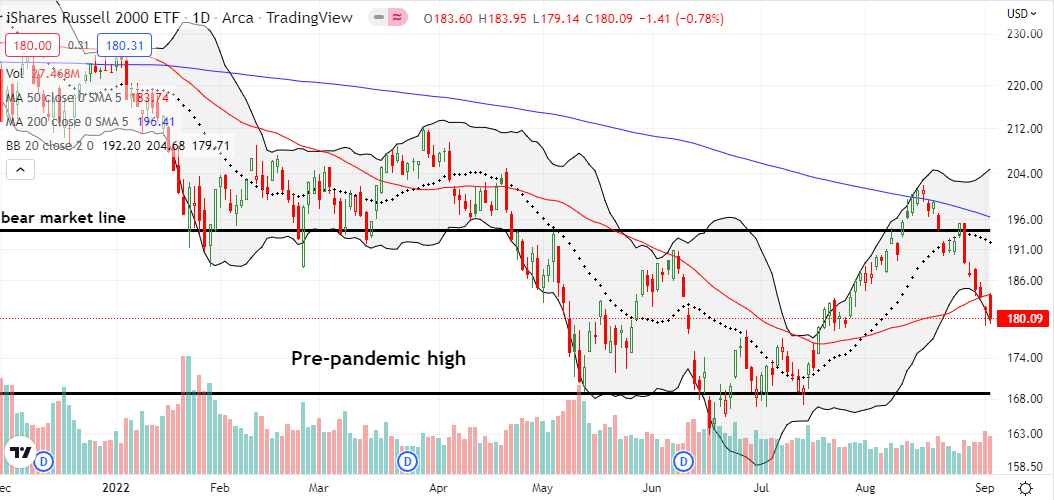
The iShares Russell 2000 ETF (IWM) delivered a picture-perfect failure that confirmed bear market resistance. The ETF of small caps gapped right into its 50DMA, and sellers took over from there. Like the other two major indices, IWM closed at a 5-week low. A retest of the pre-pandemic high is now in play. I will refresh a position in puts on follow-through selling in the coming week.
Stock Market Volatility
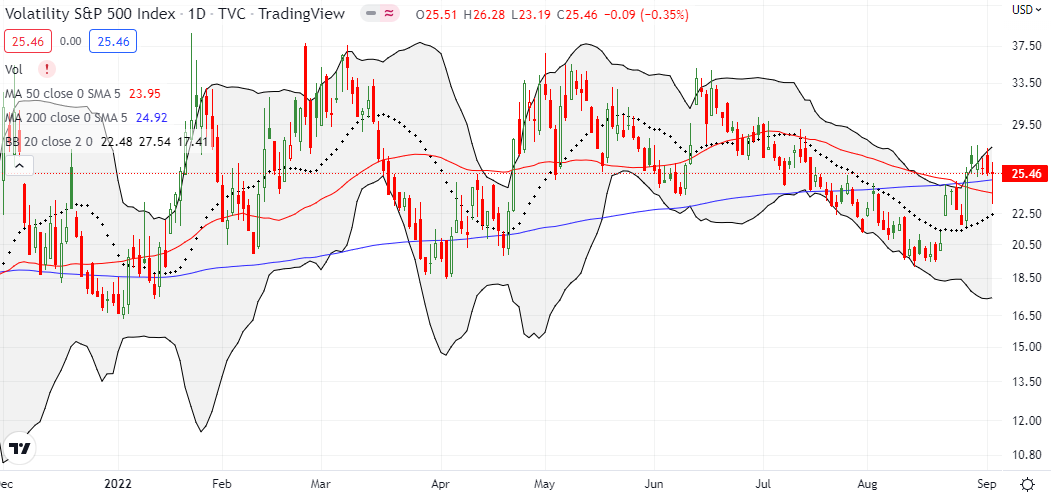
At its lows for the day, the volatility index (VIX) almost looked ready to resume its previous descent. The VIX faders actually lost this fight. The VIX rebounded back to flat on the day. A breakout above last week’s high will signal sellers are ready to take the market lower.
The Short-Term Trading Call With Bear Market Resistance
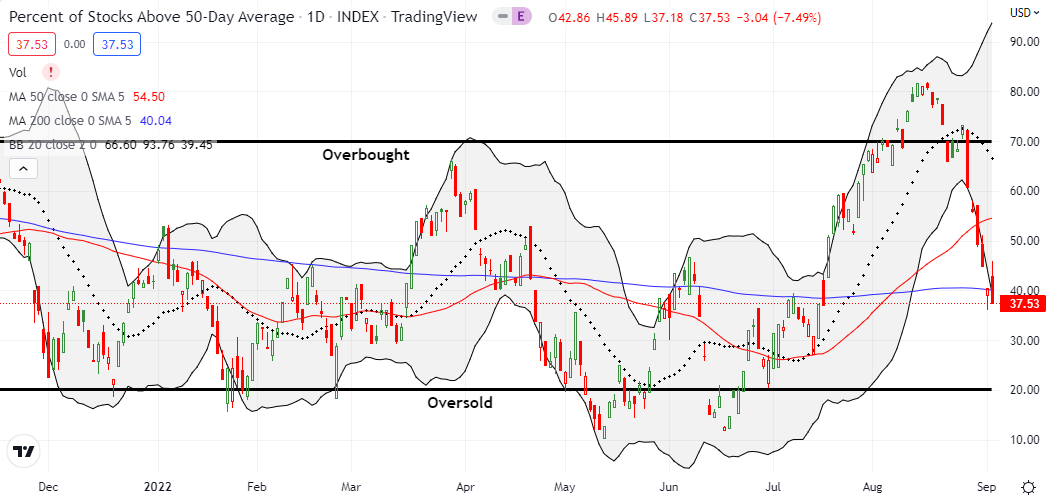
- AT50 (MMFI) = 37.5% of stocks are trading above their respective 50-day moving averages
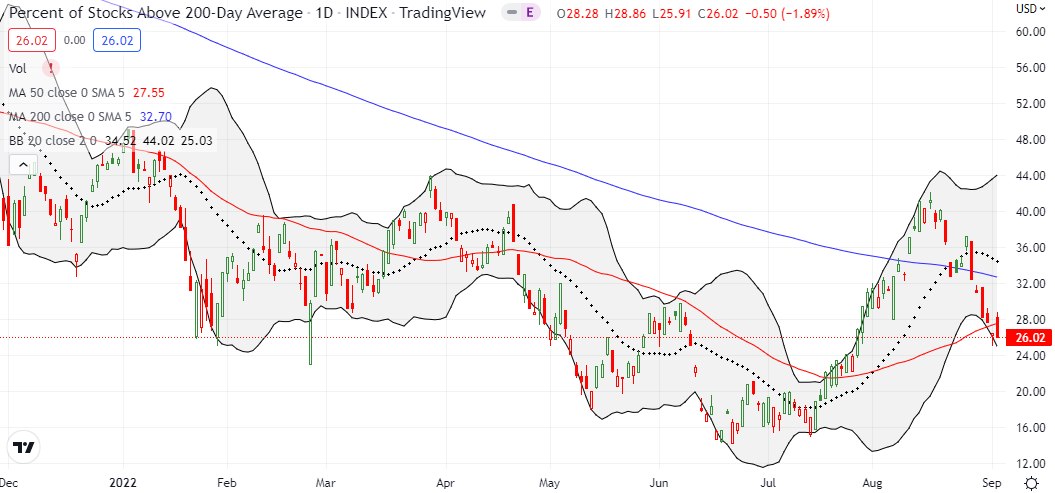
- AT200 (MMTH) = 26.0% of stocks are trading above their respective 200-day moving averages
- Short-term Trading Call: bearish
AT50 (MMFI), the percentage of stocks trading above their respective 50DMAs, closed at 37.5% after the dust settled on the fade that confirmed bear market resistance. Like the major indices, AT50 closed at a 5-week low. This synchronicity is an important confirmation of the freshly bearish trading action. In a bull market, I consider a drop by AT50 into the 30s to provide a “close enough” signal to start at least shopping for buys. Instead, with this bear market, I maintain my short-term trading call at bearish. Two milestones from here get me bullish: a drop into oversold conditions (AT50 below 20%) and/or a confirmed 50DMA breakout by the S&P 500 and then the NASDAQ.
I cycled through several bearish positions taking profits during the week. Starting with the extreme selling that closed the previous week, I saw the immediate risk/reward favoring a rebound. The extreme selling sent the NASDAQ into its first 6-day losing streak since 2019. I even finally closed out my short in ARK Autonomous Technology & Robotics ETF (ARKQ). See A Sunny Mid-Summer Assessment of the ARK Bottom for more on my current strategy trading the speculative ARK funds.
Instead of stepping back, sellers maintained the pressure through the Thursday lows. Yet, I still expected buyers to hold Friday’s gap up with shorts closing out ahead of the holiday weekend. I even bought calls in XLI and XME in case the rally held and confirmed Thursday’s bottoming hammer patterns. When I opened fresh bearish positions during the week, I stayed relatively conservative with spreads instead of outright long puts. Follow-through selling in the coming week will make me more aggressive down to oversold trading conditions.
Three charts caught my attention at the close of trading.
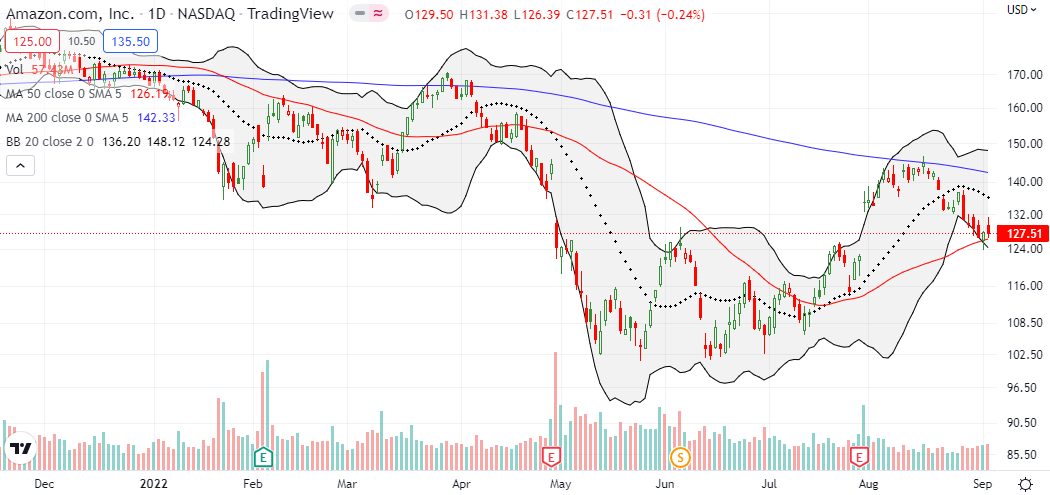
Amazon.com (AMZN) managed to avoid a close below its 50DMA. The fight was strong enough to keep AMZN in play for a confirmed bottom at 50DMA support if buyers turn things right around in the coming week. Note how AMZN printed a bottoming hammer right at 50DMA support just like AAPL did on Thursday. Unlike AAPL, AMZN survived the day’s fade with a near flat performance.
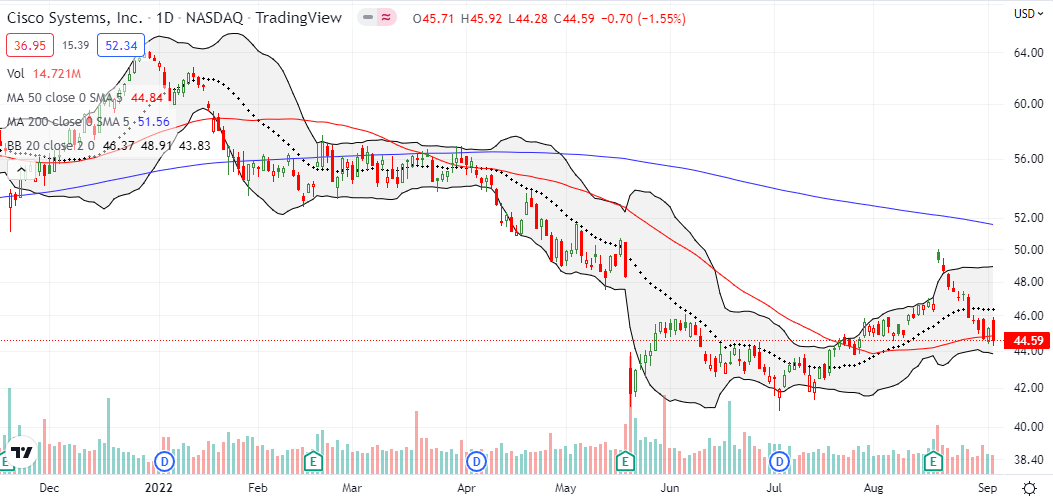
The market positively received so many earnings reports only to have sellers ruin the party with bear market trading action. Cisco Systems, Inc (CSCO) delivered just such a classic disappointment last month. CSCO gapped higher post-earnings for a 5.8% gain. Buyers essentially disappeared from there. CSCO is now struggling to hold on to 50DMA support. The stock is a buy above $46. Such a move would clear out the congestion on top of the 50DMA. CSCO is a (fresh) short like so much of the market if it trades lower from here.
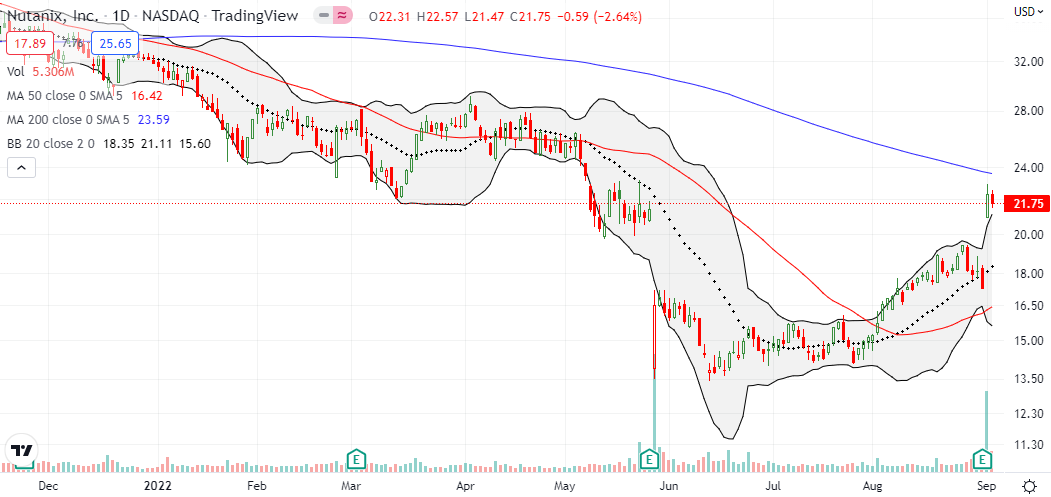
Nutanix, Inc (NTNX) is the latest potential post-earnings disappointment. The company delivered upside surprises, including significant increases in revenue and earnings guidance. NTNX soared 29.1% in response and finished closing the gap down from May. However, the stock stopped just short of its declining 200DMA resistance before pulling back on Friday by 2.6%. While I remain long NTNX, I am not optimistic that the stock can become the exception to the rule of confirmed bear market resistance.
Be careful out there!
Footnotes
“Above the 50” (AT50) uses the percentage of stocks trading above their respective 50-day moving averages (DMAs) to measure breadth in the stock market. Breadth defines the distribution of participation in a rally or sell-off. As a result, AT50 identifies extremes in market sentiment that are likely to reverse. Above the 50 is my alternative name for “MMFI” which is a symbol TradingView.com and other chart vendors use for this breadth indicator. Learn more about AT50 on my Market Breadth Resource Page. AT200, or MMTH, measures the percentage of stocks trading above their respective 200DMAs.
Active AT50 (MMFI) periods: Day #44 over 20%, Day #38 over 30% (overperiod), Day #1 under 40% (underperiod ending 30 days above 40%), Day #4 under 50%, Day #5 under 60%, Day #6 under 70% (ending 1 day overbought)
Source for charts unless otherwise noted: TradingView.com
Full disclosure: long QQQ put spread and put, long NTNX
FOLLOW Dr. Duru’s commentary on financial markets via StockTwits, Twitter, and even Instagram!
*Charting notes: Stock prices are not adjusted for dividends. Candlestick charts use hollow bodies: open candles indicate a close higher than the open, filled candles indicate an open higher than the close.


I agree with your bearish call as corporate earnings could fade as most sources I am reading think consumers
Are taking out on debt to keep spending high. Along with a hawkish fed could be more pain coming.
Also the fade Friday seemed to be more about Russia closing its pipeline…no? This could drastically effect German industry. One positive effect for my portfolio has been uranium,
Which I have been long a while.
That explanation for the fade could be true. When there are several important news events in a day, cause and effect can become a swirl. I was biased because I never thought about the news of Russia closing the pipeline as new news. Russia is an on-going threat looming over the European economy.
I was long the uranium ETF a long while back but then gave up!