Stock Market Commentary:
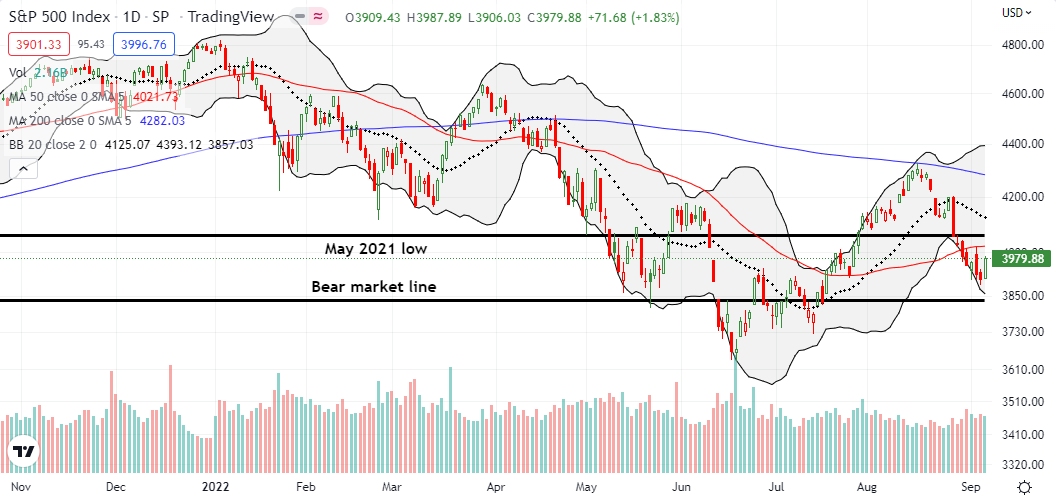
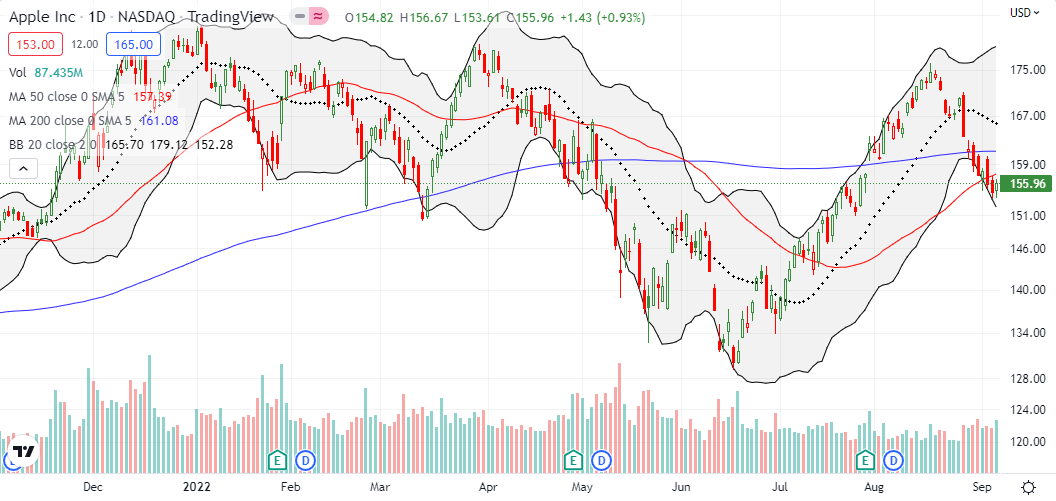
Even sellers in a bear market exhaust themselves at some point. That point happened to coincide with the latest product announcements from Apple Inc (AAPL). So once again, AAPL finds itself sitting right at the focal point of an important market juncture. Across the major indices, the day’s relief rally generated a stretch toward key resistance at 50-day moving averages (DMAs) (the red lines in the charts below). AAPL launched its stretch toward 50DMA resistance on the backs of a 0.9% post-news gain. Typically, the market fades these news-related rallies in AAPL, but this time could be different because of the extreme selling that preceded this catalyst. This overdue relief rally will get more fuel on 50DMA breakouts.
The Stock Market Indices
The S&P 500 (SPY) fell 6 days of 7 going into the day’s trading. That streak exactly matched the June sell-off in duration although it stopped short in intensity. The index gained 1.8% and now looks ready to challenge overhead resistance at its 50DMA. Still, I executed a modest fade with an SPY calendar put spread at the $393 strike. Accordingly, I expect the short side of this position to expire worthless this week. The expiration will give me a cheaper play on the potential for more selling next week following a fail at 50DMA resistance. Apple’s positioning and the potential for 50DMA breakouts kept me from getting aggressive. I am also watching for a potential trading range between or around the bear market line and the May, 2021 low.
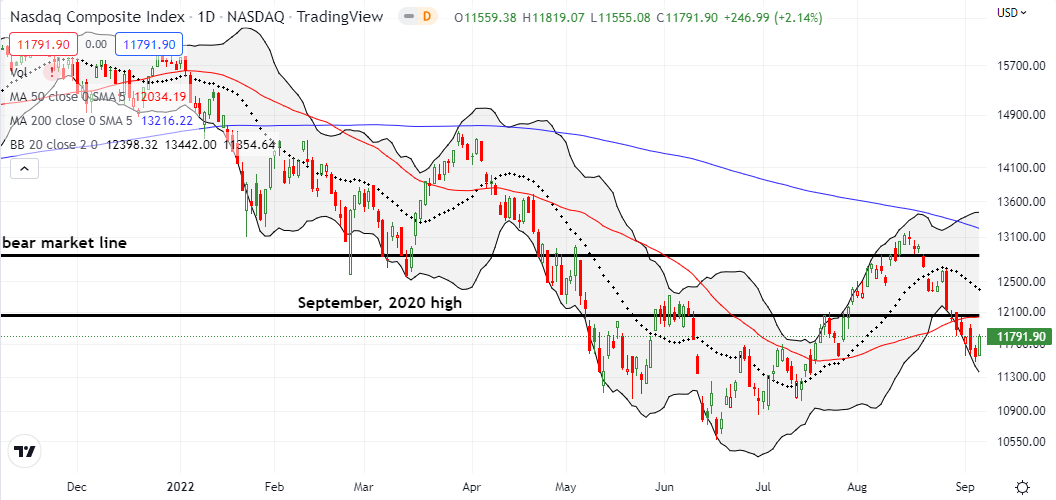
The technicals on the NASDAQ (COMPQ) gained more than the S&P 500, but the tech-laden index is a little further away from its 50DMA resistance. A fresh 50DMA breakout would put the NASDAQ in position to re-establish a trading range between the September, 2020 high and the bear market line. I rolled bearish positions in the QQQs. I took profits on the October put spread and bought a much cheaper weekly calendar put spread. The 7 straight days of selling seemed extreme enough to warrant locking in profits even on a longer-dated position like the put spread. A bounce felt way overdue.
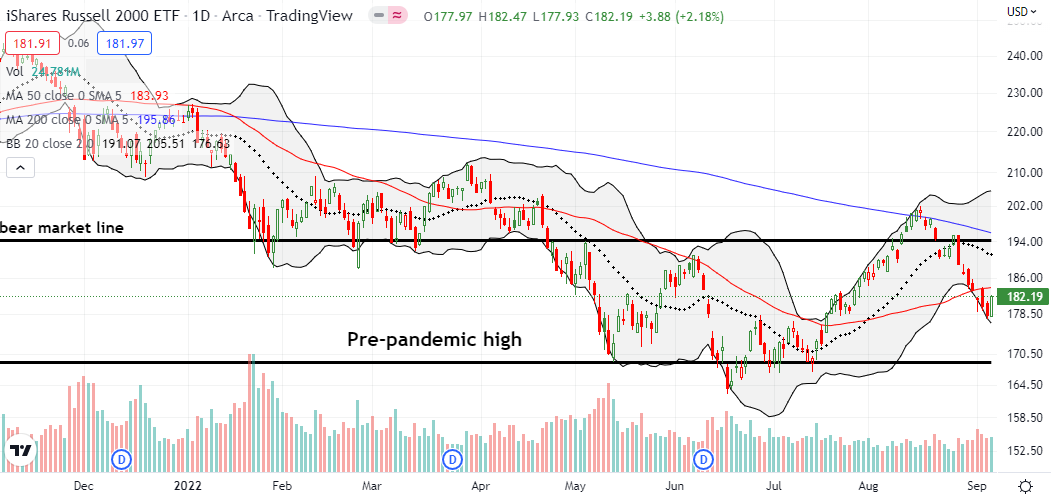
The iShares Russell 2000 ETF (IWM) remained in synch with the S&P 500 and the NASDAQ. The ETF of small caps made a stretch for 50DMA resistance with a 2.2% gain. IWM is positioned to break out before the NASDAQ if buyers manage to maintain the pressure.
Stock Market Volatility
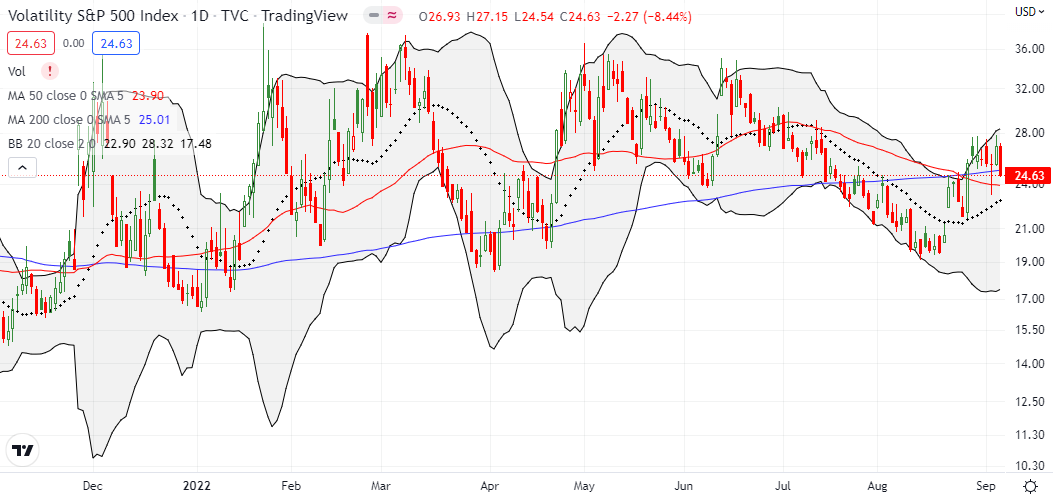
The volatility index (VIX) reversed 8.4% on the day’s relief rally. While the VIX remains in breakout territory, a fresh breakdown looms if buyers keep up the pressure. A breakdown in synch with 50DMA breakouts would be sufficient confirmation of a bullish change in sentiment.
The Short-Term Trading Call With A Stretch Toward Key Resistance
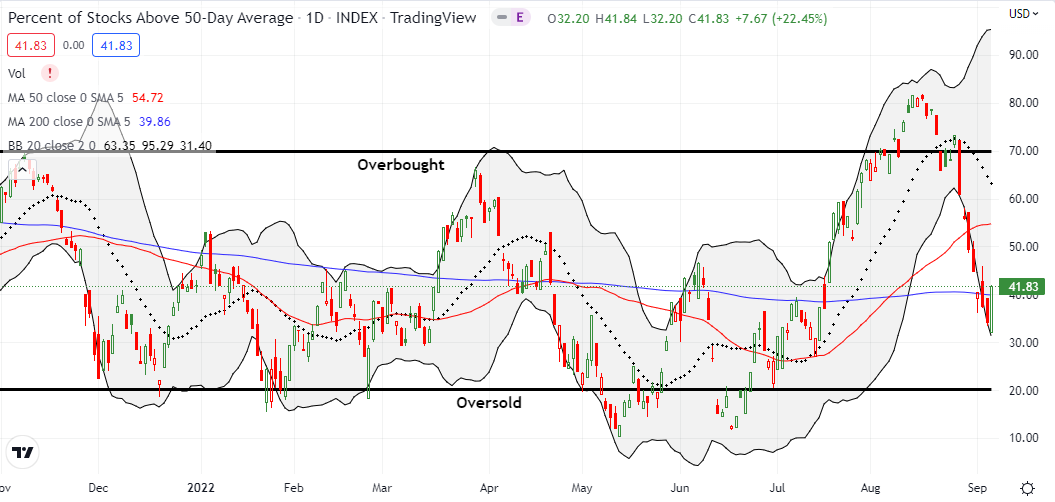
- AT50 (MMFI) = 41.8% of stocks are trading above their respective 50-day moving averages
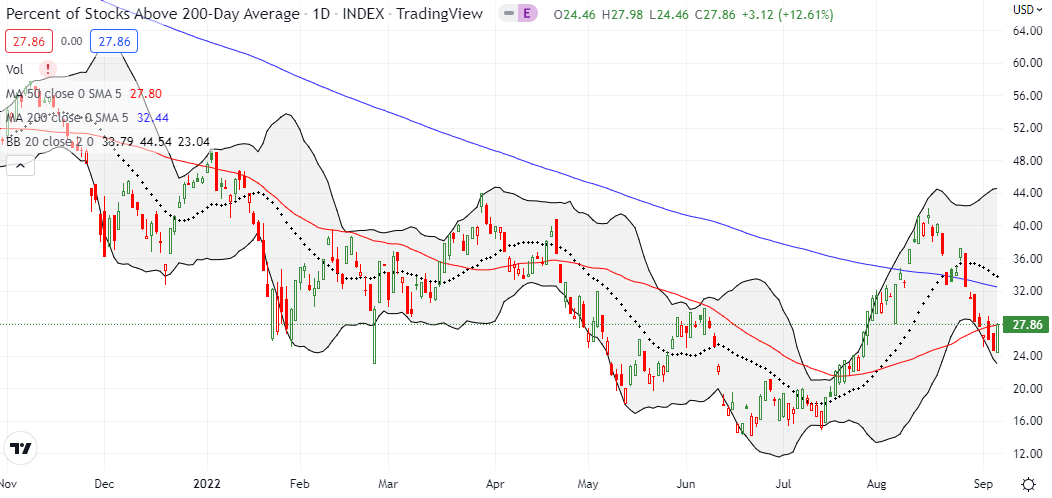
- AT200 (MMTH) = 27.9% of stocks are trading above their respective 200-day moving averages
- Short-term Trading Call: cautiously bearish
AT50 (MMFI), the percentage of stocks trading above their respective 50DMAs, surged from 32.2% at the intraday low to a 41.8% close. This sharp reversal serves as my first and most convincing sign to change my short-term trading call from bearish to cautiously bearish. A 50DMA breakout will immediately push me to neutral. I will not wait for confirmation because AT50 jumped from “close enough” to oversold territory in the low 30%s. I will only go to bullish with an oversold reading on AT50, especially given all the headwinds swirling around the stock market.
The SentimenTrader tweeted a particularly convincing reason to come off the bearish ledge and prepare to go neutral. Institutional investors have apparently taken their options trading to the exact opposite extreme from last year’s startling spike in call buying. The current, sharp surge in put buying suggests that the stock market could have gone a LOT lower, but these market participants must feel comfortably hedged. It is hard to imagine getting even more extreme from here. A very sharp relief rally could unfold the minute these put holders sense a bullish shift in the winds.
The next Federal Reserve meeting is September 21st. Even with Fed speak staying disciplined and hawkish – like Fed Vice Chair Lael Brainard today declaring “we are in this for as long as it takes to get inflation down…we have expeditiously raised the policy rate to the peak of the previous cycle, and the policy rate will need to rise further” – the market only needs to see one positive anti-inflationary data point to stretch like a rocket from here. After all, Brainard also laid out the scenario for the potential risks of over-tightening on monetary policy.
Be careful out there!
Footnotes
“Above the 50” (AT50) uses the percentage of stocks trading above their respective 50-day moving averages (DMAs) to measure breadth in the stock market. Breadth defines the distribution of participation in a rally or sell-off. As a result, AT50 identifies extremes in market sentiment that are likely to reverse. Above the 50 is my alternative name for “MMFI” which is a symbol TradingView.com and other chart vendors use for this breadth indicator. Learn more about AT50 on my Market Breadth Resource Page. AT200, or MMTH, measures the percentage of stocks trading above their respective 200DMAs.
Active AT50 (MMFI) periods: Day #46 over 20%, Day #40 over 30%, Day #1 over 40% (overperiod ending 2 days under 40%), Day #6 under 50%, Day #7 under 60%, Day #8 under 70%
Source for charts unless otherwise noted: TradingView.com
Full disclosure: long QQQ put spread and calendar put spread, long SPY calendar put spread
FOLLOW Dr. Duru’s commentary on financial markets via StockTwits, Twitter, and even Instagram!
*Charting notes: Stock prices are not adjusted for dividends. Candlestick charts use hollow bodies: open candles indicate a close higher than the open, filled candles indicate an open higher than the close.


