
Stock Market Commentary
The S&P 500 (SPY) finally broke down and succumbed to the selling pressure building up in the stock market. A “surprise” surge in inflation as measured by the Consumer Price Index (CPI) delivered the headline catalyst for a day of broad-based selling. Given market breadth was already in the process of narrowing, I consider this week’s pullback as the release of sellers looking for an excuse to rush for the exits. Given key stock market indicators hit extremes, sellers should meet heavier resistance to lower prices until fresh buyers exhaust themselves in a relief rebound.
Still, sellers will have a lot of work ahead to make their case as the S&P 500 tests support at its 50-day moving average (DMA). For example, since last year’s April breakout above the 50DMA, the S&P 500 has closed below that line all of 15 trading days. The last time the S&P 500 spent more than a day below its key support line was the brief October pullback.
The Stock Market Indices
Last week ended with a fresh all-time high for the S&P 500 (SPY) that defied my expectations for a May pullback. In just three days from that point, the index hit my first downside target at the 50DMA. On the previous day, the S&P 500 broke through my 4116 line dividing neutrality and bearishness only to rebound above that line. Today, the index wasted no time driving into a bearish breakdown. However, the close well below the lower Bollinger Band (BB) put the S&P 500 in a short-term extreme position. A bounce from here at least back to the lower BB will not surprise me. A gap down below the 50DMA from here would further stretch the extreme positioning.
Note I am still holding my SPY put spreads although the S&P 500 hit my downside target for May; next downside target is a complete reversal of the April breakout.
A double top in the NASDAQ (COMPQX) looks more and more prominent with this week’s sell-off. The NASDAQ is already down 5.2% for the week with a confirmed 50DMA breakdown for good measure. With three straight days of trading below the lower-BB, the tech laden index is stretched into a more and more extreme position. Like Tuesday’s immediate rush to buy into the gap down, I am guessing buyers are set to give a rebound another try.
A topping pattern is slowly but surely developing in the iShares Trust Russell 2000 Index ETF (IWM). Just last week, the pivot around the 50DMA had the potential to create the kind of consolidation that launches stocks higher. Instead, the confirmed 50DMA breakdown and 3-month closing low positions IWM for an eventual test of 200DMA support.
Stock Market Volatility
Right after I figured the volatility index (VIX) may have exhausted itself, it sprang to life instead. The 26.3% 1-day surge is an unsustainable concentration of fear. The VIX is even up 65% in three days. Recent history alone shows how quickly the volatility faders pounce on such a surge. Still, I am keeping a firm grip on my ProShares Ultra VIX Short-Term Futures ETF (UVXY) call options just in case the market manages to get even more extreme in the immediate term. I just wish UVXY could manage the VIX’s uplift; UVXY is up 49.2% for the week despite it serving as a leveraged play long volatility.
The Short-Term Trading Call Amid the Extremes
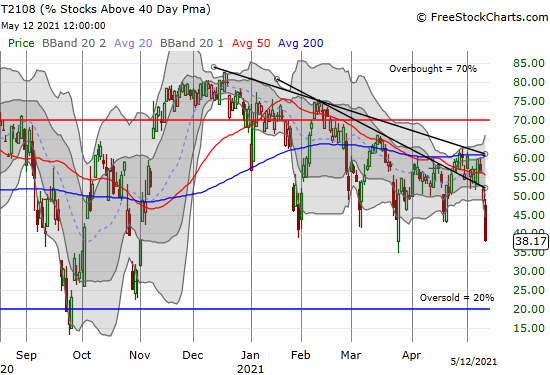
- AT40 (T2108) = 38.2% of stocks are trading above their respective 40-day moving averages
- AT200 (T2107) = 72.3% of stocks are trading above their respective 200-day moving averages (TradingView’s calculation)
- Short-term Trading Call: cautiously bearish
AT40 (T2108), the percentage of stocks trading above their respective 40DMAs, delivered its own extreme. My favorite technical indicator closed last week at 59.7%. Today, AT40 closed at a 6-month low at 38.2%. AT40 confirmed the new primary downtrend, but moved quickly from throwing a fresh yellow flag, to an outright bearish flag, to now a selling extreme below the former primary downtrend. The chart below shows how previous spikes into these depths were quite short-lived.
The collective extremes – major indices closing below lower BBs, the VIX surging fast and furious, and AT40 swiftly dropping below 40% – makes for a difficult decision on the short-term trading call. I see confirmation of a bearish shift in the stock market, but the extremes make a rebound highly likely…as soon as Thursday morning. I flipped to cautiously bearish to reflect my change in sentiment starting with Monday’s weak trading and emboldened by Tuesday’s gap down and subsequent exhaustion buying. Yet, I need to brace for a rebound and acknowledge that I will need to churn the trading call to bullish if the stock market gets more extreme with an official oversold reading of AT40 below 20%. In other words, I am threading needles and positioned for fast short-term trades.
A steady deterioration in the longer-term indicator AT200 (T2107), the percentage of stocks trading above their respective 200DMAs, carries a louder and louder warning. AT200 accelerated to the downside over the last seven trading days. It closed at levels last seen shortly after the insurrection at the U.S. Capitol. So even with the stock market poised to rebound out of the current extremes, I see prospects ahead for better entry points to fade the stock market.
The stock charts in the previous Above the 40 post still tell the tale of the market. They provide a great reference point for the carnage of this week. The following charts provide just a sliver of the follow-through warnings from the market.
Stock Chart Reviews – Below the 50DMA
Apple (AAPL)
One key test of market sentiment comes in the form of Apple (AAPL). The stock easily survived the February/March sell-off without a test of 200DMA support. This time around, AAPL plowed right into its 200DMA. AAPL last touched this important trendline a full 13 months ago. A breakdown immediately puts the March lows in play and will likely grease the skids for market sentiment. Note I used this gap down to dip into the AAPL weekly trade a day early. This position takes some of the edge off my bearishness.
Chipotle Mexican Grill (CMG)
Another stalwart of market sentiment comes in the form of Chipotle Mexican Grill (CMG). The stock got a bit sleepy this year, but it contently followed along its 50DMA. Now, CMG closed below its 200DMA for the first time in 13-months (sound familiar?). Chipotle recently announced a $15 minimum wage for its restaurant staff. Wall Street hates sharing profits and accordingly punishing CMG. I see an imminent test of the March intraday low which was a test of 200DMA support.
Stock Chart Reviews – Above the 50DMA
The iShares Trust U.S. Home Construction ETF (ITB)
The seasonal trade on homebuilders probably received its curtain call with the last two days of selling. On Monday, I was downright perplexed by the rush to buy stocks throughout the housing market complex. The iShares Trust U.S. Home Construction ETF (ITB) rushed over $78 before fading to flat even as the S&P 500 lost 1.0%. Two days of subsequent selling took ITB right to 50DMA support as long-term interest rates marched higher.
If the market rebounds, I like the chances for ITB to climb swiftly. As a result, I accumulated June call options Tuesday and Wednesday right at the close both days (Tuesday was a test of 20DMA support which had held since mid-March). This position takes more of the edge off my bearishness. Still, I do not see ITB making new highs for quite some time to come. My latest housing market review left some open questions about existing home sales.
Best Buy (BBY)
While Monday’s rush in the home builders turned into a major fakeout, Best Buy (BBY) experienced an even more dramatic fakeout. BBY surged past $128 before settling for a 2.8% gain and an all-time high. Like ITB, sellers took two trading days to punch BBY right back to 50DMA support. I did not dip into a position here, but BBY is at the top of my list on a Thursday rebound. The stock is worth a rebound that at least tries to reverse today’s 4.5% loss.
Teucrium Corn Fund (CORN)
I have a feeling Teucrium Corn Fund (CORN) will turn into one of my biggest regrets in the commodity and materials space that I love so much in this cycle. Patiently, I sat in a position in CORN based on stories months ago about food inflation and a bullish breakout in CORN. I took profits after CORN surged in mid-January following an already parabolic run-up. A presumed and sizeable pullback never followed. I failed to scramble back in on the bullish breakout at the end of March. Charts like these help remind the market about the prospects for higher prices spreading throughout the economy.
Be careful out there!
Footnotes
“Above the 40” (AT40) uses the percentage of stocks trading above their respective 40-day moving averages (DMAs) to measure breadth in he stock market. Breadth indicates the distribution of participation in a rally or sell-off. As a result, AT40 can identify extremes in market sentiment that are likely to reverse. Above the 40 is my alternative name for “T2108” which was created by Worden. Learn more about T2108 on my T2108 Resource Page. AT200, or T2107, measures the percentage of stocks trading above their respective 200DMAs.
Active AT40 (T2108) periods: Day #129 over 20%, Day #113 above 30% (overperiod), Day #1 under 40% (underperiod ending 110 days over 40%), Day #1 under 50%, Day #23 under 60%, Day #42 under 70%


Black line: AT40 (T2108) (% measured on the right)
Red line: Overbought threshold (70%); Blue line: Oversold threshold (20%). Source: FreestockCharts
Source for charts unless otherwise noted: TradingView.com
Grammar checked by Grammar Coach from Thesaurus.com
Full disclosure: long UVXY calls, long SPY puts, long AAPL calls, long ITB calls
FOLLOW Dr. Duru’s commentary on financial markets via StockTwits, Twitter, and even Instagram!
*Charting notes: Stock prices are not adjusted for dividends. Candlestick charts use hollow bodies: open candles indicate a close higher than the open, filled candles indicate an open higher than the close.