
Housing Market Intro and Summary
In March, home builder stocks pushed through softening housing data thanks in large part to builder-specific catalysts. In April, a series of strong earnings reports and a healthy rebound in the new homes market combined to propel most housing-related stocks higher still. The contrast between existing and new homes stood out in the latest data as only new homes enjoyed a strong start to the spring selling season. The winding down of the coronavirus pandemic in the U.S. offers the potential for motivating reluctant sellers later this spring or early summer. Like last year, the profile of this year’s spring selling season could extend well into the summer.
Housing Stocks
The iShares Dow Jones US Home Construction Index Fund (ITB) gained 7.9% in April and is up 31.2% year-to-date. The seasonal trade on home builders is firing on all cylinders this year as ITB far outstrips the S&P 500’s 11.3% year-to-date performance (+5.2% for April).
M/I Homes (MHO) is one of several home builders leading the way higher. MHO gained 8.1% last week post-earnings and continued higher for the week to fresh all-time highs. MHO is up a whopping 57.4% year-to-date.
A few builders disappointed the stock market. Taylor Morrison Home Corp (TMHC) dropped 2.8% post-earnings and pulled back another 2.1% the next day. This response looks poor relative to other builders. However, TMHC still enjoys an uptrend as defined by its 50DMA (the red line in the chart below).
My biggest trade on the seasonal strength in home builders was actually a housing “catch-up” play with Meritage Homes (MTH). The 11.7% post-earnings surge was a great validation of my buying thesis. Unfortunately, I mistakenly took profits in MTH as it rallied the week before earnings. The gaffe feels even worse as I greatly anticipated a good post-earnings response for MTH after seeing other builders perform so well. I looked forward to reaping the benefits of a position I no longer owned! Now, I can only spectate in the event a pullback gives a fresh entry point for MTH (like anywhere between $100-103).
Housing Data
New Residential Construction (Single-Family Housing Starts) – March, 2021
The February data showed softening data for single-family housing starts. Starts normalized and returned to the year ago levels and the existing uptrend. March starts bounced smartly off the uptrend as if the spring selling season suddenly changed the collective minds of builders. Single-family home starts jumped to 1,238,000 which was 15.3% above February’s 1,146,000 starts (revised sharply upward from 1,040,000). Starts were up 40.7% year-over-year; recall that housing starts came to a screeching halt in many parts of the country in the pandemic-related lockdowns a year ago. The rate of year-over-year change has been positive for nine straight months.
Source: US. Bureau of the Census, Privately Owned Housing Starts: 1-Unit Structures [HOUST1F], first retrieved from FRED, Federal Reserve Bank of St. Louis, April 29, 2021.
The West had the weakest year-over-year growth of the four regions. Housing starts in the Northeast, Midwest, South, and West each changed +55.2%, +98.3%, +38.6%, +13.5% respectively year-over-year.
Existing Home Sales – March, 2021
Existing home sales dropped to levels last seen August, 2020 and failed to get a bounce from the start of the spring selling season. The seasonally adjusted annualized sales in March of 6.01M decreased 3.7% month-over-month from the marginally upwardly revised 6.24M in existing sales for February. Similar to February’s month-over-month decline, the National Association of Realtors (NAR) blamed March’s decline on insufficient inventory. Still, absolute inventory increased slightly from February. Year-over-year sales increased 12.3% over last year’s lockdown-impacted sales.
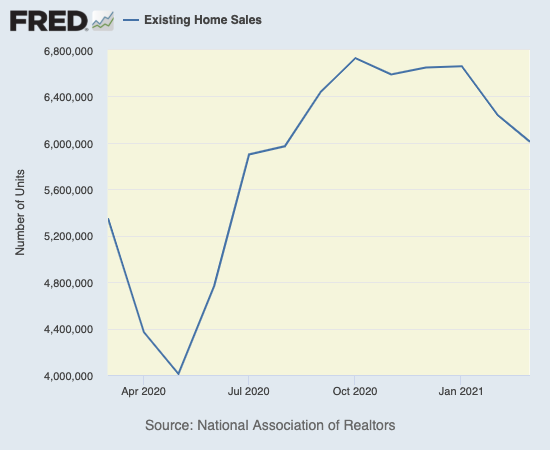
(As of the March, 2018 data, the NAR further reduced historical data to just 13 months. For historical data from 1999 to 2014, click here. For historical data from 2014 to 2018, click here) Source for chart: National Association of Realtors, Existing Home Sales© [EXHOSLUSM495S], retrieved from FRED, Federal Reserve Bank of St. Louis, April 29, 2021.

The absolute inventory level of 1.07M homes increased by 0.04M from February. Inventory plunged 28.2% year-over-year, just off from February’s all-time record 29.5% year-over-year decline (compare to January’s 25.7%, December’s 23%, November’s 22%, October’s 19.8%, September’s 19.2%, August’s 18.6%, July’s 21.1%, June’s 18.2%, and May’s 18.8% year-over-year declines, unrevised). The inventory situation remains extremely tight for existing homes with no relief in sight. “Unsold inventory sits at a 2.1-month supply at the current sales pace, marginally up from February’s 2.0-month supply and down from the 3.3-month supply recorded in March 2020. Inventory numbers continue to represent near-historic lows.”
Given the constraints on the spring selling season, I remain surprised by the NAR’s optimistic forecast for an 8.2% year-over-year increase in single-family existing home sales. The forecast does not align with the on-going issues of affordability and tight inventories. In February, the softening housing data seemed to have the NAR reconsidering its forecast as it “…cautioned of a possible slowdown in growth in the coming months as higher prices and rising mortgage rates will cut into home affordability.” March’s report did not include an update on this outlook. Indeed, the NAR flipped back to a shade of optimism driven by the strong housing starts data: “recent housing starts and job creation data show encouraging dynamics of more supply and strong demand in the housing sector.”
The average 18 days it took to sell a home set a new all-time record low that zipped past the record of 20 set in February (the NAR did not acknowledge the record this time). The on-going year-over-year decline in inventory is on a 22-month streak. The dearth of supply propels prices ever higher and reduces affordability.
The median price of an existing home soared to $329,100 and set a new record high. Prices have increased year-over-year for 109 straight months, and March’s was a 17.2% year-over-year gain. The percentage gain was also an all-time record. The median price increased from February by 5.9%.
Soaring prices are not stopping first-time home buyers. First-time home buyers took a 32% share of sales in March. This increase from February’s 31% share demonstrates that a lot of buyers are pushing through affordability issues. The NAR’s 2017 Profile of Home Buyers and Sellers reported an average of 34% for 2017, 33% for 2018, 33% for 2019, and 31% for 2020. Investors took a 15% share of sales, down from February’s 15%, up from 13% a year ago and the same as January.
For the second month in a row, the Midwest was the major laggard in sales across the regions. The regional year-over-year changes were: Northeast +16.9%, Midwest +0.8%, South +15.9%, West +15.5%.
All regions have registered strong year-over-year price gains since May. For February: Northeast +21.4%, Midwest +13.5%, South +15.6%, West +16.8%.
Single-family home sales decreased 4.3% from February and increased on a yearly basis by 10.4%. The median price of $334,500 was up 18.4% year-over-year.
California Existing Home Sales – March, 2021
California set several records for existing sales in March. Over 66% of existing homes sold above the asking price. The median home price hit a new all-time high with every major region setting new price records. Twenty-seven of fifty-one counties also set all-time highs in price. The $357 cost per square foot was also an all-time high, up 24.0% year-over-year. The price pressures created a record sales-price-to-list-price ratio of 102.2%. The mere median 8 days required to sell a home set an all-time record low, almost half of the 15 days required for a sale a year ago.
For March, the California Association of Realtors (C.AR.) reported 446,410 in existing single-family home sales for California. Sales decreased 3.5% from February and increased 19.7% year-over-year. At $758,990 the median price jumped 8.6% month-over-month and 23.9% year-over-year.
Inventory dropped to 1.6 months of sales in March from 2.0 in February. California is hitting the spring selling season with bare cupboards. However, the C.A.R. is confident that the waning threat of the pandemic will encourage more sellers to put their homes on the market. However, California will not officially reopen until June 15th. The spring selling season will be near over by then. Perhaps the spring selling season will stretch further like last year (but for different reasons of course: pent-up selling interest meeting surging demand). Active listings dropped 51.5% year-over-year, a ninth straight month of 40%+ declines. Sonoma and San Francisco were the only two counties with an increase in listings. San Francisco listings soared 95.3%! This dramatic change reflects the “exodus” from California widely reported in the media; this out-migration is really about changing attitudes about living in San Francisco.
New Residential Sales (Single-Family) – March, 2021
Softening housing data drove new home sales in February to the lowest point since the early months of the pandemic. For March, sales rebounded sharply and are sure to pressure housing starts to stay above trend. March sales increased 20.7% to 1,021,000, up from February’s significantly, downwardly revised 846,000 sales. Sales were up 66.8% year-over-year. The chart below shows that the pace of new home sales bounced off the uptrend line which represents normalization.
Source: US. Bureau of the Census, New One Family Houses Sold: United States [HSN1F], first retrieved from FRED, Federal Reserve Bank of St. Louis, April 30, 2021.
Median home prices fell for a third month in a row. The 4.4% drop took the median sales price to $330,800 which was a 0.8% year-over-year increase. Still, the previous breakout in price completely reversed in March. The price drop occurred as the $200,000 to $299,000 price range gained in share from 29% to 35% as all other price segments stayed flat or lost share.
The monthly inventory of new homes for sale declined from 4.8 in May to 3.4 in August. Since then, inventory jumped back up to 4.3 for December and moved back to 4.8. In March, inventory plunged all over again to 3.6 months of sales. A well-balanced market has inventory around 6 months worth of sales.
The West was a major laggard among the regions in March for year-over-year sales growth. The Northeast soared 108.7%. The Midwest increased 78.4%. The South increased 90.1%. The West decreased for a second month in a row; this time 2.0%. Sales of new single-family homes in the West have been incredibly volatile. Sales in March were just 6,000 above the pandemic trough from last April. I need to study the recent earnings reports from homebuilders to better understand the constraints on the market in the West, especially given starts in the West grew the slowest of the regions as well.
U.S. Census Bureau and U.S. Department of Housing and Urban Development, New One Family Houses Sold: United States [HSN1F], retrieved from FRED, Federal Reserve Bank of St. Louis, April 30, 2021
Home Builder Confidence: The Housing Market Index – April, 2021
The National Association of Home Builders (NAHB) reported a one point increase in the NAHB/Wells Fargo Housing Market Index (HMI) to 83. The tone of previous reports suggested confidence is lower than the numbers reveal. For March, the NAHB was outright pessimistic when it blamed higher mortgage rates and lumber prices for a mere two point drop in confidence. For April, the NAHB pointed to strong demand as a driver boosting confidence. All the headwinds remain. The NAHB particularly called out problems in the supply chain – “the supply chain for residential construction is tight, particularly regarding the cost and availability of lumber, appliances, and other building materials” – and pleaded for help from policymakers.
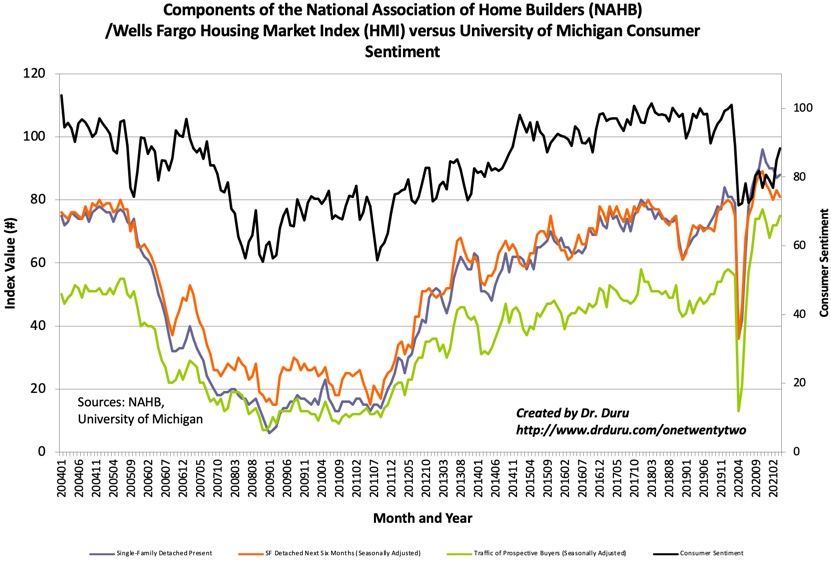
Source for data: NAHB
While the components for the Housing Market Index bounce around, consumer confidence is on a definitive rebound. The confidence should translate into sustained interest in home buying which will in turn further pressure the housing supply chain. All these dynamics are fresh fuel for higher and higher prices ahead.
The regional data were evenly split. The Northeast dropped from 86 to 84, and the Midwest fell from 78 to 75. The South increased from 82 to 84, and the West jumped from 88 to 92. I am looking for this extremely high confidence in the West to indicate stronger performances in new home sales and starts in the West.
Home closing thoughts
Zoomtowns in California
The stories abound of people leaving California to go work remotely in cheaper states across the country. However, an important contingent of workers are staying planted in California. These workers are flocking to (relatively) cheaper and scenic areas like Truckee. Existing residents are sometimes unhappy with the sudden influx.
“They automatically think, ‘Oh my God, who is coming in and taking over our city?’” Padilla said. “And then they get to know us. They came from somewhere at some point too, right?”
“California “Zoom town” grapples with influx of remote workers” – Marketplace, April 13, 2021
Lumber Prices Not Going Back to “Normal” Anytime Soon
The NAHB is pleading for help to get supply chain costs down. Lumber costs are a particular pain point. Unfortunately, it seems problems in Canada will limit the amount of remediation possible in the near-term.
“He said the average age of U.S. homes is approaching 45, so demand for wood for repairs and remodels has been building way longer than the pandemic has been around. And natural disasters have cut supply…
‘In Canada, in particular western Canada, British Columbia, the forests up there have been faced with infestations of mountain pine beetle. Basically killed every third tree,’ Duncanson said. “
Be careful out there!
Full disclosure: long LEN calendar call spread