
Stock Market Commentary
The Federal Reserve signaled an incremental improvement in its economic outlook by making an allowance for limited stock repurchases and dividends by the country’s top financial institutions. As a result, bank stocks apparently soared in after hours trading. That fresh rally in financials should extend to a positive open on Monday and provide yet more fuel to what is now a confirmed extended overbought rally whose duration is historic.
“In light of the ongoing economic uncertainty and to preserve the strength of the banking sector, the Board is extending the current restrictions on distributions, with modifications. For the first quarter of 2021, both dividends and share repurchases will be limited to an amount based on income over the past year. If a firm does not earn income, it will not be able to pay a dividend or make repurchases.”
“Federal Reserve Board releases second round of bank stress test results” – U.S. Federal Reserve, December 18, 2020.
A week ago, I described a key threshold for this overbought rally. The stock market slipped easily through this threshold by cruising to a rebound from the latest mild pullback. That pullback created a kind of bullish divergence. These extended overbought conditions signal the strength of the buying power in the stock market.
The Stock Market Indices
The S&P 500 (SPY) started the week with a 0.4% loss which seemed to set the stage for follow-through selling. Instead, the selling came to an abrupt halt right at the support of the uptrending 20-day moving average (DMA). The index hit an all-time high on Thursday and bookended the week with another 0.4% loss.
The NASDAQ (COMPQX) sprinted ahead of the S&P 500 by opening the week with relative strength and a 0.5% gain. Traders treated an intraday dip on Friday like a precious buying opportunity and sent the tech-laden index right back to flat on the day. The NASDAQ looks particularly poised to stretch the historic limits of extended overbought conditions.
Stock Market Volatility
The volatility index (VIX) jumped 6.1% on Monday and seemed to confirm that more trouble lay ahead. The next day, the VIX promptly gapped down and reversed all its gains and then some. On Friday, the VIX jumped again but faders were even more effective. The VIX closed the day with a 1.6% loss. With the 20 level holding as support, the VIX may be setting up for an extended trading range.
The Short-Term Trading Call: Extended Overbought Conditions

- AT40 = 80.0% of stocks are trading above their respective 40-day moving averages (Day #25 overbought)
- AT200 = 86.4% of stocks are trading above their respective 200-day moving averages TradingView’s calculation).
- Short-term Trading Call: neutral
After two straight weeks of closing at 79.6%, AT40 (T2108), the percentage of stocks trading above their respective 40DMAs, pulled back ever so slightly to 77.5% to close the previous week. Last week, AT40 slid back up to 80.0%. My favorite technical indicator seems listless in overbought territory, but it is really solidifying its grip on bullish market sentiment.
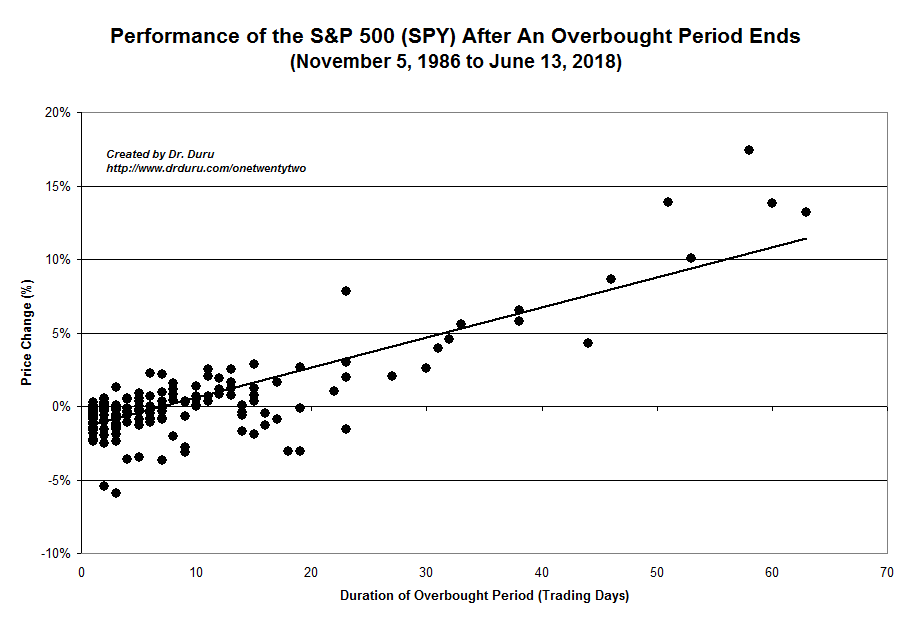
The stock market is on day #25 of overbought conditions. The index has 3.5% in gains since overbought trading resumed on November 13th. The historical chart below shows that 3.5% is right around the expected gains for the S&P 500 if the overbought period ended on the 25th day (projecting that the overbought period has more room to run). AT40 is in an extended overbought condition which suggests that the end of the overbought period will conclude with gains for the S&P 500. More importantly, the overbought period entered historic territory with only 14 other overbought periods lasting longer than this once since 1986 (chart does not include the last 2 1/2 years, time for an update!). Every passing day in this extended overbought condition is another bullish day for the stock market.
As promised, I am keeping the short-term trading call at neutral even though I am much more inclined to buy than short. The neutral rating reflects my deference to the risks in the economy that could deliver a pullback at any moment the market decides to care about the problems. How I treat that pullback will depend on the stock market’s relationship to the 70% threshold defining AT40 as overbought.
Stock Chart Reviews – Below the 50DMA
Big Lots (BIG)
Discount retailer Big Lots (BIG) has been stuck in a 4-month trading range. Two negative post-earnings reactions sent BIG to the bottom of this trading range, yet the stock refuses to break. The 5.1% loss on Friday threatens to break through this support. I am looking to buy on a test of uptrending 200DMA support.
Federal Express (FDX)
Federal Express (FDX) rose like a Phoenix after a post-earnings gap up in early July. The pandemic somehow cured Federal Express of two years of malaise. The resurgence slowed down after October’s all-time highs. Friday’s 5.7% post-earnings loss and 50DMA breakdown threatens to bring the run to a lasting pause. I am a buyer if/once FDX manages to close above its 50DMA again. The stock is a short if it cracks the October lows.
Splunk (SPLK)
The post-earnings recovery for Splunk (SPLK) is underway. With the stock at a post-earnings high, I am now targeting a test of 200DMA resistance.
Stock Chart Reviews – Above the 50DMA
Baidu (BIDU)
Baidu (BIDU) sold off post-earnings last month and tested 50DMA support. The stock launched from there. BIDU went parabolic last week following news the company will make its own electric vehicles (EVs). News about EVs and related technology is truly today’s equivalent of the dot-com excitement in 1999.
iShares Trust U.S. Home Construction ETF Fund (ITB)
Housing related stocks are largely stuck in a 5-month trading range. The iShares Trust U.S. Home Construction ETF Fund (ITB) came alive on Thursday on the heels of positive housing news. The 3.9% gain sets up ITB for an eventual breakout.
Redfin (RDFN)
I somehow just watched and watched Redfin (RDFN) even as I bought into competitor Zillow Group (ZG). I am puzzled by RDFN’s furious moonshot given the stock sold off sharply post-earnings last month. RDFN is yet one more case of so many where the stock market clearly shows confusion on how to price assets. Now, RDFN incredibly has notched a gain on every single day of December. The stock went near parabolic last week.
Intel (INTC)
Intel (INTC) got hammered on Friday with a 6.3% loss. I was in the middle of enjoying my latest between earnings trade on call options. I stubbornly doubled down on the call options in case the market decides soon that it actually does not care about rumors (or news) of Microsoft (MSFT) developing its own chips.
DataDog (DDOG)
Speculators in DataDog (DDOG) weekly calls made out like bandits on Friday. DDOG did not have company-specific news but almost anything related to network security and monitoring did well the last two days of the week. I like the overall technicals on DDOG after it pulled off a fresh 50DMA breakout this month. I am a buyer here.
Cyberark Software (CYBR)
DDOG’s gains paled in comparison to other cybersecutiry names.
I bought the 200DMA breakout in Cyberark (CYBR) back in July only to watch earnings take the stock back down to the bottom of what turned into a trading range. I stubbornly added to my position…still puzzled why so many of these stocks had not performed better to-date.
So last week’s surge on the heels of revelations of a major Russian hack was like a firestorm of interest in cybersecurity. I took profits about halfway through CYBR’s Friday moonshot. Now I wait for the next dip. The market to-date has proven incapable of appreciating the permanence and severity of the threat posed by hackers, especially state-sponsored intruders. Accordingly, I fully expect a major swoon as memories fade.
Palo Alto Networks (PANW)
I placed cybersecurity firm Palo Alto Networks (PANW) on my buy list after a successful test of 200DMA support in October/November. Somehow, I never pulled the trigger. I even failed to rush in after a rare positive post-earnings response in November. The current extended overbought rally is a major tailwind for any bullish story and narrative in the stock market.
Lululemon Athletica Inc (LULU)
Speaking of mispriced companies, the market is having issues pricing sports accessories company Lululemon Athletica Inc (LULU). After a brief post-earnings swoon in June, LULU rallied convincingly to all-time highs ahead of September earnings. The market next took LULU down sharply following September earnings. An eventual rebound stabilized the stock ahead of December earnings. A 6.7% post-earnings loss looked set to start the selling cycle all over again. This time, 50DMA support held firmly and the post-earnings swoon ended after just one day. Are you getting the message about the potential lack of message in post-earnings selling?
Virgin Galactic Holdings Inc (SPCE)
Just a week after I lamented taking profits on Virgin Galactic Holdings Inc (SPCE) at July resistance, I am already warming up to buy back into shares. SPCE suffered an unfortunate setback on a failed test flight. The selling barely abated all week. These kinds of failures are part of doing business for a pioneering company like SPCE. I am looking to buy with the stock testing 50DMA support. Like the last trade, I will be in accumulation mode.
ANGI Homeservices (ANGI)
In October, I wrote about chasing ANGI Homeservices after a 50DMA breakout. The breakout finally came last month. On Friday, ANGI finally delivered some convincing follow-through to the breakout. My first upside target is the July/August high.
Be careful out there!
Footnotes
“Above the 40” (AT40) uses the percentage of stocks trading above their respective 40-day moving averages (DMAs) to measure breadth in he stock market. Breadth indicates the distribution of participation in a rally or sell-off. As a result, AT40 can identify extremes in market sentiment that are likely to reverse. Above the 40 is my alternative name for “T2108” which was created by Worden. Learn more about T2108 on my T2108 Resource Page. AT200, or T2107, measures the percentage of stocks trading above their respective 200DMAs.
Active AT40 (T2108) periods: Day #48 over 20%, Day #32 above 30%, Day #31 over 40%, Day #30 over 50%, Day #29 over 60%, Day #25 over 70%


Red line: Overbought threshold (70%); Blue line: Oversold threshold (20%). Source: FreestockCharts
Source for charts unless otherwise noted: TradingView.com
Full disclosure: long UVXY, long ANGI, long INTC calls, long SPLK
FOLLOW Dr. Duru’s commentary on financial markets via StockTwits, Twitter, and even Instagram!
*Charting notes: FreeStockCharts stock prices are not adjusted for dividends. TradingView.com charts for currencies use Tokyo time as the start of the forex trading day.