
AT40 = 56.9% of stocks are trading above their respective 40-day moving averages (DMAs)
AT200 = 55.7% of stocks are trading above their respective 200DMAs
VIX = 12.6
Short-term Trading Call: neutral
Stock Market Commentary
It appears China and the U.S. finally agreed on a Partial, Phase One Trade Deal. The bare bones basics on the deal consist of China agreeing to buy $200B of agricultural products and the U.S. agreeing to stay its hand on a fresh round of tariffs as well as rolling back the last round of tariffs from 15% to 7.5%. The first three rounds of tariffs remain in place. In the larger context of U.S. trade goals, little has changed. The actual trade agreement (a reported 86 pages) is not yet public. At least one member of President Trump’s administration has expressed doubts about China’s ability to honor its commitments.
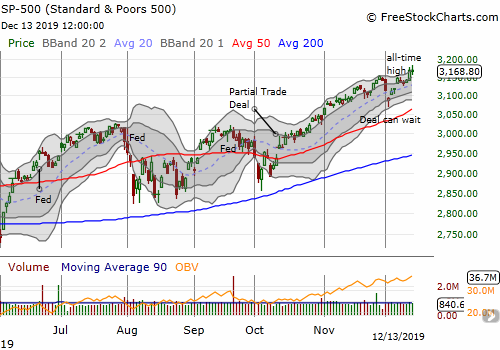
Given the the S&P 500 (SPY) rallied 6.7% since the announcement of a Partial Trade Deal, capped by a 0.9% rally on Thursday, it is not surprising that the stock market delivered an anti-climactic yawn on Friday on the news of a real agreement.
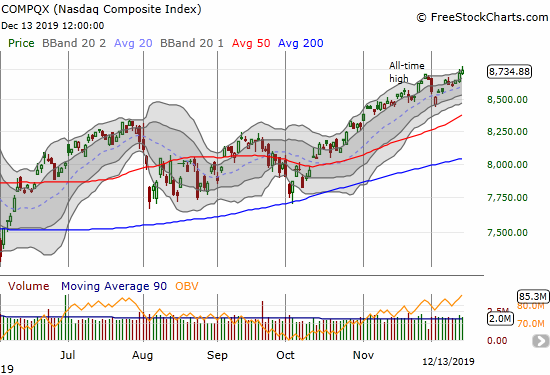
The NASDAQ (COMPQX) did slightly better than a flatline performance.
While the anti-climactic response is not surprising, I am not extrapolating further to expect a top in the rally. December is historically one of the most benign trading months of the year, and I am doubly impressed by the market’s stubborn optimism through so many Trade War headlines. A negative outlook does not even make sense until/unless the S&P 500 closes below the start of Thursday’s rally.
While this is not yet a time to get bearish, AT40 (T2108), the percentage of stocks trading above their respective 40-day moving averages (DMAs), is once again a point of caution. My favorite technical indicator failed to confirm last week’s rally, adding to my sense of an anti-climactic moment. AT40 has gone nowhere over the two months since the Partial Phase One Trade Deal was offered up too soothe markets. If AT40’s lack of confirmation persists, the stock market will get more and more vulnerable to a steep pullback. If AT40 begins declining into a full bearish divergence, I will definitely raise the red flag on the rally.
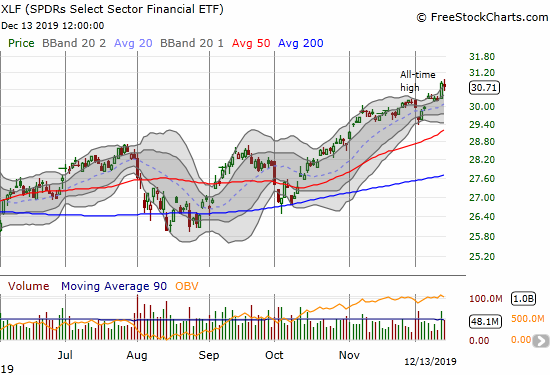
Financials were stand-out stars last week even in the wake of the Federal Reserve’s freshly dovish stance on monetary policy. The SPDRS Select Sector Financial ETF (XLF) came within 7 cents of its all-time high set on June 1, 2007 at $30.89/share (I got a little ahead of myself in labeling the chart below). Like so many major all-time highs, I am assuming XLF will churn and consolidate a bit around these levels before a fresh run-up. I will look to take advantage of the churn with a calendar call spread.
Volatility
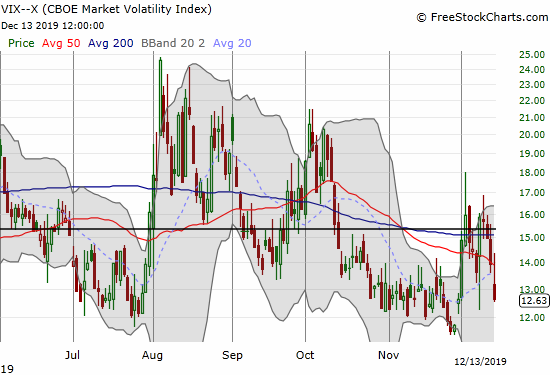
The volatility index (VIX) finished reversing its gains from the burst of angst on December 2nd and 3rd on renewed trade fears. The VIX’s reversal was a poetic exclamation point at the end of an anti-climactic day for the Trade War news.
Currency Markets On the Edge
The Australian dollar (FXA) checked in with its own contribution to the anti-climax on Friday. The forex partial proxy for Chinese economic health faded across the board on Friday. In particular, AUD/JPY reversed sharply enough to close the week right at its 200DMA. AUD/JPY’s nascent breakout hangs in the balance. The more the Australian dollar declines from here, the more cautious I will get. As soon as AUD/JPY confirms its breakout – now with a close above Friday’s intraday high – I will have to get a lot more bullish on financial markets.
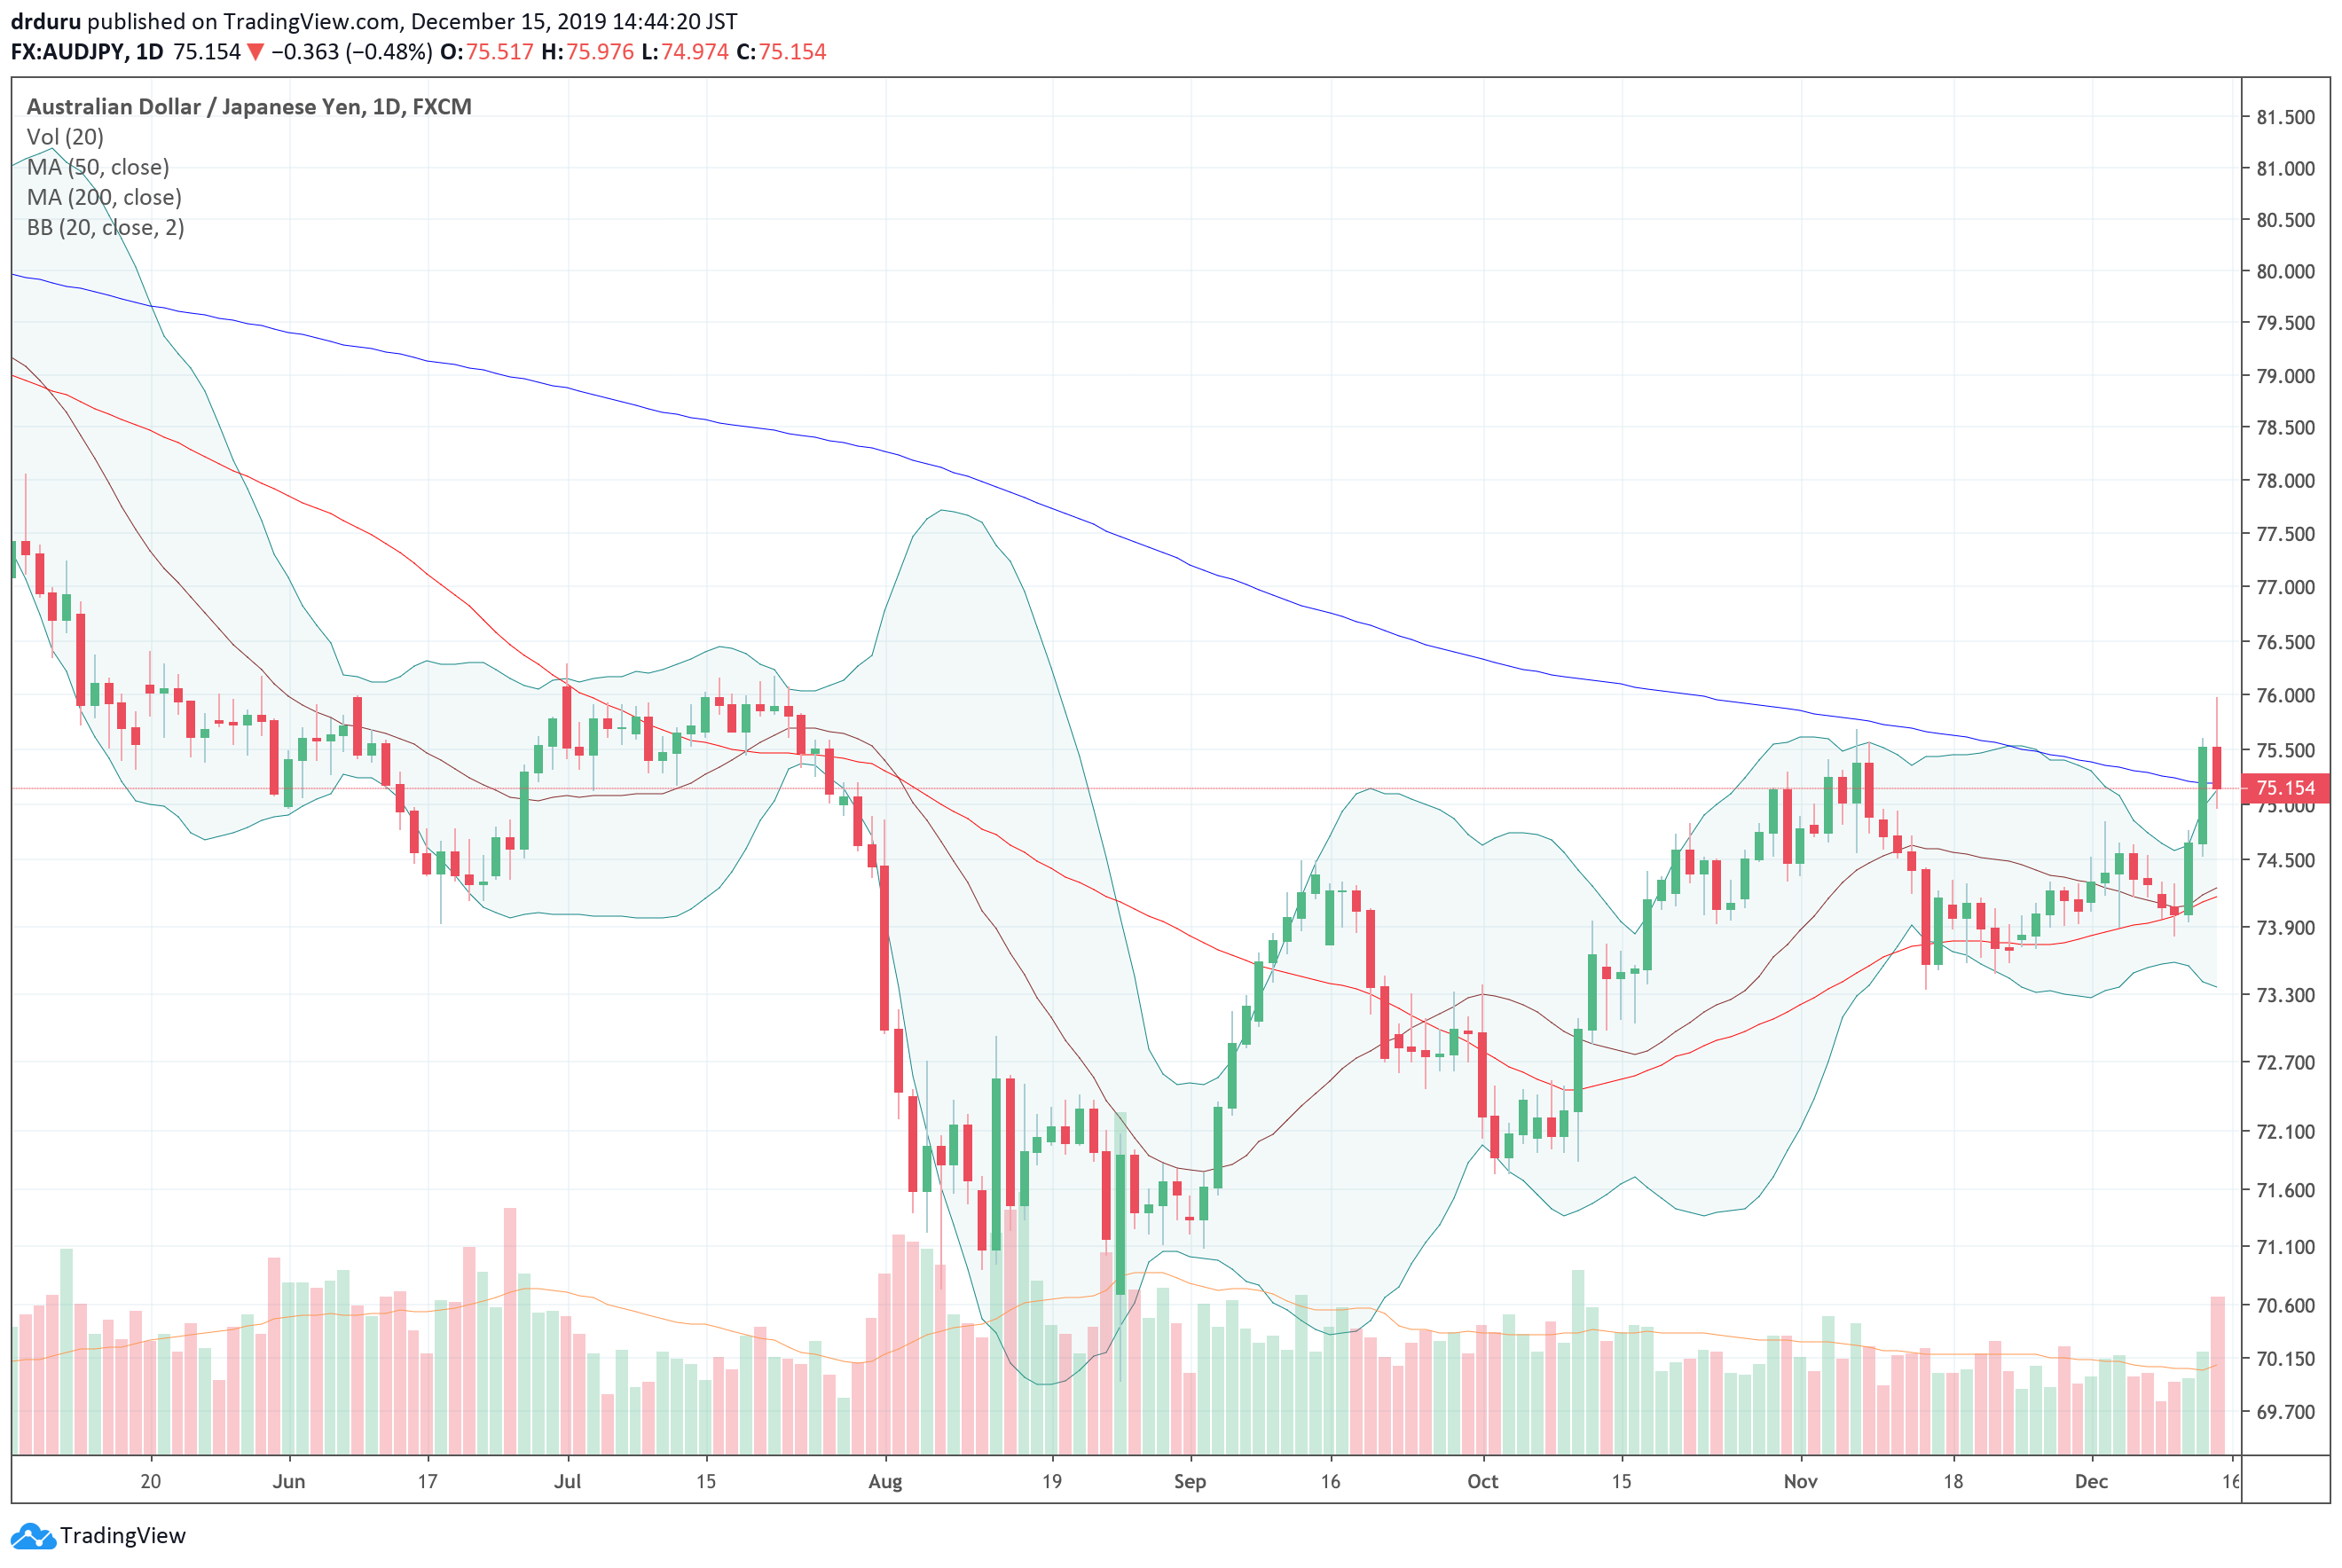
The Australian dollar (FXA) vs Japanese yen (FXY), AUD/JPY, tumbled back to the critical 200DMA trendline after looking ready to confirm its recent breakout.
The Trading Call
My trading call remains neutral even as the price action continues to swirl in favor of the bulls. The lack of confirmation from AT40 and the strong fade in AUD/JPY provide the latest reasons to keep a bullish trading call in check. The coming week will be a key test: A) does the market churn as it awaits actual details on the current trade deal and/or tries to guess about the prospects of the next phase of negotiations or B) does the market merrily continue to assume all is as well as it has ever been?
Stock Chart Reviews – Below the 50DMA
Coupa Software (COUP)
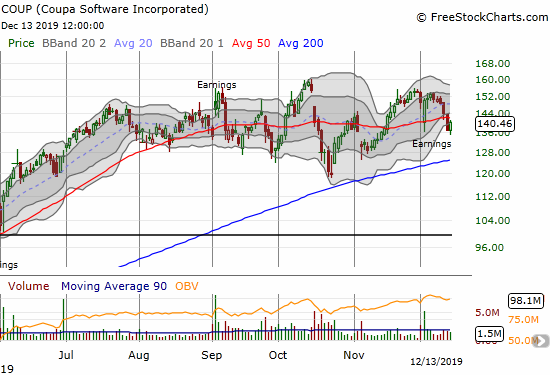
Coupa Software (COUP) gapped down after earnings earlier in the month. I thought the stock made a bottom from there. However, sellers warmed up again last week. COUP printed a fresh 50DMA breakdown and a post-earnings low. The stock is in a bearish technical position, especially with the potential triple top, but the initial downside is limited to a test of the uptrending 200DMA. At that point, I want to be a buyer with a stop below the October low.
MongoDB (MDB)
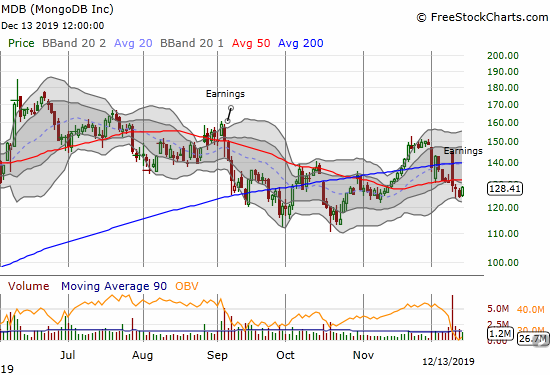
MongoDB (MDB) had the opposite post-earnings problem from Coupa Software’s. The stock gapped up nicely for a 200DMA breakout. Sellers took over from there. They were aggressive enough to push MDB through its 50DMA. The stock now trades in neutral territory. A break of last week’s low makes me bearish. I can only get comfortably bullish after the stock breaks above last month’s high.
Children’s Place (PLCE)
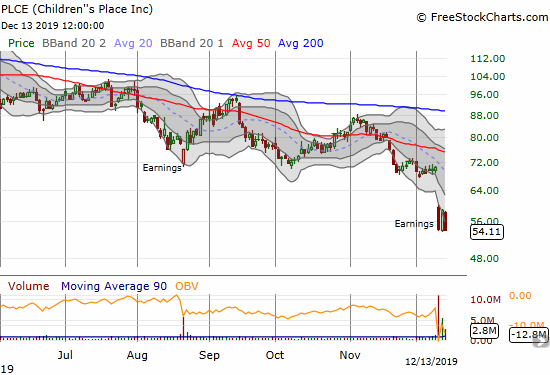
I have followed the trials and tribulations of Children’s Place (PLCE) through its stock chart for quite some time. Last week delivered the loudest confirmation of the bearish trend in PLCE. PLCE lost 23.1% on Wednesday. A nice relief rally the next day back to the lower Bollinger Band (BB) was quickly reversed the next day. The race is on to evacuate this stock…
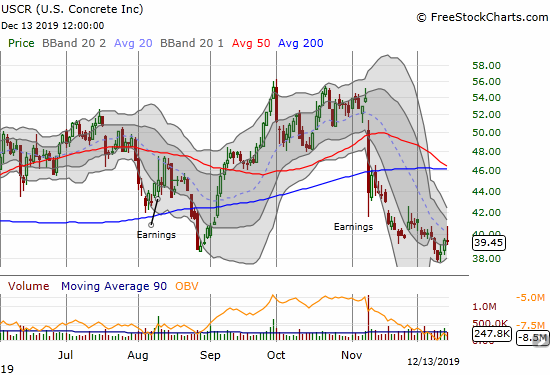
U.S. Concrete (USCR)
Per my previous post on U.S. Concrete (USCR), I bought back into the stock as it tested August support. Last week proved that support is tenuous. Still, I will continue accumulating stock if I can get further discounts.
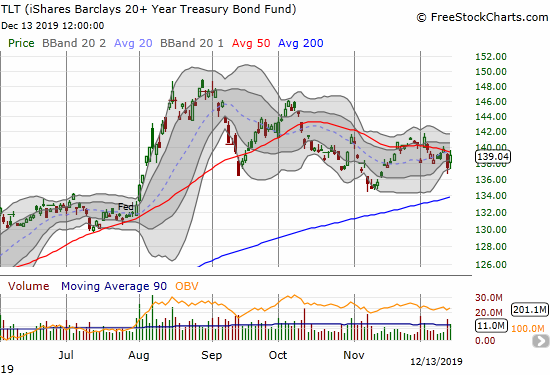
iShares Barclays 20+ Year Treasury Bond Fund (TLT)
At this point I do not know what to make of the iShares Barclays 20+ Year Treasury Bond Fund (TLT). Thursday’s drop made sense in the context of bets on a stronger economy. Friday’s rebound did NOT make sense given the good news of the day on trade. For now, it looks like TLT is just pivoting around its declining 50DMA.
Stock Chart Reviews – Above the 50DMA
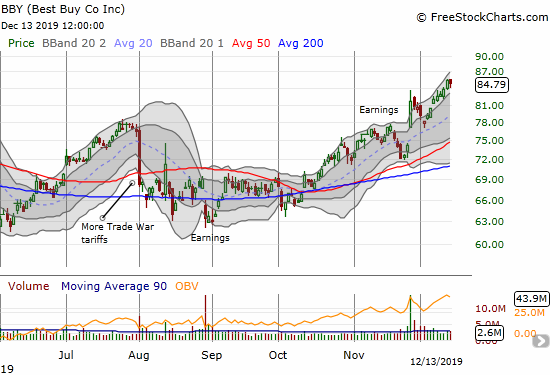
Best Buy (BBY)
Best Buy (BBY) is on a tear. The pullback from its big post-earnings pop was a great setup, but I failed to take the bait. On Friday, I decided to buy puts (again) on BBY but this time as a hedge for the next set of Trade War headline “mishaps.”
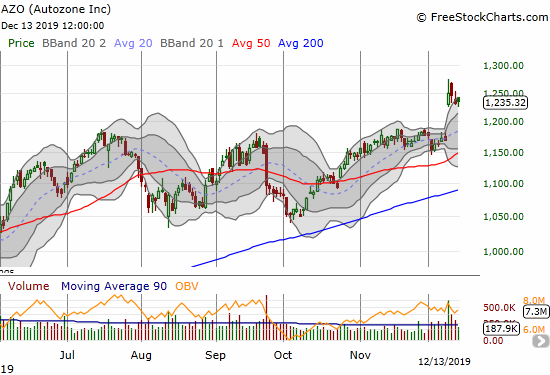
Autozone (AZO)
Autozone (AZO) is clearly a stock I should have just held. The stock hit another all-time high on another bullish breakout. I find it hard to comprehend an auto parts store acting like a momentum stock, but here it is. AZO is up 47.4% year-to-date. The party in AZO was interrupted from 2016 to 2018. The stock traded at just under $500 in the summer of 2017.
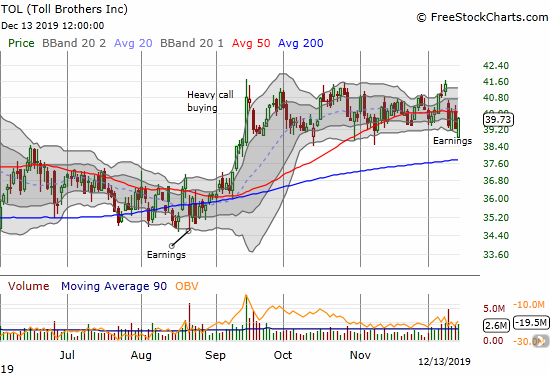
Toll Brothers (TOL)
Toll Brothers (TOL) sold off post-earnings. Surprisingly, most other builders did not drop in sympathy. TOL has been stuck in a consolidation pattern for three months. I cannot wait to see what happens when this stock finally breaks out or breaks down.
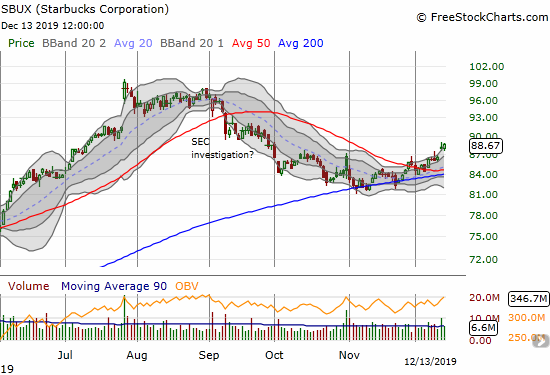
Starbucks (SBUX)
In early September, I discussed the bearish setup in Starbucks (SBUX). The tide is already turning in a major way. I bought call options on Friday as a very late attempt to participate in a very bullish breakout following a basing pattern at 200DMA support.
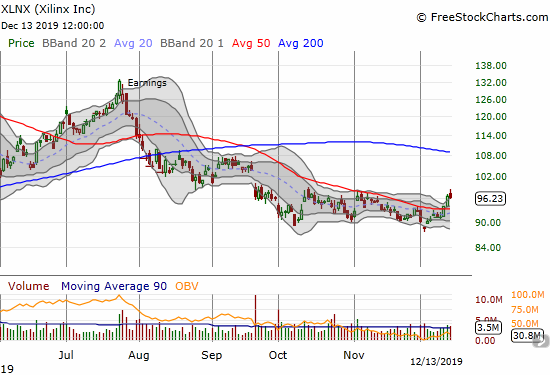
Xilinx (XLNX)
I almost forgot about Xilinx (XLNX). A timely tweet (thank you Twitter data scientists!) reminded me that I have been waiting for a new buying opportunity. Here it is: a near 3-month consolidation nearly ended by a 50DMA breakout.
— – —
FOLLOW Dr. Duru’s commentary on financial markets via email, StockTwits, Twitter, and even Instagram!
“Above the 40” uses the percentage of stocks trading above their respective 40-day moving averages (DMAs) to assess the technical health of the stock market and to identify extremes in market sentiment that are likely to reverse. Abbreviated as AT40, Above the 40 is an alternative label for “T2108” which was created by Worden. Learn more about T2108 on my T2108 Resource Page. AT200, or T2107, measures the percentage of stocks trading above their respective 200DMAs.
Active AT40 (T2108) periods: Day #232 over 20%, Day #71 over 30%, Day #46 over 40%, Day #9 under 50% (overperiod), Day #19 under 60% (underperiod), Day #59 under 70%
Daily AT40 (T2108)
")
Black line: AT40 (T2108) (% measured on the right)
Red line: Overbought threshold (70%); Blue line: Oversold threshold (20%)
Weekly AT40 (T2108)

*All charts created using FreeStockCharts unless otherwise stated
The T2108 charts above are my LATEST updates independent of the date of this given AT40 post. For my latest AT40 post click here.
Be careful out there!
Full disclosure: long VIXY calls, long XLNX, short AUD/JPY, long BBY puts, long SBUX calls, long USCR
*Charting notes: FreeStockCharts stock prices are not adjusted for dividends. TradingView.com charts for currencies use Tokyo time as the start of the forex trading day. FreeStockCharts currency charts are based on Eastern U.S. time to define the trading day.