
The ETF Performance
The 2019 seasonal trade for home builders was a dramatic one that departed from the typical script. The iShares US Home Construction (ITB) suffered greatly in the late 2018 sell-off. The housing market softened as one of the most notable features of the sell-off in the stock market. Several home builders made multiple year lows, and ITB hit a near 2-year low. Two weeks after that December low, ITB was suddenly at a 2-month high and a bottom was confirmed.
The sell-off was so dramatic that I was relatively confident ITB would top out in April or May as part of the seasonal trade on home builders. A sharp sell-off in May seemed to confirm that top, but ITB proved resilient. The index churned through a series of higher lows until a breakout in August pushed me into recognizing a kind of front-running of the next seasonal trade. Smaller builders, concentrated in entry-level and lower-priced homes, signaled the coming rally.
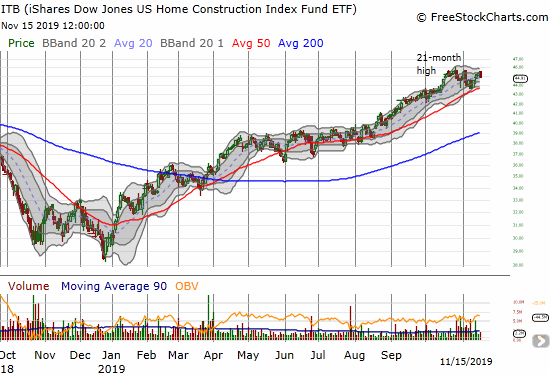
Source: FreeStockCharts
The August breakout gave me a profitable exit on my ITB calendar call spread at the time, but the cash-out left me under-positioned for the rally that I suspected lay ahead. I soon established another position, this time, a January $40/44 call spread that I continue to hold. I have also traded in and out of various home builders. I am not in a rush to accumulate positions for the 2020 seasonal trade given the pullback in ITB started right at the climactic January, 2018 top. If a double-top is underway, then I should be able to get new positions much cheaper from current levels. I am eyeing support at ITB’s 50-day moving average (DMA) as a point below which to take profits on my calendar call spread.
The Lessons
My key lesson from the 2019 seasonal trade was the importance of close monitoring and staying flexible. I had no idea the May top would not hold for the seasonal trade, but once the breakout occurred, I was ready to adjust. The chart below shows the performance of the seasonal trade since 2012. As a reminder, the season starts at the end of the October of the previous calendar year. The indexing on the x-axis starts with November’s 1-month annualized performance. The 2019 seasonal trade is represented by the thick black line, and it measures annualized performance starting from October 31, 2018. At #12 on the x-axis, ITB achieved a 43.2% gain from the close of October 31, 2018 to the close of October 31, 2019. Note how 2019 stands out in terms of its steady annualized performance through much of the season.
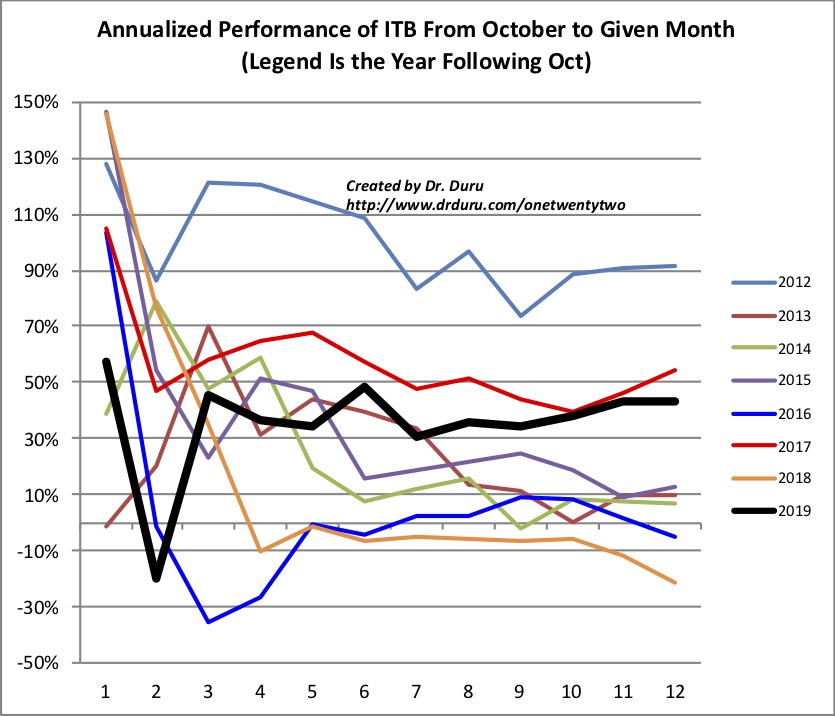
Source for prices: Yahoo Finance
ITB’s performance relative to the S&P 500 (SPY) was also remarkably steady for 2019. The chart below annualizes the monthly difference between ITB and SPY. There was never a good reason to switch from ITB to SPY. Indeed, this switching is one aspect of the seasonal trade I have yet to try over the years.
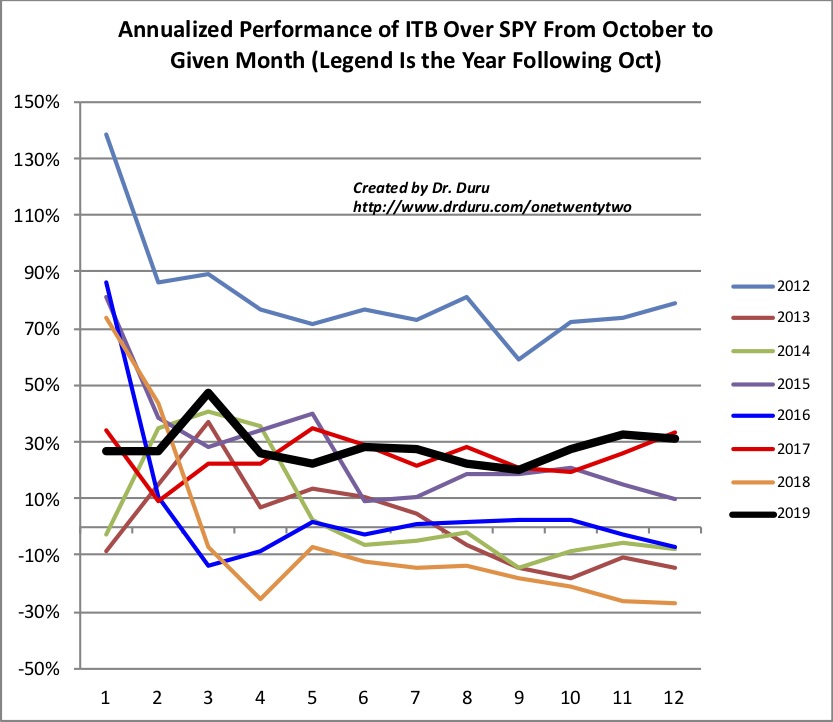
Source for prices: Yahoo Finance
The Next Trades
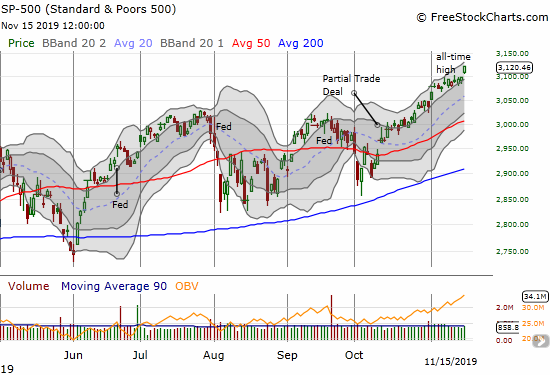
With the S&P 500 hitting new all-time highs, ITB is falling behind. This divergence suggests to me that I should be patient in picking my next spot. The ideal entry for the 2020 seasonal trade may not arrive until December, perhaps even January. This delay would be consistent with my observation that traders and investors seemed to front-run the seasonal trade this year. As always, I will be watching closely. Readers track of my latest thoughts by subscribing to this blog or periodically monitoring my tag for the iShares US Home Construction (ITB).
Be careful out there!
Full disclosure: long ITB call spread